
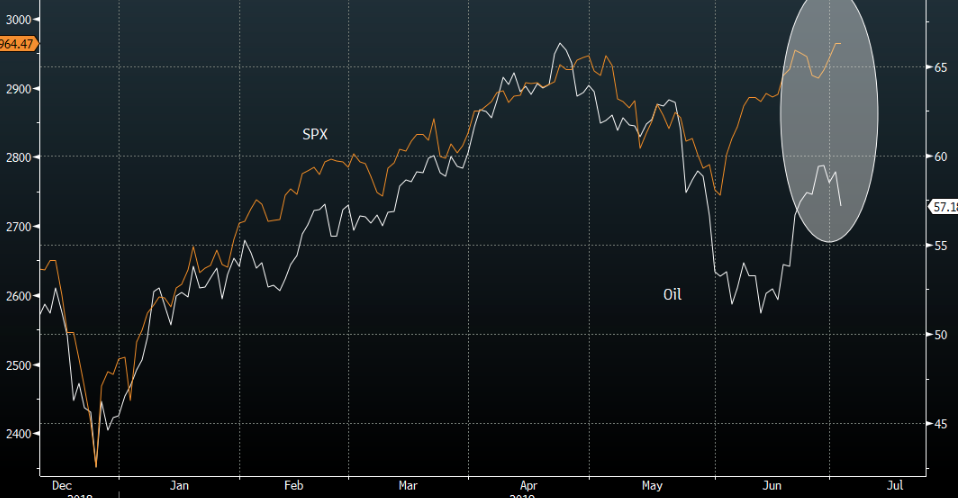
On Tuesday, the markets picked up where they left off in most every asset class but energy, as crude prices tumbled Tuesday to finish the session below $57 a barrel. The roughly 4% drop came on the heels of an announced OPEC supply cut extension, but may have already been baked into the price per barrel that has risen from the $50s to touch above $60 in the last couple of weeks.
The Organization of the Petroleum Exporting Countries and other producers such as Russia, a group known as OPEC+, agreed on Tuesday to extend oil supply cuts until March 2020 as members overcame differences to try to prop up prices.
“The OPEC+ meeting showed the members sticking together in tough times, characterized by weakening global demand outlook, aiming for a more balanced oil market, despite clear market share implications,” said Amarpreet Singh, analyst at Barclays Commodities Research in a note.
“This is supportive of oil prices, in our view, even as the market remains squarely focused on weak macro signals.”
The American Petroleum Institute reported late Tuesday that U.S. crude supplies fell by 5 million barrels for the week ended June 28, according to sources. The API also reportedly showed stockpile declines of 387,000 barrels for gasoline and 1.7 million barrels for distillates. Inventory data from the Energy Information Administration will be released Wednesday. The EIA data are expected to show crude inventories fell by 3.7 million barrels last week, according to a survey of analysts conducted by S&P Global Platts. The survey also forecast declines of 2.4 million barrels for gasoline and 1.4 million barrels for distillates.
With Crude oil prices retreating yesterday, equities still managed a late day rally, pushing the S&P 500 further into record territory and finishing the day at 2,973. Wednesday is a holiday shortened trading day on Wall Street. Equity markets will close at 1:00 p.m. EST and they will remain closed through the July 4th holiday on Thursday. Nonetheless, we would encourage traders to monitor the divergence of late in crude oil prices with respect to the S&P 500. Usually, the two have a positive correlation. While they can and do diverge from time-to-time, it’s worth monitoring given the energy sector earnings outlook that can be impacted from falling Crude prices.
Here is what Goldman Sachs had to say about crude oil prices going forward and with regards to the latest OPEC+ cut extension:
“On net, our take from this OPEC extension is similar to that of May 2017, with growing evidence of a lack of clear strategy among participating countries. Saudi stands out in its resolve to normalize inventories and push prices higher with limited evidence of such strong resolve by other participants including from its main partner, Russia, as illustrated by the diverging inventory targets. Ultimately, we continue to view the premise of open-ended cuts to make room for shale as unsustainable as a policy that seeks to keep prices above marginal costs will likely drive an every growing supply response, already visible in the increases in shale production and offshore drilling that have occurred since 2Q18. In the absence of further increases in disruptions and given the large rise in non-OPEC exc. US production slated for 2020, today’s decision implies greater cuts next year with little additional price appreciation possible and hence lower revenues. We ultimately view such a production strategy as unsustainable in the New Oil Order given the velocity and scale of shale production.
As a result, we don’t view this OPEC+ decision as derailing our forecast for $60/bbl Brent prices in 2020, driven by the decline in global marginal costs that will likely occur as the Permian – the world’s largest and lowest cost shale basin – becomes debottlenecked. The large sell-off in prices today suggests a similar assessment by other market participants. We therefore also maintain our Dec-19 Brent $55-60/bbl put spread trading recommendation and reiterate our view that US and other producers hedge their 2020 price exposure.“
What may be more troubling for the market near-term is not just the latest divergence between the S&P 500 and Crude oil prices, but that particular divergence is replicated in the year-to-date divergence in S&P 500 with the 10-year Treasury yield. (See chart below)
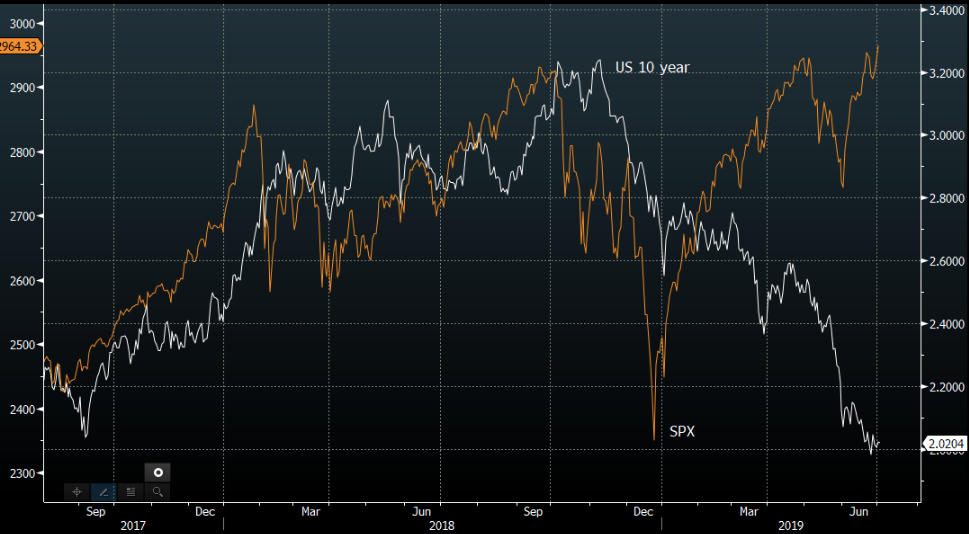
Even with the 10-year yield finishing at its lows of the day on Tuesday alongside crude oil prices, the S&P 500 managed to close at its highs of the day. Equity futures are continuing to rally Wednesday morning and ahead of the early close on Wall Street. In speaking of the 10-year yield, Tuesday’s low yield was the lowest since 2016, when the equity markets last feared the possibility of a recession, as investors grappled with a devaluation in the Chinese yuan and a potential hard-landing for the Chinese economy.
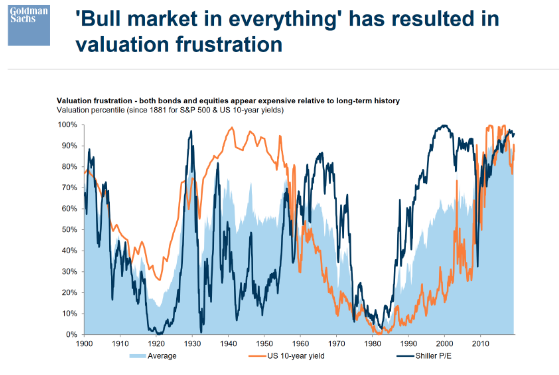
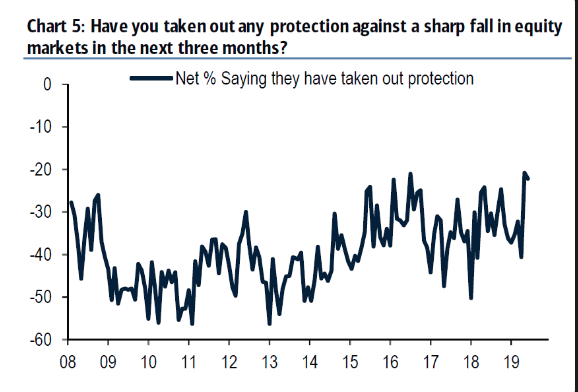
Most asset classes have risen through the year including equities, precious metals, currency, energy and bonds. The rise of everything has frustrated many economists and analysts alike. This is an extremely rare occurrence, which has found skepticism amongst the investor community that has decided in favor of low risk asset exposure and outsized hedging activity.
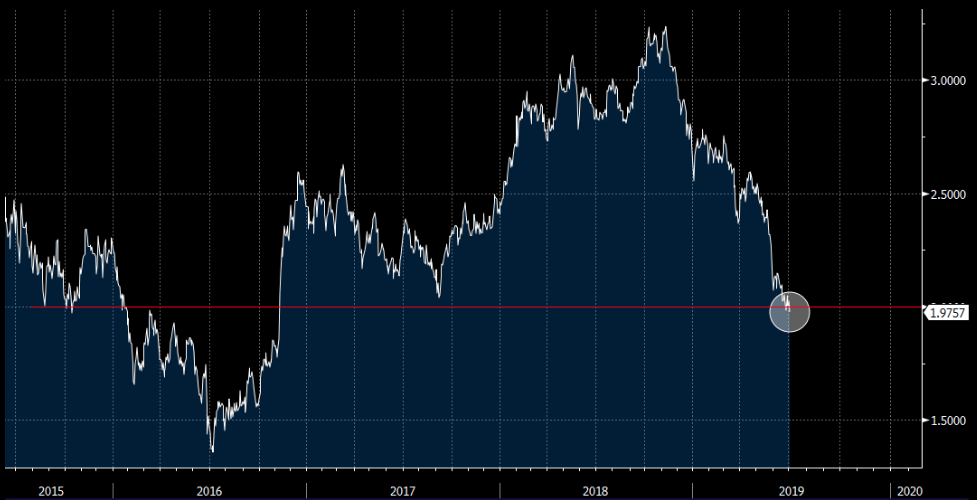
With yields edging ever lower in 2019, the bond market is pricing in lower economic growth and inflation. But to the extent this lends itself as a precursor to lower economic growth, that may need to be fulfilled from a continued decline in growth from outside of the United States. Why? Well with lower rates and energy prices coupled with record level unemployment levels, both rates and energy prices prove a boon for U.S. consumers. It would prove rather difficult to exact a U.S. economic recession as some are extrapolating from the latest rounds of weakening economic data given the aforementioned conditions.
The U.S. economy has now entered a record 11th year of expansion. The current recovery began in June 2009 and has lasted 121 months, breaking the previous record of 120 months set from 1991 to 2001.
While unemployment has fallen to a 49-year low of 3.6%, the pace of the current expansion is the slowest in the modern era. The sluggish economic recovery and expansion is a symptom of the depth of the last recession that found central banks in need of assisting the recovery process with additional stimulus to offset the psychological damage caused from the financial sector unraveling in 2008.
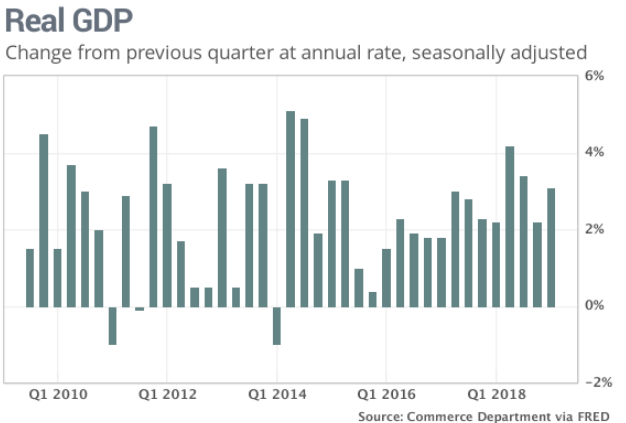
Gross domestic product, or GDP, has averaged just 2.3% since the U.S. exited recession in mid-2009. And for the first time since WWII, the economy has failed to reach 3% annual growth in any single calendar year. While the economy has exacted the longest expansion cycle in history, the stock market has also tripled in price, as earnings have accelerated off the 2008 bottoms. But for the Q2 2019 period, earnings are expected to take a step back, akin to their decline in 2016.
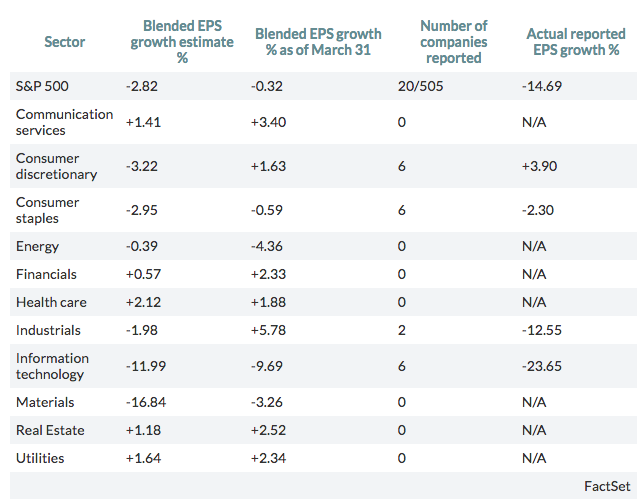
The blended year-over-year growth estimate for earnings per share for the S&P 500, which represents already reported results and the average analyst estimates of coming results, is negative -2.82% as of midday Tuesday, with six of 11 sectors estimated to post declines, according to data provided by FactSet.
To-date and with 20 of the 505 S&P 500 companies, or about 4%, having already reported results, actual reported EPS is down 14.69% from a year ago. This is largely due to companies like FedEx and Micron having specific issues related to growth overseas and the restrictions placed on Huawei by the USTR. The information technology sector is expected to have the 2nd largest EPS decline for the Q2 2019 period, as semiconductors have suffered from a peak smartphone cycle coupled with an ongoing trade feud, but Goldman Sachs suggests their is a light at the end of the tunnel for the semis:
Goldman went to see a number of China semiconductor companies:
- The companies we visited expect the industry to resume growth in 2020, driven by 5G infrastructure and the rollout of applications.
- The companies also see the slowdown that started in 1Q19 as a natural part of the inventory digestion cycle post the 20-30% YoY growth in 2H16-2H18 rather than a signal that the industry is on a long-term declining track, given end applications are not disappearing, except for cryptocurrency, which carries higher uncertainties in terms of market demand.
- Although ongoing US-China trade tensions could be a long-term overhang, China semiconductor companies seem confident that the growth of market demand for semiconductors could offset the negatives from trade tensions.
The last time the S&P 500 suffered an earnings recession was the second quarter of 2016, when earnings declined for four straight quarters. Even so, the market rallied in 2016 and beyond the U.S. election.
Earnings season will kick off on Monday, July 15, with five S&P 500 companies scheduled to report results including Citigroup (C). Here are the blended second-quarter estimates for all 11 sectors, including what the estimates were as of March 31 and the actual reported results:
Mark Hulbert recently offered investors the suggestion that an earnings recession might not be as scary for investors as it sounds. “But based on what happened during the last recession, investors may not enjoy the ride too much.”
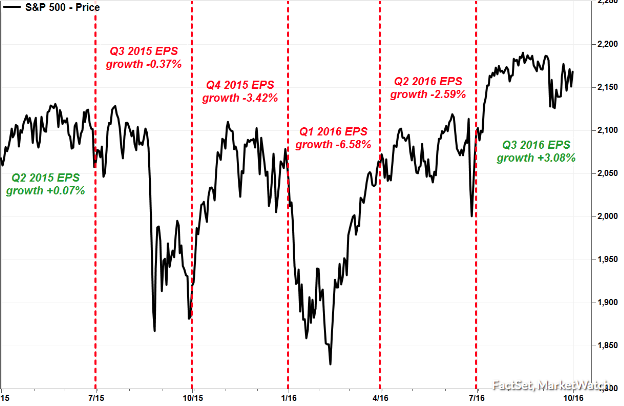
The S&P 500 started the last earnings recession with a 6.9% tumble during the third quarter of 2015, but rose the next three quarters for a total gain of 1.7% during the four-quarter streak of EPS declines.
One of the reasons that equities actually tend to perform better than most would expect during an earnings recession is largely due to the fact that the market is forward looking. This basically infers that the earnings recession was already forecasted and priced into the market. We can see this was recently the case in Q4 2018, where the S&P 500 dropped from its highs to low by roughly 20% during the period. But since then and with FactSet reporting a decline of roughly -.4% in Q1 2019 EPS, the market has risen more than 17 percent.
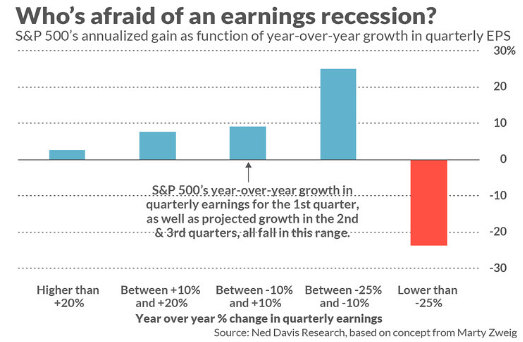
According to data compiled by Ned Davis Research, since 1927, the firm found the stock market has performed the best in those quarters in which the year-over-year EPS growth rate for the S&P 500 was between 10% and 25% lower. In such quarters, the S&P 500’s average annualized return was 25.0 percent. When year-over-year earnings growth was above 20%, in contrast, the S&P 500 gained an average of just 2.6% annualized.
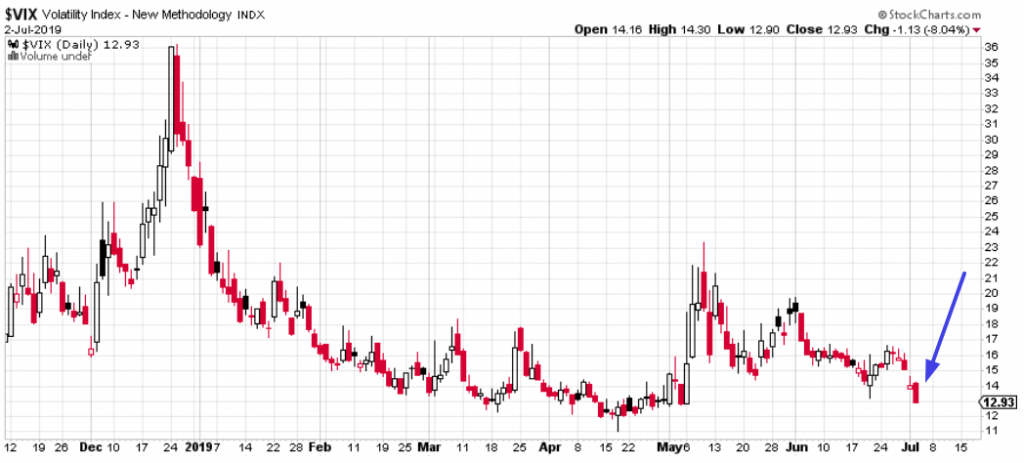
While we don’t need to offer up yet another market divergence as they all tend to smooth out and normalize over time, the VIX decline this week has been rather robust. Over the last 5 trading sessions the VIX is down roughly 20%, and down 30% over the last month. Additionally, the VIX fell more than -8% Tuesday while the S&P 500 rallied less than 0.3 percent. This is uncommon, because the VIX doesn’t usually fall this much on such a small stock market rally. Having said that and having tracked the overall market hedging activity through 2019, we’re forced to recognize that the outsized hedging activity leading up to the G-20 Summit meeting, has been unwinding since, producing the somewhat outsized moved lower in the VIX of late despite the modest gains in the S&P 500.
Remember folks, it was just a couple of weeks ago that the S&P 500 rose by more than 1% but the VIX also rose because of fears surrounding tariff threats on Mexico and the adverse shock potential to the North American economies. Headlines were suggesting the VIX was sending investors a warning signal and yet, the market continued higher.
So now with all those hedges unwinding and the pace of the S&P 500 advance slowing, it should come as no surprise that the VIX is collapsing harder than the S&P 500 advance. Nonetheless, let’s take a look at what history suggests this portends for the future. Remember, the VIX fell 8% on Tuesday with just a small .3% advance in the S&P 500.
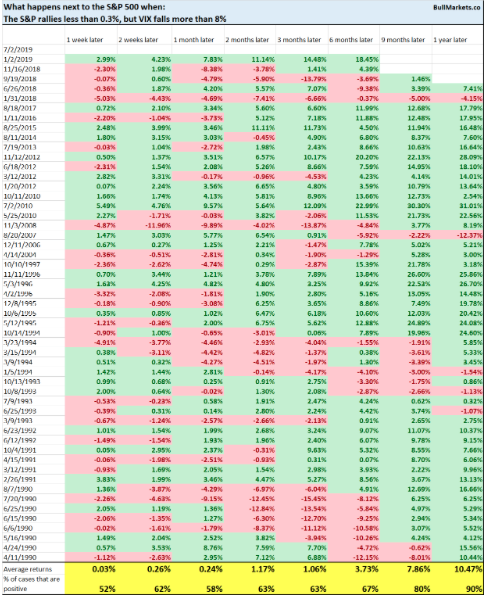
According to a recent study by Troy Bombardia, when the VIX declines by -8% while the S&P 500 has advanced just .3%, the forward returns on the S&P 500 are mostly random and bullish longer-term.
But that which may prove beneficial for the S&P 500 may not prove as beneficial for volatility in terms of the VIX index. The VIX has fallen below 13 for the first time in more than 40 days. With this occurrence and looking forward at the potential for the VIX, it was almost exclusively bullish for the VIX 3 months later. VIX tends to be lower-bound, which means that as the S&P 500 keeps rallying, VIX doesn’t go much lower. Tell that to the VIX in 2017, when the VIX averaged 11.11 for the year. Again, let’s look at this occurrence historically to try and understand what tends to occur with the VIX going forward.
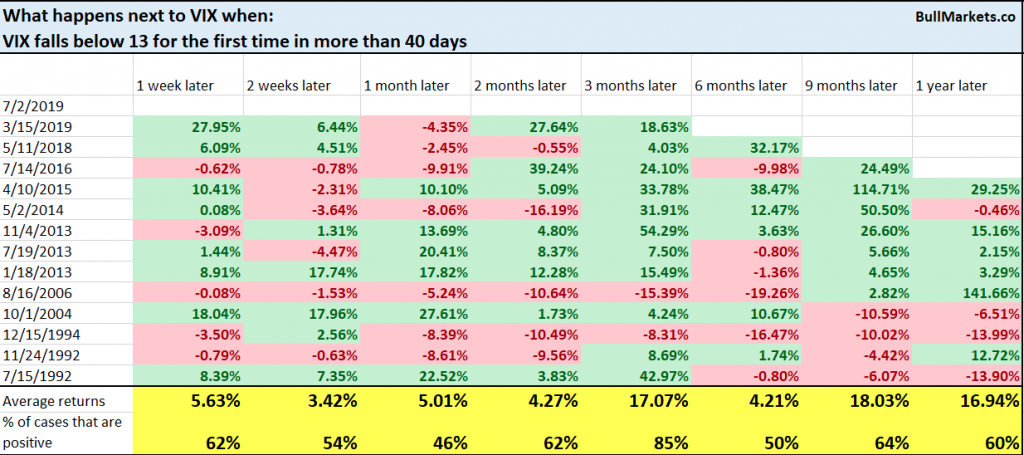
As we can see from the table above, the VIX rises slightly above average across all timelines and out 12 months. Having said that and based on present levels, with respect to the table, even a maximum rise out 9 months of 18% would only find the VIX around 15.50. Are you long or short volatility?
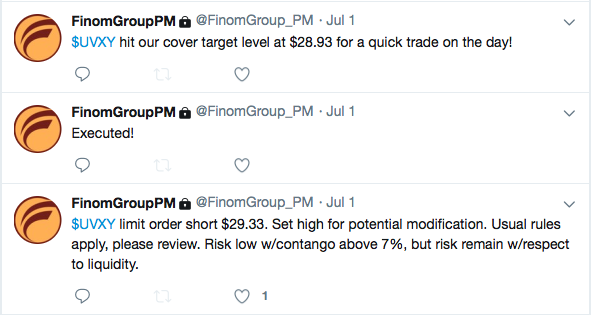
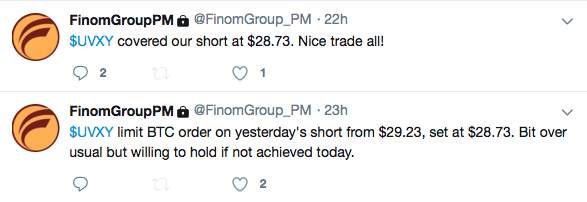
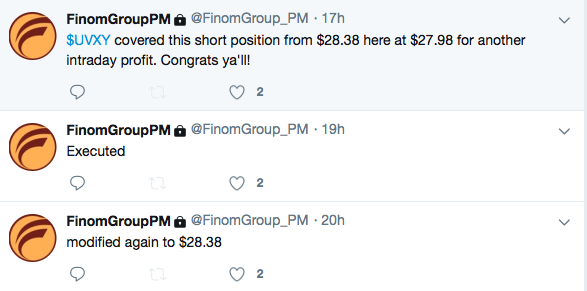
With volatility in question near-term, Finom Group continues to trade the VOL-complex daily and weekly with a long-term viable short-VOL strategy that has proven to offer substantial profits. In the current trading week, our Premium members have benefitted from three successive short-UVXY trade alerts as follows:
Ahead of the market open Wednesday, the two market moving events for the day are likely going to be tied to the economic data releases.
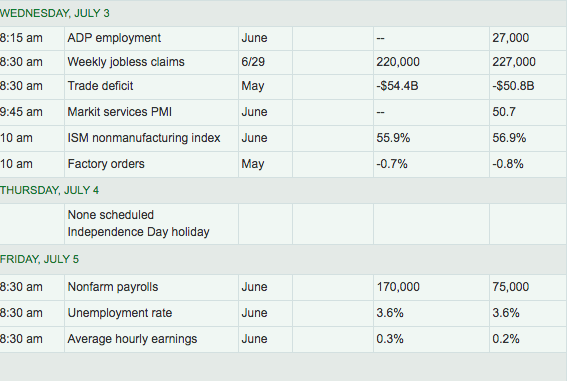
ADP private sector payrolls are due out at 8:15 a.m. EST and may prove a little more market-moving based on the implications for future Fed rate cuts. Weekly jobless claims, which jumped roughly 11,000 in the previous week are expected to moderate lower when released at 8:30 a.m. EST. Of course, when investors return from the 4th of July holiday on Friday they will be confronted with the release of June’s Nonfarm Payroll data. Given all of that, here is what J.P. Morgan suggests may prove to be catalysts for the market near-term.
- US jobs for June on Fri 7/5–the St is modeling a notable improvement to +160K from the poor +75K in May (if jobs get back over 100K, that would further reduce the odds ofa 50bp cut on 7/31)
- Fed communications–Powell will testify 7/10-11 while minutes from the last FOMC meeting will hit 7/10. These communications will help set expectations for the 7/31 meeting
- China’s Q2 GDP and June data(IP, retail sales, and FAI) will hit Mon morning 7/15
- CQ1 earnings–the season kicks off w/the banks on Mon 7/15 and will continue until early Aug
- Mueller testifies before the House on 7/17;
- Flash PMIs for Jul hit on Wed 7/24 (this will be the first major eco data point for July)
- ECB decision Thurs 7/25 –investors will be listening closely for any further clarity out of Draghi about next policy steps
- US Q2 GDPwill hit on Fri 7/26
- The next FOMC meeting decision occurs on Wed 7/31 (this will be right in the thick of the CQ2 earnings season).


