
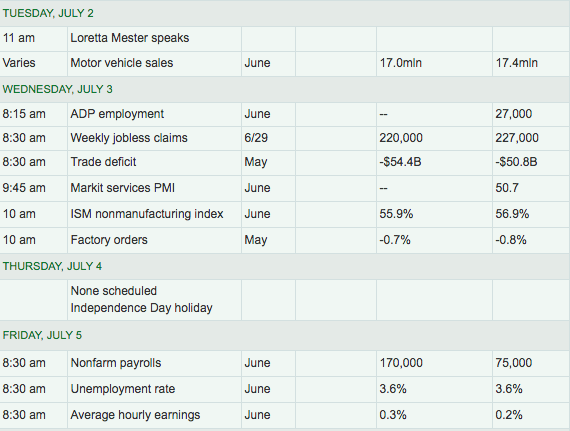
There’s no secret as to what proved to move markets Monday as we continue through this holiday shortened trading week, U.S./China trade truce. But for those who don’t study the S&P 500 risk-pricing through the options market, they may have missed the reasons for the peak and valley action expressed Monday. In Finom Group’s weekly Research Report we outlined the S&P 500 weekly expected move of $52/points. Additionally and as reiterated in the screenshot below, the expected move for Monday was $35/points.
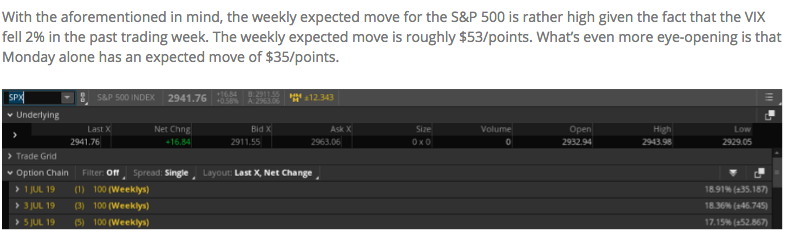
Consequently, when the S&P 500 rose $35/points, the benchmark index exhausted the daily expected move and profit taking ensued, as options exercised. All three major indices finished higher on the trading day with the S&P 500 setting yet another record-level high.
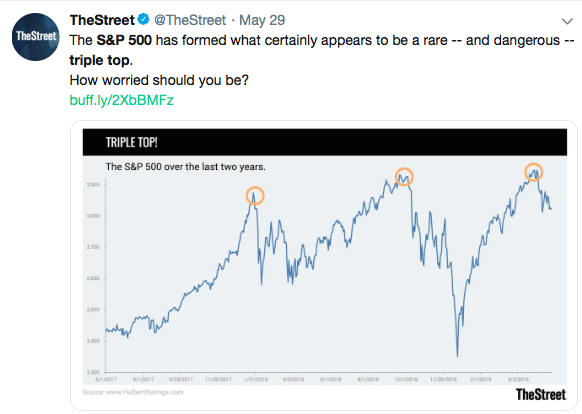
As recognized in the Street.com tweet/article above, we’ve seen the S&P 500 make a triple-top to achieve these successive new highs from January 2018 through July2019. The media does a splendid job of committing to fear-mongering. Be it a double-top, triple-top or quadruple-top, the only way to produce these hyperbolic headlines is through the existence of time and earnings growth that propels the equity markets higher. The headlines are meaningless and investors are better served ignoring them in favor of fundamental market study.
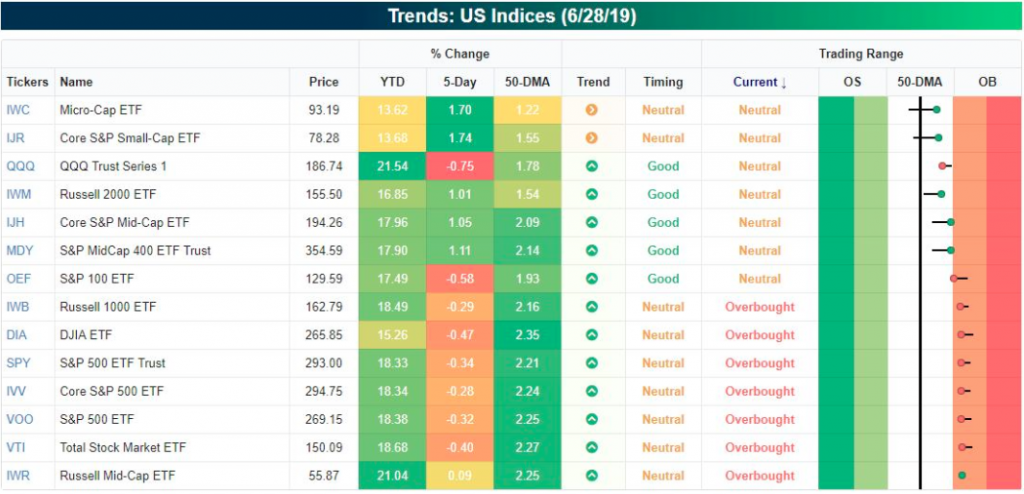
While we continue to hear the utterings of overbought conditions and the market’s near term doom, the reality is that only half of the major index ETFs were overbought going into Monday’s rally on Wall Street. (Chart from Bespoke Investment Group)
None of this suggests the market will or won’t continue to move higher or turn down this week. Additionally, investors with a longer-term time horizon should pay less attention to the near-term and focus on the future probability of the stock market. Finom Group remains of the opinion that the market will find higher prices by year’s end. The gains won’t happen in a straight line, but the gains are statistically and fundamentally likely. With that outlook as our backdrop for the H2 2019 period ahead, we aim to look at historical statistics when the market has had a strong H1 for the year. Firstly, we offer the following chart for recent market performance during the month of July below:
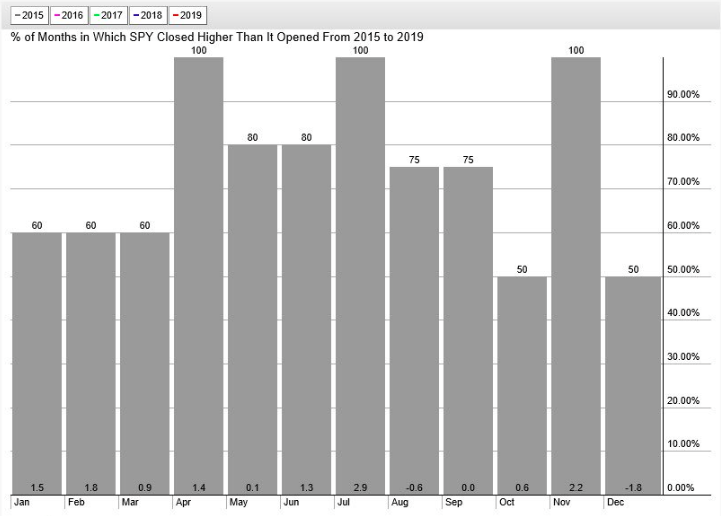
The S&P 500 has moved higher the last 4 years in July for an average return of +2.9 percent. Of course, none of the last 4 years have had such a strong H1 performance. But in keeping with our studies…
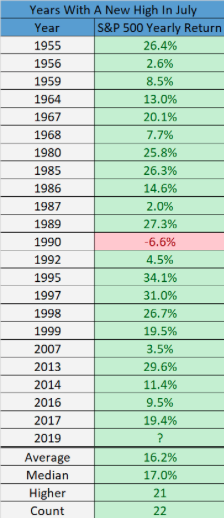
Since WWII, the S&P 500 has made a new high in July 22 other times. The full year closed higher 21 of those times. Some of the occurrences have taken place within the last several years.
So how much is left in the market’s proverbial tank after such an impressive start to 2019? In the 1990s, big starts to a year only led to further strong gains; the problem is, if you go back further in time, weakness is quite normal,” explained LPL Senior Market Strategist Ryan Detrick.
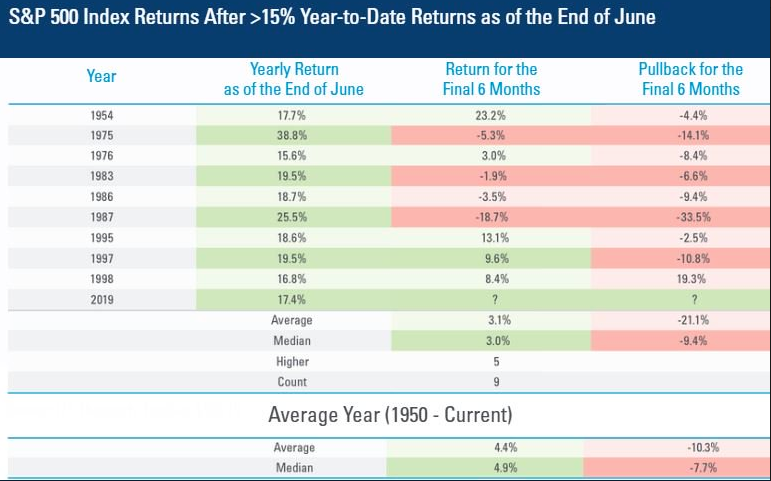
As shown in the chart above, after a big start to a year, the final six months not only have shown below-average performance the rest of the year, but also above-average pullbacks. It’s important to denote that we haven’t seen such a strong market performance in the first half of the year since 1998 and a lot has changed in the economy, world and equity markets since that time. Near the top of that list of changes over time are the rise of passive investing and the shifts in market liquidity due, in part, to passive investing and programmed trading.
What’s next for the markets will largely be determined by the path of earnings and with the onset of earnings season that becomes more apparent when the banks begin reporting on July 15, 2019. Through earnings season the potential for a pullback in the market is contemplated and proposed as likely by several analysts, especially with the S&P 500’s price-to-earnings multiple expanding, stretching valuations. The forward 12-month P/E ratio for the S&P 500 is 16.6. This P/E ratio is above the 5-year average (16.5) and above the 10-year average (14.8).
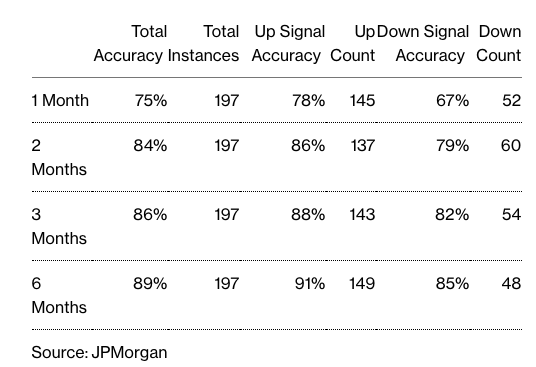
J.P. Morgan Chase believes a pullback is imminent based on its model that uses artificial intelligence (AI). The firm applies an algorithm with an aim to predict the direction of asset prices using five inputs that trace data back to 2006, including: fund flows, economic momentum indicators and investor positioning. J.P.Morgan’s strategy team, who built the model with the firm’s AI group, says it has a success rate of between 75% and 89% over one, three and six-month periods. After July, it expects stocks and yields to rise.
“Our model currently implies a bearish outlook for equities over the next 1-3 months with a ‘down’ signal for horizons of one month, two months and three months,” the strategists led by Nikolaos Panigirtzoglou wrote in a note June 28. “The S&P 500 signal for the six-month horizon is bullish however, suggesting that any near term correction in equities would revert before year end.”
Here’s how the team assesses the success of the so-called Random Forest algorithm at predicting the direction of the S&P 500:
J.P. Morgan Chase isn’t alone in its belief the market will correct near-term. Morgan Stanley’s chief market strategist Mike Wilson continues to warn investors of an overinflated market.
“A pause in rising trade tensions is not a fix for slowing U.S. economic activity and earnings pressure,” wrote Michael Wilson, equity strategist at Morgan Stanley, in a Monday research note. “In November, a truce brought a short-lived rally to the S&P, but ultimately induced procurement managers to cancel orders as inventories were already high and there was no longer an incentive to stockpile ahead of incremental tariffs.”
Wilson said this time around, “the set up will be similar,” but the reaction potentially worse, given that economic data are pointing to a slowdown in the U.S. and abroad.
“The S&P 500 rose close to 1.5% on the Monday after the [November trade truce]. Sound familiar? Well, after that one-day pop on December 1, the S&P 500 then had its worst December on record,” he wrote. Monday’s equity-market rally was already fading in afternoon trade.
Conveniently, what is not mentioned by Mike Wilson is the difference between this trade truce announcement and the former, 2018 G-20 trade truce announcement. The 2018 trade truce announcement was accompanied by a December rate hike and the FOMC outlining a forecast for at least 2 rate hikes for 2019. That situation is vastly different now, whereby the FOMC is not only pausing rate hikes in 2019, but signaling a rate cut near-term. How convenient for Wilson to leave out such an important detail. Nonetheless, rate hike, cut or pause, this alone doesn’t solely determine the direction of the market going forward. There are always a number of considerations impacting markets in the short-term.
In outlining their concerns for the market both near-term and for 2019, Morgan Stanley’s entire team was out with various warnings and notes on Monday. The notes are depicted in the following bullet points:
Morgan Stanley`s so-called “three wise men”!
- Chetan Ahya: “This is an uncertain pause – no immediate escalation, but still no clear path towards a comprehensive deal…as things stand, we lack clarity on whether real progress was achieved on the sticking points that caused talks to break down in the first place…hence, our overarching conclusion is that the developments over the weekend on their own don’t do enough to remove the uncertainty created by trade tensions.”
- M. Zezas: “…there’s no indication of progress on key sticking points. An uncertain pause doesn’t do enough to remove the overhang. After the initial reaction, we see the most upside to EM fixed income, and the most downside to US HY credit, US equities and the dollar…We could be wrong if, in the coming weeks, evidence of substantive progress emerges on key points of intellectual protection, tariff and non-tariff action and deficit reduction. We are watching three signposts: 1) Whether meetings and calls resume; 2) Revelation of details that show key issue gaps are closing; and 3) Domestic pushback in both countries.”
- Wilson: “…we see further momentum unwind as rising recession risk hurts the long side of the factor…we would fade this rally in junk/value/cyclicals and see even greater risks of an unwind of the long side of momentum…This time around, we think the setup is similar except that economic data like ISMs are already headed lower now in contrast to some positive momentum last November. An accommodative Fed could cushion the blow, but likely won’t prevent it…the second half of the year tends to be a seasonally weaker time for earnings revisions and the underperformance of seasonality in revisions seen year to date is not an encouraging sign. If management teams hold out hope for a recovery by linking growth to a resolution on trade, we think it just delays the disappointments and the market likely will not buy it like it did in January
For every warning about what may lay in-store for market investors there are opposing views. Some analysts are of the opinion that the recent trade truce and easy financial conditions warrant a greater risk appetite.
“It’s “go time in equities with ‘high beta’ grab-in across cyclicals likely thanks to the trade truce glide path,’’ wrote Charlie McElligott, cross-asset strategist at Nomura Securities.”
“Accommodative central bank policy, easier financial conditions, a strong U.S. labor market, and elevated margin sentiment support multiple expansion and cyclicals relative to defensives,” Dennis DeBusschere, head of portfolio strategy at Evercore ISI, wrote in a note to clients.”
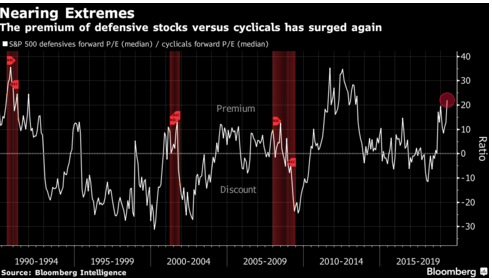
Over 2/3rds of cyclical stocks have advanced over the past three months, and the share of defensive equities outperforming has turned negative, according to DeBusschere. That’s a “concerning trend” for safe stocks, and “especially so given the group’s elevated price-to-earnings relative to cyclicals.’’
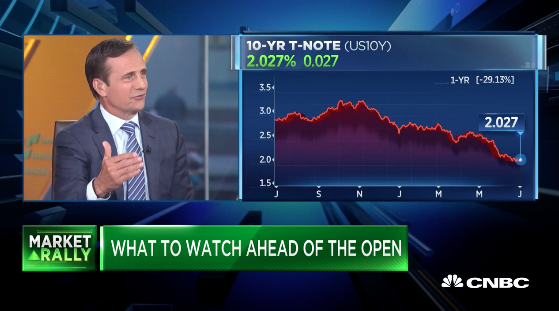
In addition to the positive risk sentiment denoted by certain analysts, Ironside’s Barry Napp recently spoke to CNBC. In his on-air interview, the fund manager discusses why he believes the economy remains on firm footing and why investors should buy equities now and for the long-term. Within the video positioned below, Napp also denotes his expectations for some form of a U.S./China trade deal going into an election year.
The U.S. economy grew nicely in Q1 and at above trend growth pace. Since then, there has been recognizable slowing in the economy as the global trade feuds, tariff increase and threatened tariffs have materialized. Some of the threatened tariffs have proven as damaging to the soft economic data as the imposed tariffs to the hard data. Speaking of the soft/sentiment data, Monday’s release of the June ISM manufacturing data didn’t disappoint.
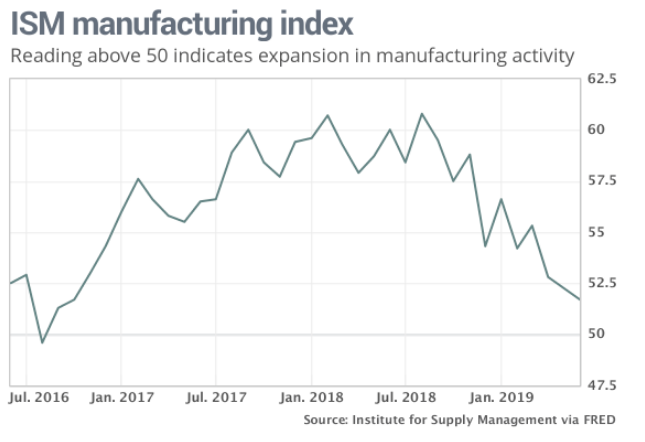
Manufacturing was expected to slow further in the month of June and that is exactly what happened as increased tariffs on China and threatened tariffs on Mexico took their toll on business operator sentiment and spending plans. U.S. manufacturers grew in June at the slowest pace in more than two years, hurt by trade tensions with China and Mexico and weak exports, a survey of executives found. The Institute for Supply Management said its manufacturing index slipped to 51.7% in June from 52.1% in the prior month.
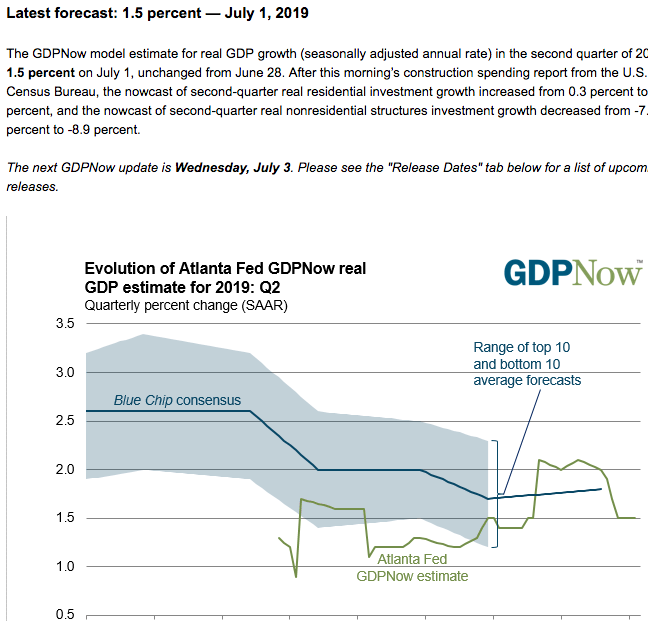
The index hit a 14-year peak of 60.8% last August, but it began to decline after a U.S. trade dispute with China intensified and spurred a round of tariffs by both countries. What the Tax Reform package giveth to the economy and business sentiment, the tariffs imposed in mid-2018 taketh away. But with a more firm trade truce and increasingly accommodative central bank, a second half rebound may become increasingly probable. Even with the weakened ISM manufacturing and construction spending data delivered Monday, they did not prove to negatively way on the Q2 GDP outlook for the Atlanta Federal Reserve, which remained unchanged from its last revision.
With more economic data to come and possibly the most relevant of the week being the Nonfarm Payroll report, investors have to look forward to earnings seasons and what is shaping up to be a potential decline in EPS on a YoY basis.
According to FactSet and for Q2 2019, the estimated earnings decline for the S&P 500 is -2.6 percent. In contrast to FactSet’s estimates, Lipper/Refinitiv expects EPS to grow .2% YoY for the Q2 2019 period.
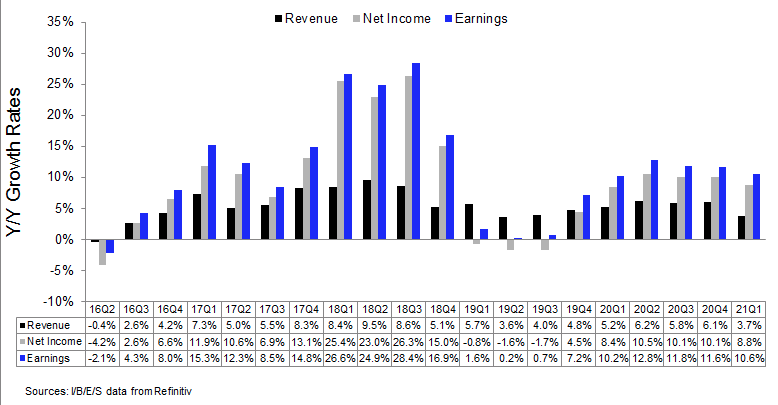
According to Lipper/Refinitive, the 19Q2 blended revenue growth estimate is 3.6 percent. Excluding the energy sector, the revenue growth estimate is 3.9 percent.
Also, 75.0% of companies have reported 19Q2 revenue above analyst expectations. This is below the long-term average of 60% and below with the prior four quarter average of 63 percent.
With regards to earnings and the economic outlook, as the two are intertwined over time, the correlation between imposed tariffs and the economic slowdown are apparent. While the imposed tariffs have not been repealed, the trade truce that serves to boost agricultural trade, strengthen IP protection and remove restrictions on China’s Huawei business transactions with U.S. entities could be enough to recapture business confidence and spending activity. We don’t expect an immediate return from the trade truce, but one that when combined with a Fed rate cut serves to stimulate growth once again.
Having said all of that, the U.S. equity futures are modestly lower ahead of the opening bell on Tuesday. OPEC has officially extend the oil production cuts over the next 9 months, which could serve to stabilize oil prices as the U.S. continues to disrupt the demand picture, doubling its oil production/output over the last 5 years. Crude oil touched just above $60 a barrel in Monday’s trading session, but subsequently pulled back below $59 a barrel.
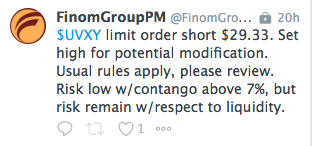
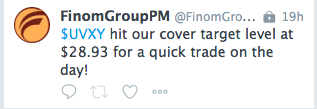
Whatever the market delivers, Finom Group will be actively trading and delivering trade alerts to Premium members as depicted in our trade of the day for Monday in the volatility complex.
We are still navigating a challenging environment. Investing comes with uncertainty, and market volatility can be alarming, but we continue to encourage investors to look beyond the short-term market stresses and consider the real drivers of investment returns over time.


