
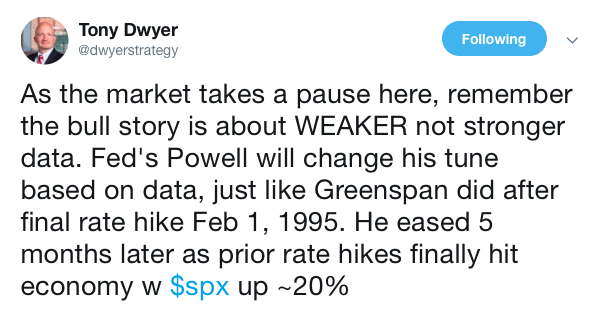
Yesterday’s economic data was once again the highlight of the trading day. Now before you get all “up in arms”, that was just a joke. Of course the highlight of Wednesday’s trading was the Fed Chair’s press conference, post the announcement of no rate hike or cut. Why we are actually talking about a rate cut is only a reaction of the market seemingly pricing in such an action from the Fed by year’s end and as seen through the Fed Fund contracts.
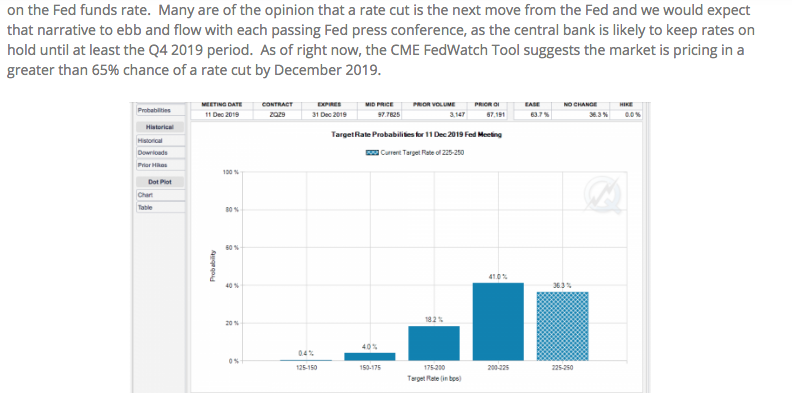
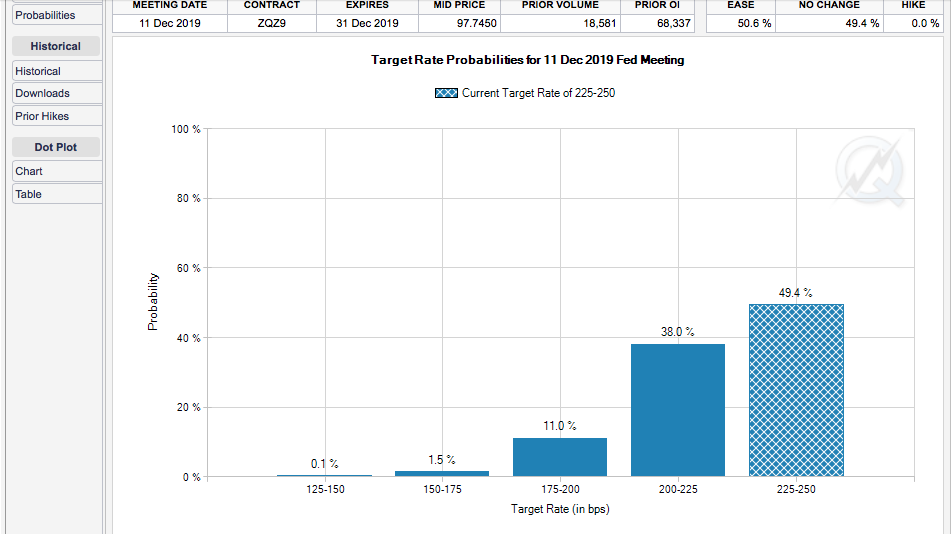
As shown in the screenshot above, from our previous article, the market was pricing in a 65% chance of a rate cut by December 2019. As shown in the following screen shot of CME Fed Fund contracts, that probability of a rate cut has been reduced to roughly 50% after the Fed Chair’s press conference on Wednesday.
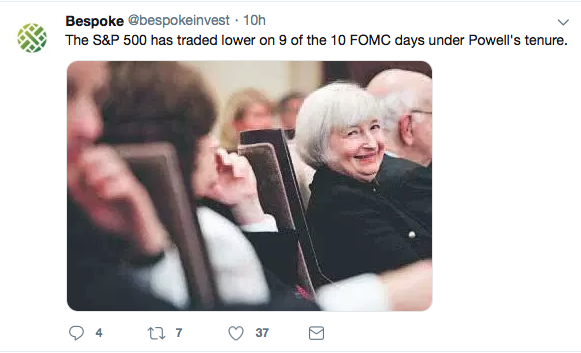
As far as the Fed’s rate announcement, it was widely understood no rate hike or cut was probable for the May 1, 2019 meeting. But that’s not why investors and economists came to the party to witness. They came for Fed Chair Powell’s post announcement press conference. And that’s where, once again, the Fed Chair fumbled the ball to some degree. We say the Fed Chair fumbled the ball again because the market grades the Fed Chair by either rising or falling post the press conference and once again, the market fell.
It’s a pretty infamous track record held by Powell and with respect to his treatment by the equity market for sure. Nonetheless, what, if anything did change in the Fed’s statement to the markets, financial and otherwise?
Information received since the Federal Open Market Committee met in January March indicates that the labor market remains strong but and that growth of economic activity has slowed from its rose at a solid rate in the fourth quarter. Payroll employment was little changed in February, but job. Job gains have been solid, on average, in recent months, and the unemployment rate has remained low. Recent indicators point to slower growth Growth of household spending and business fixed investment slowed in the first quarter. On a 12-month basis, overall inflation has declined, largely as a result of lower energy prices; and inflation for items other than food and energy remains near have declined and are running below 2 percent. On balance, market-based measures of inflation compensation have remained low in recent months, and survey-based measures of longer-term inflation expectations are little changed. Consistent with its statutory mandate, the Committee seeks to foster maximum employment and price stability. In support of these goals, the Committee decided to maintain the target range for the federal funds rate at 2-1/4 to 2-1/2 percent. The Committee continues to view sustained expansion of economic activity, strong labor market conditions, and inflation near the Committee’s symmetric 2 percent objective as the most likely outcomes. In light of global economic and financial developments and muted inflation pressures, the Committee will be patient as it determines what future adjustments to the target range for the federal funds rate may be appropriate to support these outcomes. In determining the timing and size of future adjustments to the target range for the federal funds rate, the Committee will assess realized and expected economic conditions relative to its maximum employment objective and its symmetric 2 percent inflation objective. This assessment will take into account a wide range of information, including measures of labor market conditions, indicators of inflation pressures and inflation expectations, and readings on financial and international developments. Voting for the FOMC monetary policy action were: Jerome H. Powell, Chairman Chair; John C. Williams, Vice Chairman Chair; Michelle W. Bowman; Lael Brainard; James Bullard; Richard H. Clarida; Charles L. Evans; Esther L. George; Randal K. Quarles; and Eric S. Rosengren. Implementation Note issued March 20, 2019 Implementation Note issued May 1, 2019
The Fed Chairman always has a difficult job of messaging policy, intentions and oversights of current economic conditions to the market. To the extent Powell has missed the mark on messaging in the past, the market still hasn’t made things any easier for the Chairman by pricing in a rate hike in 2019. The inflation picture is the main culprit for this market forecast/probability, which has remained under the Fed’s inflation target of 2% as measured by the PCE.
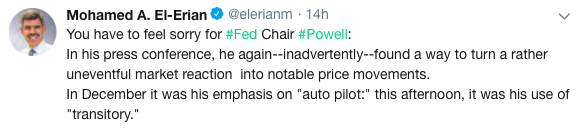
With respect to the Fed’s inflation target and mandate, the market took a turn for the worse on Wednesday and finished near the lows of the trading day after Powell commented on issues surrounding inflation. The use of the word “transitory” to characterize inflation components found investors dumbfounded to one degree or another.
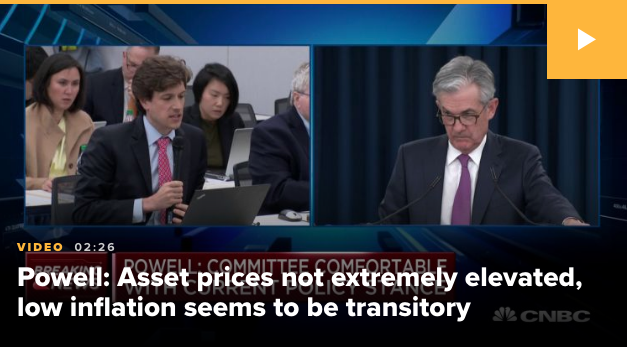
Traders have been speculating that recent weaker inflation readings would concern the Federal Reserve so much that it would cut interest rates later this year. Powell knocked that idea, by explaining that the central bank still sees the weakness as the result of “transitory” factors, such as portfolio management services, lower apparel prices and airfares.
“We suspect transitory factors may be at work. Inflation should return to the Fed’s target over time, and then be symmetric around its objective. If we did see inflation running persistently below, that is something the committee would be concerned about and something we would take into account when setting policy.”
Finom Group’s chief market strategist Seth Golden suggests the Fed understands the notion of inflation is fleeting; it’s fighting an uphill battle as every aspect of mass-market inflation is increasingly nonexistent and priced out of the market due in part to technological advances as well as frequent stock market downturns since the turn of the century (Great Financial Crisis).
“We can see the impossibility of inflation in all measures be it CPI, PPI or PCE data, even the latest ISM data. Surely we get these bouts of reflation here and there, but they always subside and return below the Fed’s target level. As such, the notion of symmetric inflation presiding over Fed policy seems implausible. For how long does the Fed’s gauge of inflation (PCE) need to stay at, above or just below 2% before it’s deemed actionable? Are all voting members on the same page so far as the duration of such levels prior to taking action? That seems really impractical. The Fed’s inflation mandate is akin to chasing after ghosts. I fear the real underlying problem for the FOMC under the leadership of anybody is that we’ve essentially reached a tipping point within the inflation paradigm and eventually the FOMC will not be able to ignore or offer a confounding message of symmetric inflation that seemingly has not any real practical efficacy. Simply put, the Fed knows they can’t stoke inflation or prevent deflation with the tools at-hand, but the market would never accept that phrasing or messaging.”
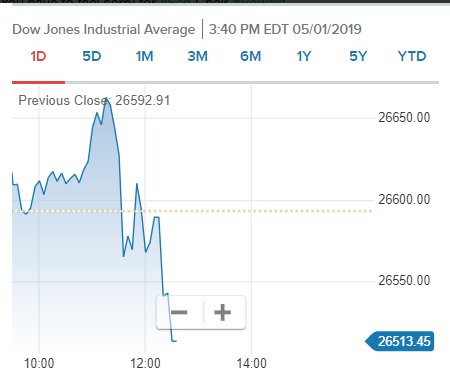
One thing is for sure, the Fed didn’t concede to the market’s desire for a rate cut and that sent the market reeling in the 3:00 p.m. hour. Here are some comments from notable market strategists and economist from the Fed Chair’s press conference.
Now of course beyond the FOMC highlights from Wednesday, the market was also confronted with a series of economic data points. It proved another mixed bag of data, but nothing at all recessionary or showing signs of accelerating economic growth. Much of the data confirmed what we’ve already come to understand; the economy is returning to slower, trend-growth.
Private-sector employers hired 275,000 people in April, payroll-processor ADP said Wednesday. That topped economists’ consensus surveyed by Econoday for 180,000 jobs added. It proved the strongest ADP report relative to expectations (275K vs. 180K) since February 2017 and 6th best going all the way back to 2006.
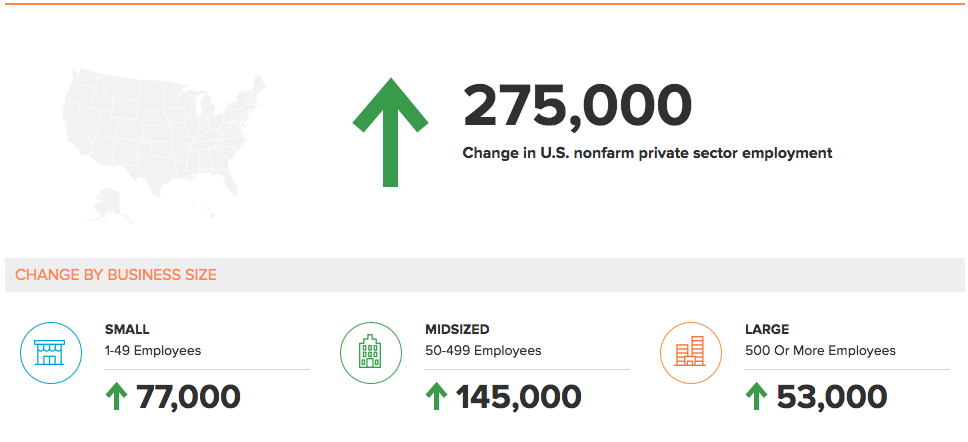
ADP’s increases in April were concentrated in the service sector: it accounted for 223,000 of the jobs added. In fact, only natural resources and mining, and information sectors lost jobs during the month. Small businesses added 77,000 jobs, medium-size companies added 145,000, and big business accounted for 53,000 of the job gains. ADP’s number for March, which was much lower than the Labor Department’s, was raised by 22,000 jobs.
While the ADP payroll report was a significant beat of economists’ expectations, the ISM manufacturing came in light than forecasts.
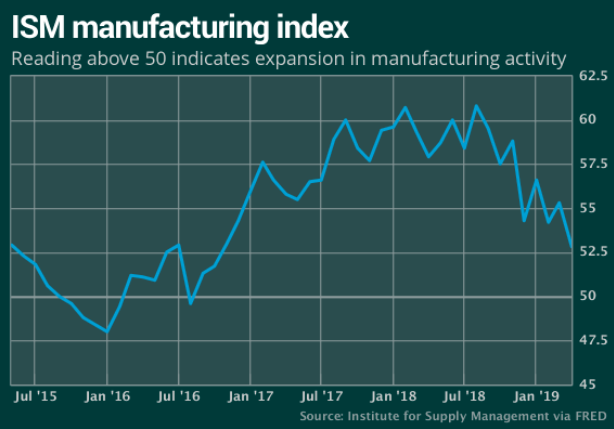
The Institute for Supply Management said its manufacturing index slipped to 52.8% last month from 55.3% in March. Economists surveyed by MarketWatch had forecast the index to total 54.7 percent. Below are the key bullet points from the latest ISM manufacturing data reported:
- The New Orders Index registered 51.7 percent, a decrease of 5.7 percentage points from the March reading of 57.4 percent.
- The Production Index registered 52.3 percent, a 3.5-percentage point decrease compared to the March reading of 55.8 percent.
- The Employment Index registered 52.4 percent, a decrease of 5.1 percentage points from the March reading of 57.5 percent.
- The Supplier Deliveries Index registered 54.6 percent, a 0.4-percentage point increase from the March reading of 54.2 percent.
- The Inventories Index registered 52.9 percent, an increase of 1.1 percentage points from the March reading of 51.8 percent.
- The Prices Index registered 50 percent, a 4.3-percentage point decrease from the March reading of 54.3 percent.
While the data did prove to slow across most major categories, we can’t help but to reflect on the following categories that signal a probable rebound in the coming months. Having said that, the somewhat up and down nature of the data series in 2019 is largely due to the affects of the U.S./China trade feud on business spending.
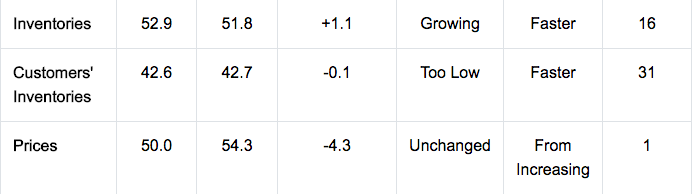
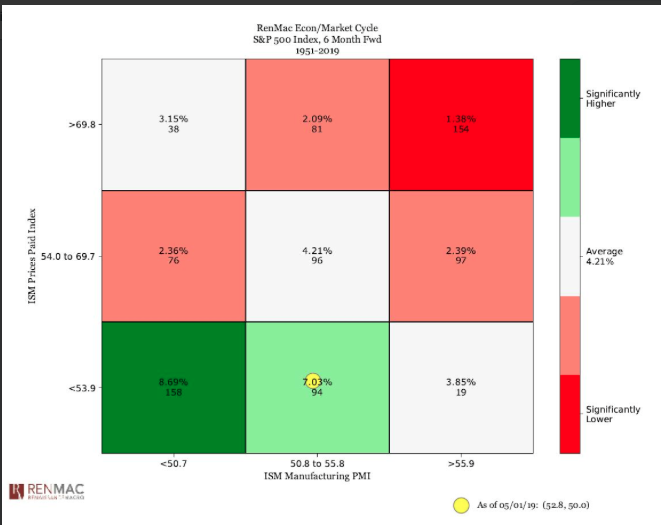
Inventories are still too low and prices paid falling, only further suggest the improbability of inflation but also lends itself well to the equity markets. Call it slower growth with no inflation. Historically, an ISM of 52.8 with the prices paid index at 50.0 is not necessarily a bad development for U.S. equities. We tend to see above average returns six months forward when the ISM is in this zone, as shown in the following chart from Renaissance Macro:
But what’s really the deal with the ISM manufacturing index? Is it altogether useful? Does it lend itself as a good measure of the economy or future economic activity? The only component of the index that makes it to the Leading Economic Indicators Index, after all, is the New Orders component. Furthermore, Doug Short of Advisors Perspectives has offered the following characterization of the ISM manufacturing index since 2012:
“I have been reluctant to put very much focus on this index for various reasons, but they are essentially captured in Briefing.com’s Big Picture comment on this economic indicator.
This [the ISM Manufacturing Index] is a highly overrated index. It is merely a survey of purchasing managers. It is a diffusion index, which means that it reflects the number of people saying conditions are better compared to the number saying conditions are worse. It does not weight for size of the firm, or for the degree of better/worse. It can therefore underestimate conditions if there is a great deal of strength in a few firms. The data have thus not been either a good forecasting tool or a good read on current conditions during this business cycle. It must be recognized that the index is not hard data of any kind, but simply a survey that provides broad indications of trends.
The chart below shows the Manufacturing Composite series, which stretches back to 1948. The eleven recessions during this time frame are indicated along with the index value the month before the recession starts.
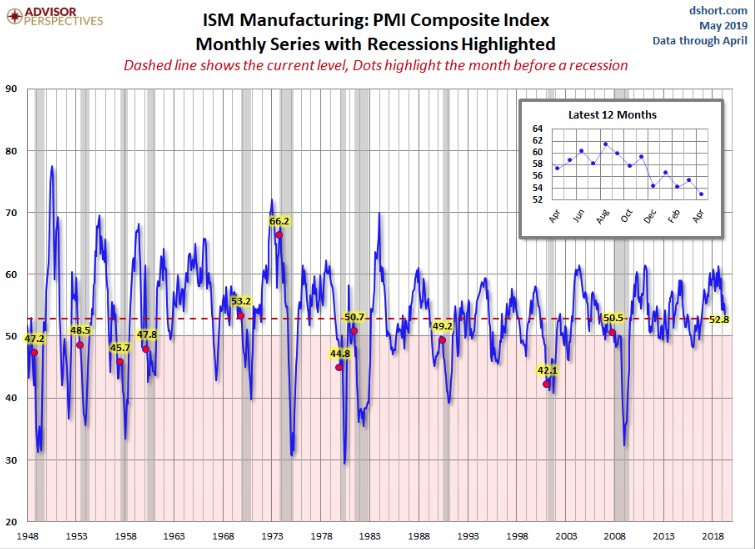
Most recessions have occurred with the ISM index already in contraction territory. Having expressed contraction levels in 2012 and 2016, this has not proven recessionary for the U.S. economy. What we can glean from Doug Shorts characterization as well as the charts is that current levels still express a relatively strong economy, but the index itself is more coincidental than a leading indicator of economic activity. The ISM index is compiled from a survey of executives who order raw materials and other supplies for their companies. The gauge tends to rise or fall in tandem with the health of the economy, coincidentally enough. Moreover, it’s important to keep in mind that the U.S. is a consumer and services driven economy, with manufacturing only accounting for roughly 12% of GDP.
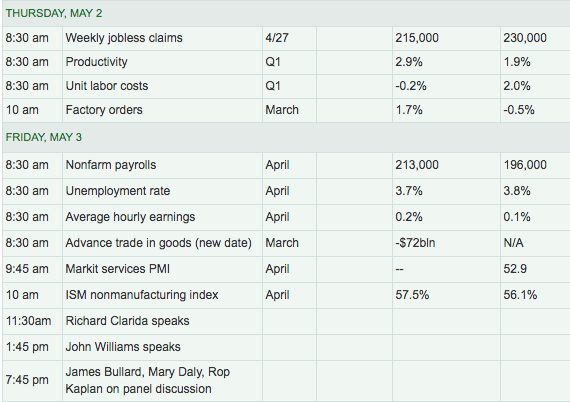
Rounding out the weekly economic data will find Initial Jobless Claims rolling out Thursday and only to be complimented by Friday’s release of the April Nonfarm Payroll report.
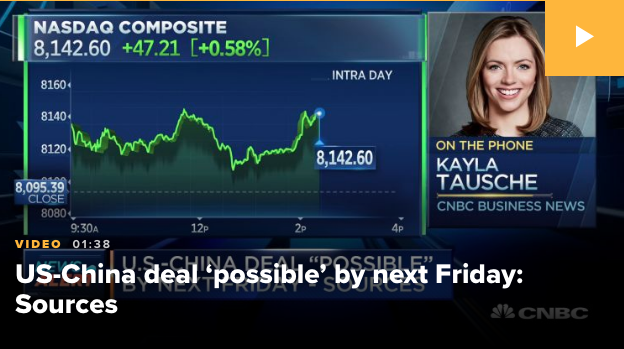
Setting up market participants for the coming week, word out of the White House is that a U.S./China trade deal may come as early as next Friday. A U.S. delegation met with Chinese negotiators in Beijing on Wednesday as the world’s two largest economies try to hammer out details of an agreement. Chinese Vice Premier Liu He will travel to Washington for talks next week.
On Wednesday, the White House said the latest talks moved Washington and Beijing closer to an agreement. In a statement, White House press secretary Sarah Huckabee Sanders said, “Discussions remain focused toward making substantial progress on important structural issues and rebalancing the US-China trade relationship.”
Reports have suggested the Trump administration could yield on some provisions as part of the deal. In a final agreement, the U.S. could immediately remove a 10% duty on part of the $200 billion in Chinese goods on which it levied tariffs, Politico reported Wednesday.
Washington would keep a 25% tariff on $50 billion in goods until after the November 2020 election, according to the news outlet.
With the market’s performance on Wednesday, opening higher and reversing lower and through the closing bell, stabilization is proving out in the premarket Futures on Thursday and ahead of key economic data. However, the outside reversal from a daily HIGH that was also a new all-time high, and the CLOSE being below the previous 6 days’ CLOSE invites a new study from Troy Bombardi.
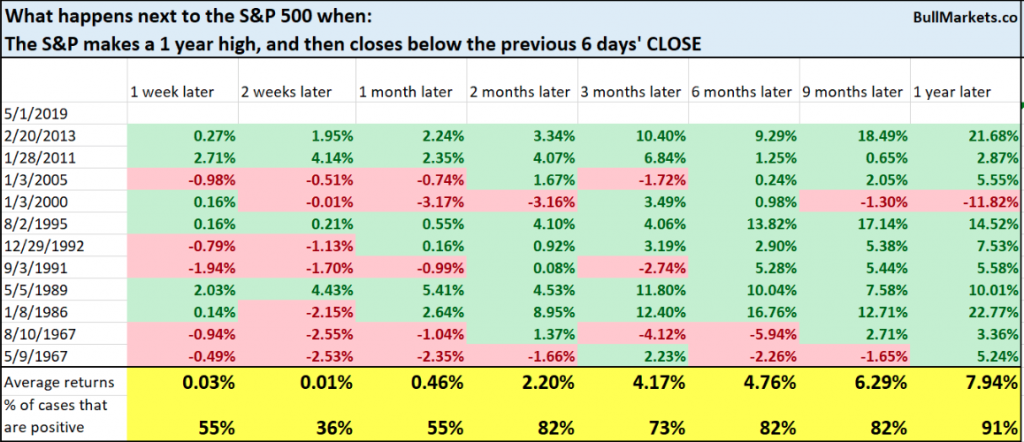
As shown in the table above, such an occurrence is typically bearish for the market two weeks later. We’ll see if that holds true again or proves just as wrong as avoiding exposure to the 2019 market rebound. Nonetheless, we wouldn’t argue against a 3-5% pullback in the major indices. In many respects this would align with the natural order of the market to express symmetry, revisiting key support levels before moving higher. Either way, Finom Group will trade what the market delivers.
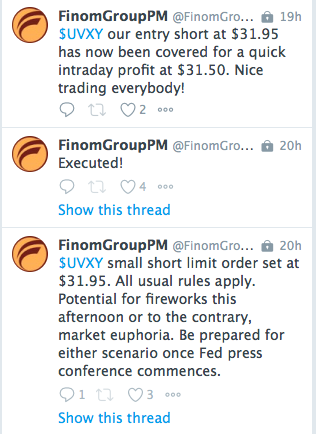
Yesterday’s trades of the day were found benefitting from bouts of volatility and the early day rise in shares of Amazon.com (AMZN).
Something tells us there will be more bouts of market volatility to come during the late spring and summer months. While the “sell in May and go away” mantra will heighten as the month carries on, we reflect on the historical data surrounding this colloquialism that describes the May-October period.
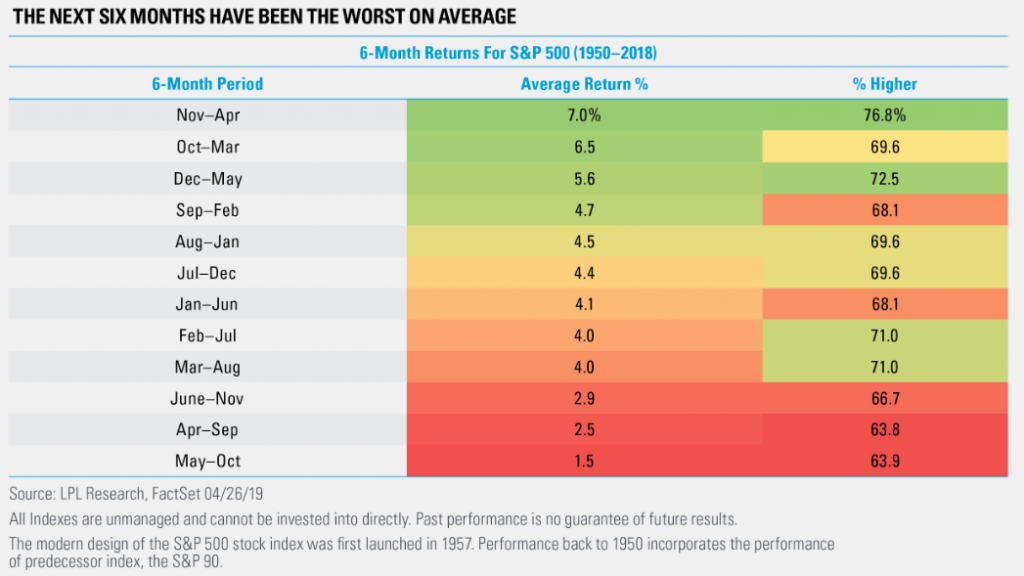
As shown in the table above from LPL Financial, the worst 6-month period for stocks is the May-October period. The 6-month period for stock returns is higher more than 60% of the time, but the rate of return is the least of all time frames considered.
The S&P 500 has bucked the seasonal trend recently, but we think a decisive midyear rally could be more difficult to come by this year. With the S&P 500 higher each of the first four months of 2019 and up more than 17.5% for the year (as of April 30), we think a consolidation or pullback could be warranted.


