
The economic data continues to slant more positively for most aspects of the economy, shy of manufacturing. While the Chicago PMI data proved to weaken in March, it is a much smaller regional component of the U.S. economic engine that is likely to improve as inventories roll off in the coming weeks and months. With manufacturing continue to struggle globally; U.S. consumer spending has been supported with improved consumer sentiment.
The consumer confidence index rose to 129.2 from 124.2, the Conference Board said Tuesday, beating economists’ expectations handily.
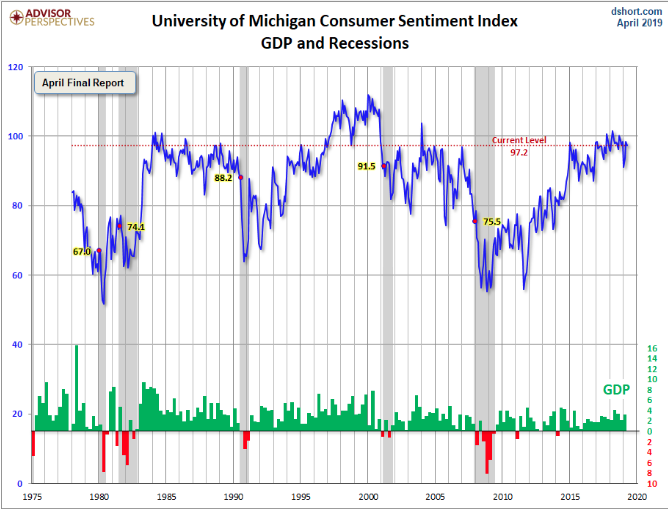
“Consumer Confidence partially rebounded in April, following March’s decline, but still remains below levels seen last Fall,” said Lynn Franco, Senior Director of Economic Indicators at The Conference Board. “The Present Situation Index, which had decreased sharply last month, improved in April, as did consumers’ short-term outlook. Overall, consumers expect the economy to continue growing at a solid pace into the summer months. These strong confidence levels should continue to support consumer spending in the near-term.”
The present situation index rose to 168.3 from 163. The board’s survey of future expectations moved up to 103 from 98.3. Both are close to the highest levels in a decade.
On top of strong consumer sentiment came another boost from economic data in the form of Pending Home sales. Recall that New Home sales in March also grew to an 11-year high. The comparisons in the housing sector will get easier as the year carries forward, but much of what we see in the housing sector mirrors conditions from 2014. Nonetheless, the Pending Home Sales Index, a forward-looking indicator based on contract signings, increased 3.8% to 105.8 in March, up from 101.9 in February.
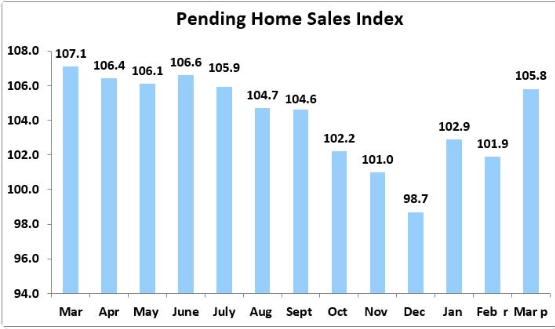
Year-over-year contract signings declined 1.2%, making this the 15th straight month of annual decreases.
The economic data and event calendar is loaded today and will get kicked off with the ADP employment report at 8:15 a.m. EST and finalize this afternoon with the FOMC rate announcement and press conference. ISM manufacturing data will fill in the timeline and is likely to prove a market mover ahead of the FOMC event this afternoon.
The market action continues to one characterized as it has been since 2016, with investors consistently “buying the dip”. While many claimed this to have been eliminated in Q4 2018, that simply proved to be a sentiment captured in the moment and lacking a fundamental perspective. While the key buyer of the market, corporates, emerge from the dreaded “blackout period” buybacks have proven to increase YoY and have buffered equities from larger pullbacks.
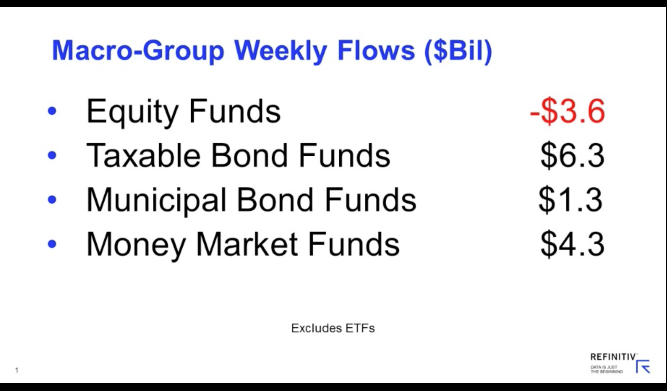
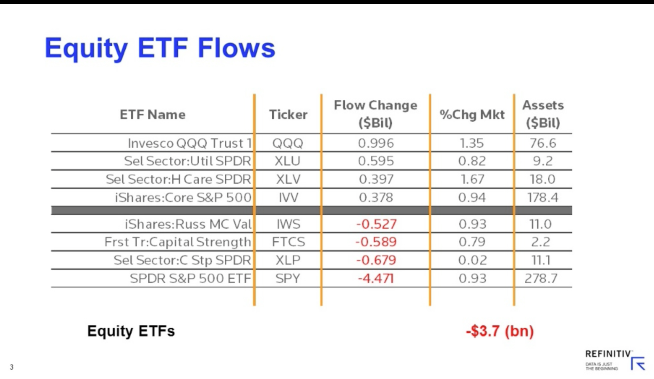
In terms of fund flows and market positioning/exposure, we continue to see relatively light exposure levels coupled with negative fund flows. Lipper’s fund asset groups (including both mutual funds and ETFs) experienced net inflows of $4.9 billion for the fund-flows trading week ended Wednesday, April 24. Taxable bond funds (+$6.4 billion) and municipal debt funds (+$1.6 billion) took in almost $8.0 billion combined for the week, while money market funds contributed $4.3 billion to the total positive flows. Equity funds (-$7.3 billion) were the only asset group to suffer net outflows for the week.
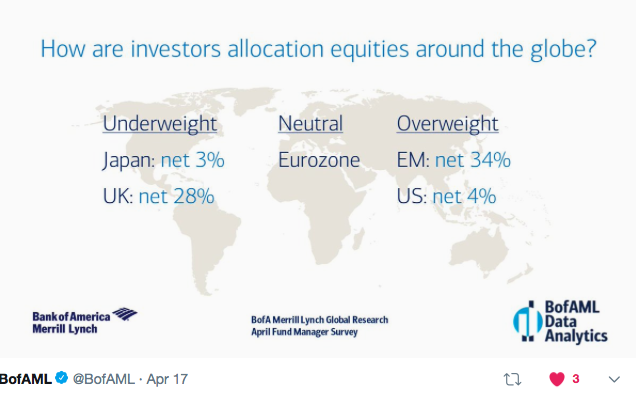
In addition to the Lipper Weekly Fund Flows, the latest BofAML global fund manager survey finds light, but improving global equity exposure.
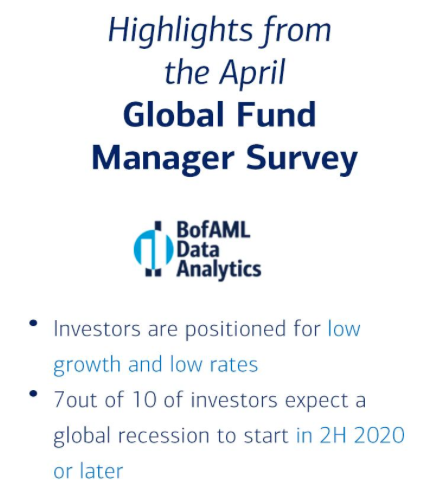
Investors’ allocation to global equities jumped 14ppt to net 17% overweight; EM is the most favored region, while the UK remains the least according to the BofAML survey.
In terms of equity exposures, it is painfully clear that most investors have missed the 2019 market rally. This is also likely lending itself to some of the Neutral sentiment amongst the investor community. Had they positioned for the rally, investors would likely have benefited and sentiment would also have likely improved from Bearish to more Bullish. But when the boat has left the port without you…
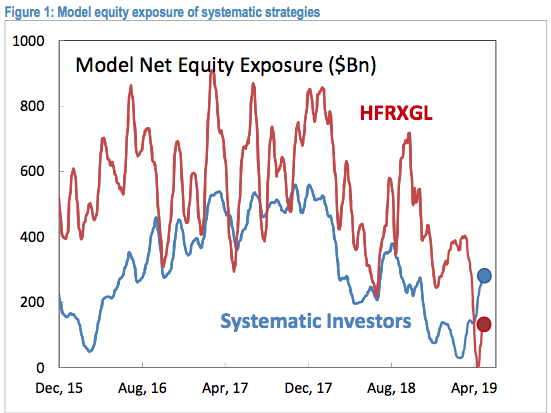
J. P. Morgan’s quant team outlines market exposure in their recent notes that identifies low levels of market participation and the sentiment shared amongst investors whom had “missed the boat”.
After Christmas day, the market rally was started with pension rebalances, and continued with short covering by speculative investors (see here). With the decline in realized volatility, systematic investors started re-leveraging, i.e. buying back equity exposure that was sold to the lowest point during the Q4. We estimated this systematic buying was roughly ~$250bn, and if volatility stays low these programs and platforms could add another ~$250bn before reaching maximum exposure. During Q1, corporates bought back a similar amount (~$220bn) and this ensured a smooth rally (64% up days vs. historical average of 52%). We have also witnessed a return of the ‘buy the dip’ market pattern, which is the result of inflows and intraday derivative hedging of nearly record long gamma positions.
What has been remarkable for this rally is that discretionary investors did not meaningfully increase their net equity exposure, and retail investors net reduced their equity exposure. In other words, while ‘machines’ and corporates added exposure, ‘humans’ didn’t. This is somewhat understandable and is likely a behavioral reaction to the extreme market volatility and deafening negative coverage in Q4. Given that systematic investors’ exposure is below historical median levels (e.g. CTAs and Volatility Targeting are both slightly above their 40th percentile, Figure 1), and that buybacks should continue this year with the same intensity (note we are just getting out of blackout windows), it is likely that the market will continue grinding higher. When talking to clients, we don’t find many truly convinced bears at this point, but rather investors who would like to add at ~5-10% lower levels and capture a return to new all-time highs. This means that (all else equal) any potential pullback is likely to be shallow.
As missing the rally and buying at all-time highs is frustrating for most investors, we have proposed various relative value trades that can capture upside.
With the Fed and Apple Inc. earnings beat serving as the backdrop for markets Wednesday, it’s hard to overshadow the S&P 500 rally of roughly 17% year-to-date. The market certainly won’t go in one direction for the entirety of the year and with that in mind seasonality may come into play. While the “sell in May and go away” colloquialism for the market hasn’t panned out on average over the last 20 years, June has typically been a poor month for equities. Having said that, this time, like every other time might prove different for either May or June… maybe both!
Moreover, while the market has typically been higher in May, the colloquialism really covers the May-October period.
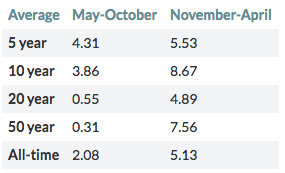
Stocks over the six-month span ending in October have posted comparatively weaker returns in only three of the past five years, with 2017 showing a more than 8% gain, compared with only a 2.8% gain from November of 2017 to end of April of 2018, according to Dow Jones Market Data. And Sophie Huynh, strategist at Société Générale, said that unloading stocks over the coming six months could prove costly for investors.
“It’s not going to work this year.”
The SocGen strategist bases her expectations partly on the belief that much of the bad news, including downgrades to earnings, that would ordinarily weigh on markets from May to the end of October have already been factored by investors.
“As I said, the reason why it won’t work is really because EPS
Growth expectations have been massively revised down. So 2019 EPS growth went from 10% in September 2018, to 3.2% currently, in tandem with the U.S. economic surprise indicator.”
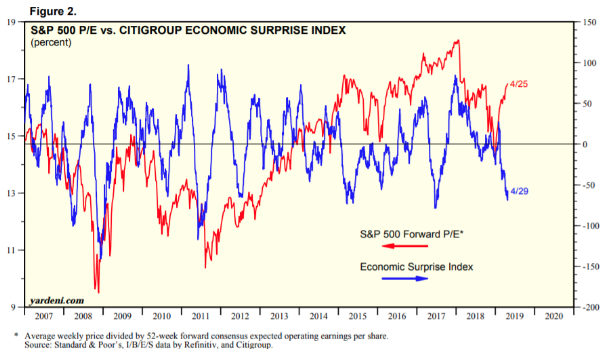
“A lot of bad news is already reflected in expectations, while China’s ongoing monetary and fiscal support and central banks’ ‘Great Retreat’ should put a floor under risky assets for now,” Huynh said, underscoring points she made in a Tuesday research note titled, “Why ‘Sell in May and go away’ won’t work this year.”
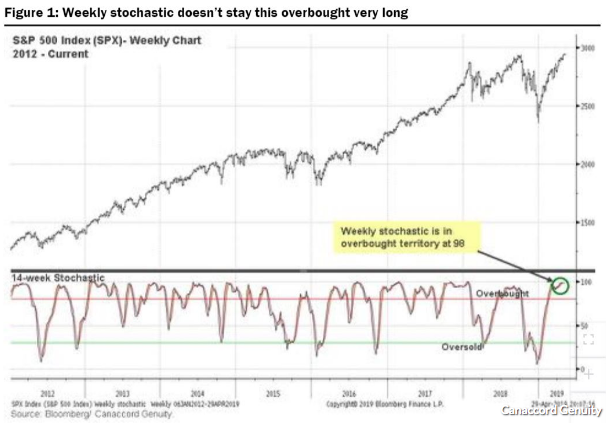
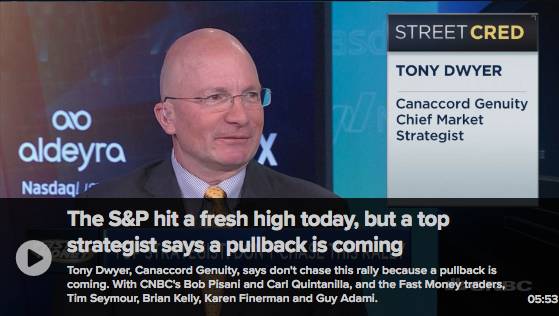
Active market participants follow a different path to achieve the year-end result when compared to passive market participants. As such, active portfolio managers are likely preparing for some form of a market pullback, which Canaccord Genuity’s Tony Dwyer suggests is the prudent action. Dwyer is of the opinion a pullback of roughly 5% may be in the cards for investors near-term.
Dwyer based his call for a pullback on what he describes as “near extreme overbought/optimism levels” within the S&P 500, as the evidenced by the 14-week stochastic indicator, which measures the weekly price of the S&P relative to its highs and lows over the past 14 weeks. The gauge is used to help time turns in the market.
Finally, Dwyer argued that in the current earnings season, wherein 77% of the S&P 500 have beaten earnings estimates, while revenue growth is on pace to a “respectable 5%”, the fear of an earnings recession has evaporated, helping power the index’s 3.6% climb in April. “That leaves us with less skepticism ahead of a plethora of economic data that is likely to show further slowing.”
Finom Group would concur with Dwyer’s assessment of breadth and overbought conditions and suggests a near-term market pullback would be healthy and reset market conditions to some degree. Additionally, we would expect such a pullback to be bought on the improved FY19 EPS sentiment coupled with improving macro conditions. Dwyer is of the same opinion and discusses his sentiment with great detail on CNBC’s Fast Money Tuesday evening.
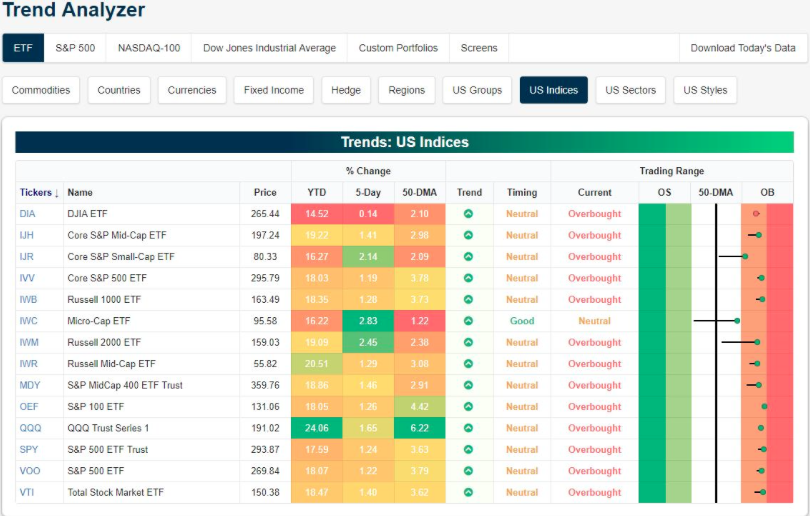
Having said all of that regarding the potential for a near-term market pullback probability, that has been the case over the last couple of months. And over the last couple of months the largest YTD pullback has been 2.5%, the week the 3-month-10-year Treasury yield inverted. As such, we can easily recognize overbought conditions, but it proves difficult to time a market pullback, especially with the proliferation of corporate buybacks, light equity market exposures and a rebounding macroeconomic picturing occurring in unison. Nonetheless, here is a look at the index ETF conditional trend from Bespoke Investment Group as of Tuesday.
In addition to overbought conditions, the rally has been relentless in its trend higher week-after-week. In a sign of low volatility, the S&P 500 has now gone 71 consecutive days without falling below its 50-DMA, as shown in the chart below.
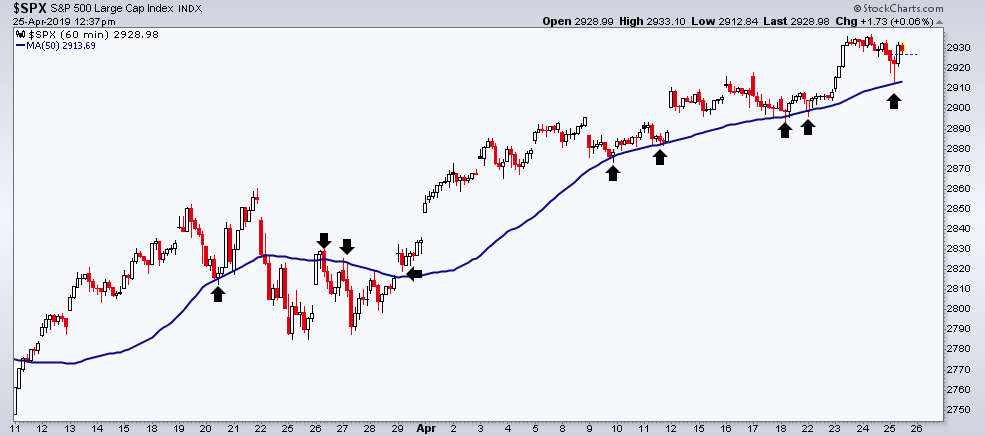
What we can also discern from the chart above is the consistency for which the S&P 500 bounces off the 50-DMA. Something else to consider in terms of potentially timing a market pullback is offered in the latest newsletter form Thrasher Analytics. The following chart is that of the growing positive correlation between equities/SPX and volatility/VIX.
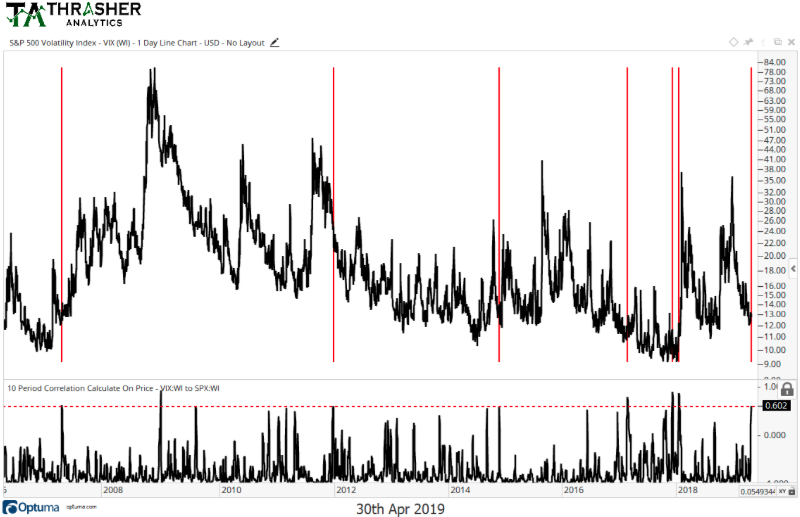
According to the chart, since 1998, the VIX has only been under 25 correlation to the S&P 500 six previous times and before the correlation has ultimately reversed to a higher level, indicating a spike in volatility that coincides with an equity market pullback. But, but…we can also review the relation between the VIX and S&P 500 as follows and to determine probable market moves going forward.
Recently, the S&P 500 and VIX have been trending in the same direction. There is usually an inverse correlation between the two indexes, which tends to draw out concern when it has deviated, as many market participants believe this to be a sign of a near-term market pullback. It rarely proves meaningful, but even so, the correlation is presently front of mind given the relentless market rally and with respect to the week’s events and data forthcoming. To better understand the VIX and the S&P’s recent correlation, we can look at their 10-day correlation, which is currently at +0.63.
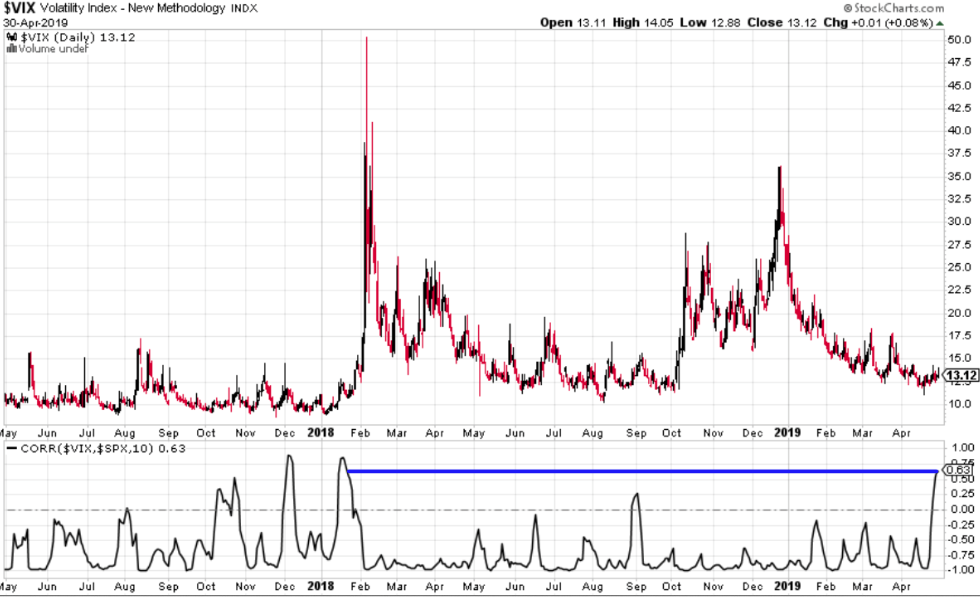
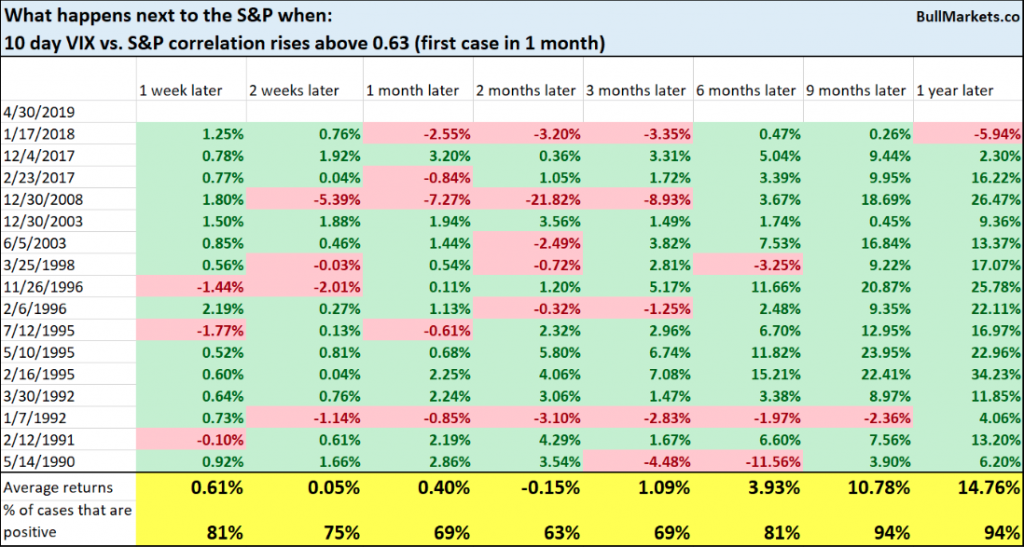
As we can see from the chart, the last time this happened was January 2018, when volatility soared and the stock market fell some 20 percent. According to a recent study from Troy Bombardia, from 1990 – present, here’s every case in which the 10-day VIX vs. S&P correlation was above 0.63 and how the S&P 500 performed.
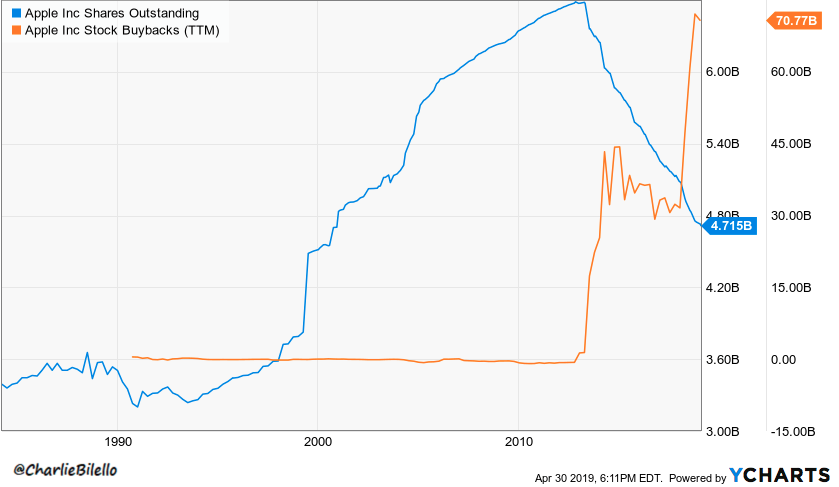
We certainly can’t consider this narrative complete without touching on Apple’s latest quarterly results, which included the announcement of another $75bn in share repurchases. Apple has bought back 1.9 billion shares in the past 6 years, bringing shares outstanding down to their lowest level since 2000.
Here’s how the company did compared to what Wall Street expected:
- EPS: $2.46 vs. $2.36 forecast by Refinitiv consensus estimates
- Revenue: $58.02 billion vs. $57.37 billion forecast by Refinitiv consensus estimates
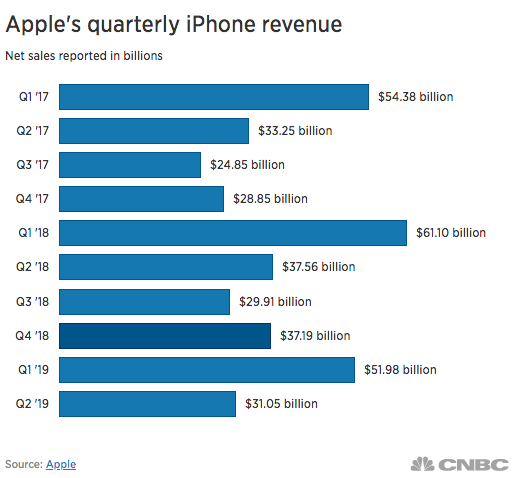
- Q2 iPhone revenue: $31.05 billion vs. $31.10 billion expected forecast by FactSet consensus estimates
- Q2 services revenue: $11.45 billion vs. $11.37 billion forecast by FactSet consensus estimates
- Projected Q3 revenue: $52.5 to $54.5 billion vs. $51.94 billion forecast by Refinitiv consensus estimates
- Apple’s total sales were down 5% from the same period last year, although it doesn’t seem to matter to investors as the stock is up.
- Guidance for Apple’s fiscal third quarter was higher than expected, suggesting Apple’s iPhone demand machine is stabilizing again and that services revenue continues to grow. In January, Apple cut its first-quarter forecast, blaming slow iPhone sales in China.
- iPhone revenue was also down 17.33% year-over-year. iPhone revenue accounted for 53.5% of Apple’s revenue for the quarter, which is lower than it has historically been.
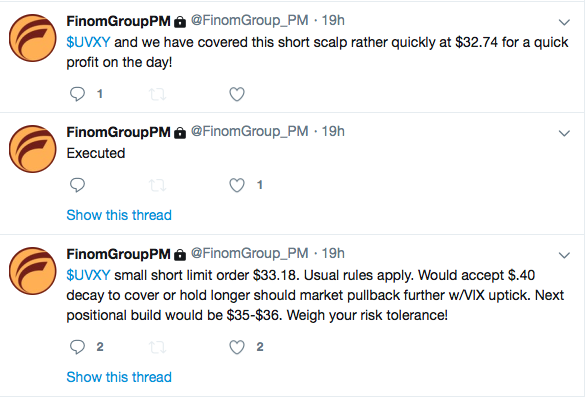
In closing out this morning’s daily market dispatch, Finom Group continues to trade what the market delivers, even if it is not delivering much volatility. Yesterday’s trade of the day, once again, resounded within the volatility complex of VIX-ETPs and is presented in the screenshot below. Our daily/weekly trade alerts have an above 95% hit rate year-to-date.
With the majority of the mega-cap tech heavyweights now having reported, earnings season is proving far better than earlier estimates. In fact…
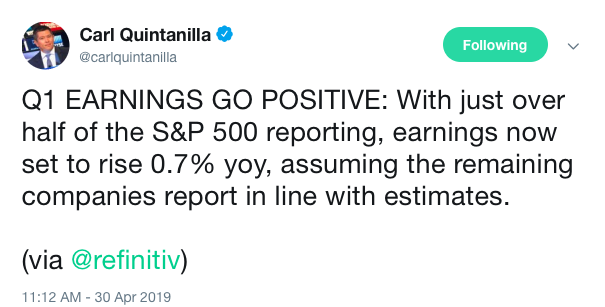
So what was all the panic around Q4 2018 about anyway? Without stirring the bears, I think it’s safe to say the market reacted against the Fed’s poor messaging and unwarranted tightening of financial conditions, given the absence of inflation. What happens next? We’ll certainly have a clearer picture of that come 2:00 p.m. EST today.


