
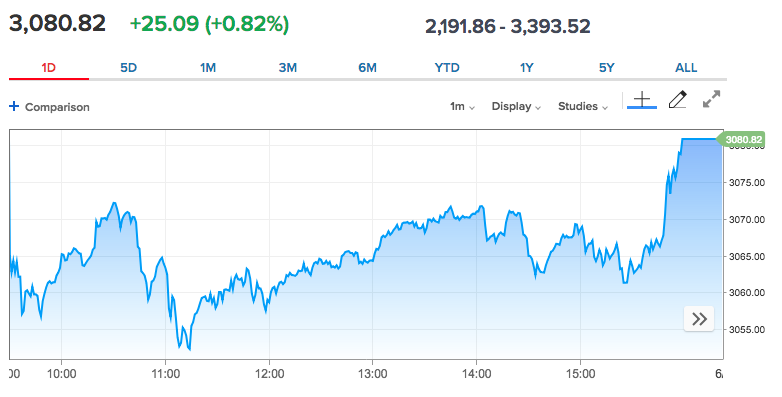
As daily protests/marches/demonstrations continue, the equity markets also continue to trend higher. On Tuesday, the S&P 500 (SPX) added to it’s record setting bounce off of the March 23r lows by tacking on another 25 points. A quick look at the 1-day chart of the benchmark index below identifies a massive surge in volume and price going into the final 10 minutes of trading.
Tuesday’s final-10, as it were, produced a Market On Close order of nearly $3.5bn of securities to buy. It was another “I don’t care just get me in the market” rush of flows that we had seen during the month of May as well. This in not something you typically see in a bear market and yet another sign that despite the record setting labor/employment and retail sales data, investors are clearly focused on the recovery into the back half of the year and 2021.
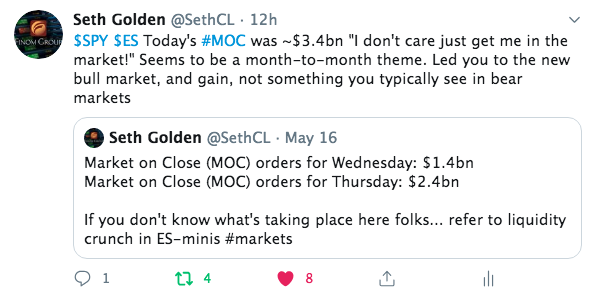
As shown in the tweet above, during the month of May we had seen similar flows into the equity market on two consecutive days. Will the same happen here in June and with ongoing protests and demonstrations. Many investors are befuddled as to how the market can continue to rise in the face of such alarming headlines and the coverage of the civil unrest. As we’ve said in the past, “the market and the economy are not always in lock step with one another”. An almost perfect example of this would prove to have taken place in 1968 and with wide scale protests and demonstration over the assassination of Dr. Martin Luther King Jr. In addition to this historic moment in U.S. history, the H3N2 influenza pandemic killed over 100,000 people in the U.S. and millions more around the world. In 1968, the S&P 500 fell 9% from January to March, rallied 24% off of the bottom, and finished the year with a total return of 10.8 percent. But is 1968 really a good comparison just because it proved a highly charged year, filled with political and civil rights protests?
One important thing to note is that while U.S. GDP declined 4.8% in the first quarter of 2020 and is expected to continue falling in the second quarter, it increased by 4.8% in 1968. That’s a pretty big difference. In order for 2020 to see an overall increase in GDP, the U.S. would have to do more than simply make up losses in the second half of the year.
Another important difference between then and now is that, compared to running a trade surplus in 1968, the U.S. is running a trade deficit in 2020.


One effect of this is that the U.S. economy has become increasingly dependent on foreign economic conditions, making the earnings of companies and citizens alike more difficult to estimate without taking the global economy and foreign relations into consideration.
Additionally, the U.S. economy is more overvalued in 2020 than it was in 1968 according to the Buffett Indicator, which measures market valuation by comparing total market cap to GDP. As of June 2, the indicator shows that the stock market is significantly overvalued, with total market cap measuring 145% of GDP.
Do any of the differences noted above really matter when the financial system is being heavily influenced by central banks though, which was not the case in 1968? And what about the rise of index and ETF investing that didn’t exist then either? There’s really no apples-to-apples comparison I’m afraid to say, despite some similarities presented.
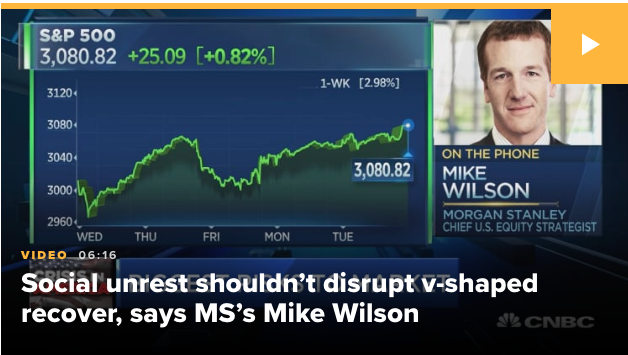
Equity futures continue to march higher on Wednesday, even as demonstrations turned violent once again Tuesday night. Morgan Stanley’s chief equity strategist Mike Wilson remains of the opinion that the protests will not deter a V-shaped recovery.
Moreover, Steven DeSanctis, Jefferies equity strategist offers a similar sentiment relating market optimism with central bank liquidity provisions.
“The market is a forward looking mechanism. They see six months from now, nine months from now there will be more semblance of order. The economy will be coming back, and earnings will be coming back. Estimates have stopped going down. You have the full support of the Fed … the flows into credit markets have been incredible. The capital markets are open. IPOs and secondary offerings are getting done.
All of that outweighs what’s going on. The big thing with social unrest is in two weeks from now, if we get an uptick int the virus and that delays openings, that is something that impacts markets.”
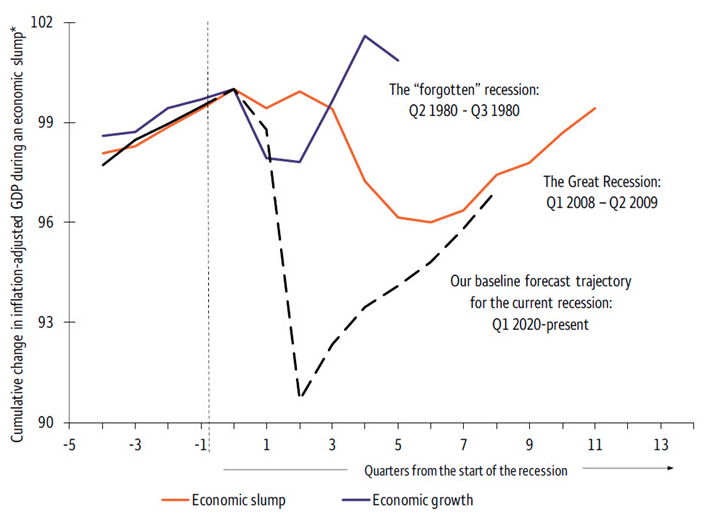
While everyone is focused on the riots and we very different circumstances between 1968 and 2020, something may have gotten lost in the conversation and amongst the widely considered analogues and perspectives on those analogous years. The very immediate and sharp recession of 2020 actually looks a lot like the easily forgotten and hardly ever mentioned 1980 recession. Higher banking industry reserve requirements and interest-rate increases by the Fed drove the prime lending rate to 20% by early April 1980 and the economy into a recession early that year. However, the big blow came from credit controls in March, sending second-quarter economic activity to its third worst decline in the post-World War II era, an annualized 8% fall, followed by more modest slippage in the July-September period.
- The impact of credit controls likely was exaggerated by confusion over their implementation, raising the same questions about credit availability that encouraged consumers to hoard cash and aggravated the deep economic slump in 2008.
- Severe economic weakness left few anticipating a quick economic rebound in 1980, prompting planned sales promotions by retailers that were bracing for a dismal Christmas shopping season that year.
Nonetheless and despite the fears, the U.S. economy came roaring back with nearly 8% growth between September 1980 and March 1981 on a recession-related decline in interest rates and an end to credit controls in July 1980. Again, a perfect example of markets dictating policy. The recession’s brevity, at six months, proved the shortest U.S. recession in the postwar period, and its proximity to the long, deep economic slump between July 1981 and November 1982 help to explain the general inattention to the 1980 cycle.
With all that being said, a pandemic comes with a very different set of variables than does a Fed-induced recession from credit controls and exploding interest rates. An uncertain timeline for a vaccine, immunotherapy, or even adequate testing risks deteriorating household confidence and spending as the U.S. economy is reopened. Greater disruption to business revenue risks more sizable bankruptcies and layoffs that could impede future economic growth as well. More than likely, the economy will rebound more akin to the 2009-2012 period than 1980-1981 in my opinion. Either way, the market and the economy can remain on the same improving path, but traveling at different speeds.
On Wednesday, investors await the latest economic data headline from the labor and employment market via ADP private sector payrolls. The U.S. economic data comes on the heels of China’s latest services PMI data released overnight.
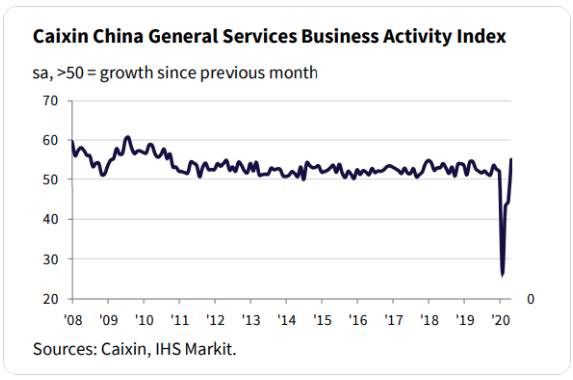
A private gauge of China’s service sector activity rebounded sharply to a nearly ten-year high in May as domestic demand recovered amid government measures to buoy economic growth. The Caixin China services purchasing managers index rose to 55.0 in May from 44.4 in April, Caixin Media Co. and research firm Markit said Wednesday. The reading stood above the 50 mark that separates expansion from contraction, after it plunged below 50 for three straight months due to the coronavirus pandemic.
The rebound was the steepest since October 2010, as service-providers said an easing of restrictions imposed to control Covid-19 had driven a renewed expansion of activity. Total new orders saw the sharpest increase since September 2010 thanks to recovering domestic demand, Caixin said. New export orders continued to fall sharply in May.
U.S investors will also bear witness to the latest ISM nonmanufacturing index reading at 10:00 a.m. EST today. Earlier this week, the ISM manufacturing index did show a bounce off 11-year lows.
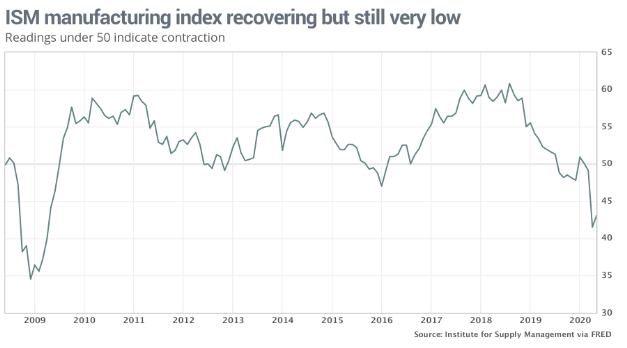
The Institute for Supply Management said its manufacturing index climbed to 43.1% last month from a low of 41.5% in April, suggesting the worst of the economic damage from the pandemic might be over. As the economy struggles to reopen in the face of protests and lingering fears of a second large spread of the coronavirus, the economic data will prove more and more important than in the previous month.
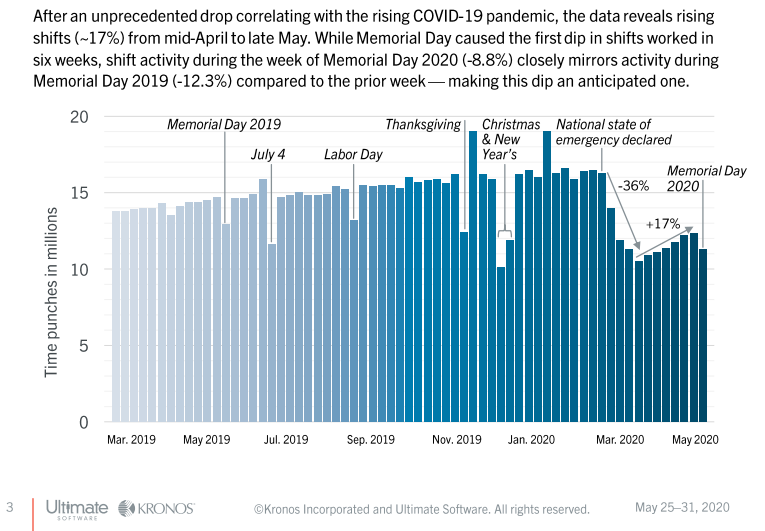
The latest weekly data from the Kronos U.S. Workforce Activity tracker shows steady improvement from time punches. It’s important to note that in the data depicted below, the slight downturn on a WoW basis was due to the Memorial Day holiday. Even so, it proved less of a downtick than in 2019.
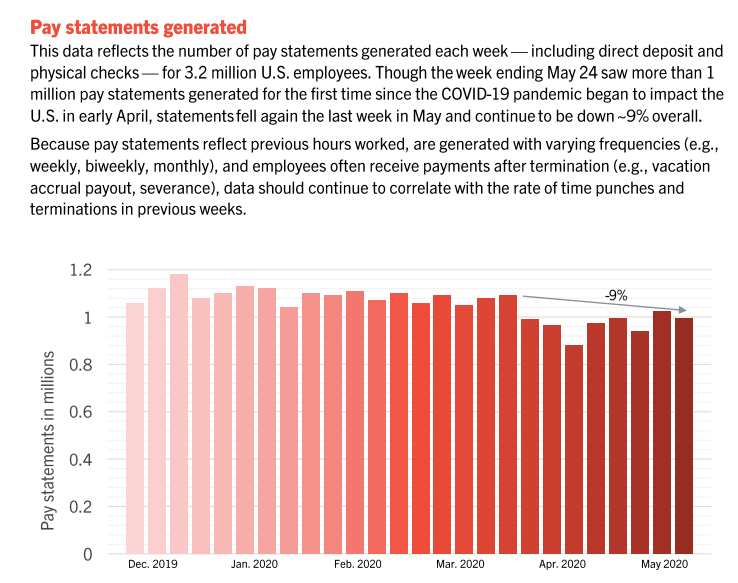
Along with punches on the rise through May, we see payment statements have also risen and only found impacted slightly by the Memorial Day holiday this past week. We’ll continue to monitor the trends in the Kronos weekly Workforce Activity tracker and expect a marked improvement in next week’s release, due largely to the drop-off from the Holiday in the week ago period.
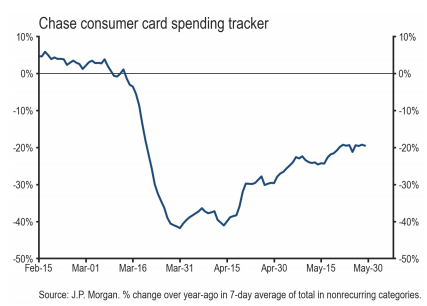
In terms of the consumer, as the labor market slowly troughs and rebounds, fiscal relief aims to bridge the gap in the household budget. When reviewing some of the more real-time consumer spending data, we can see a slow recovery already taking shape, even if not at an even pace. The following data is from the J.P. Morgan daily consumer spending tracker report:
- On May 29, our tracker of Chase consumer card spending fell from -19.3% to -19.5%.
- The tracker fell -0.2%-pt over the prior week, and it is 22.3%-pt above its low of -41.8% on March 31.
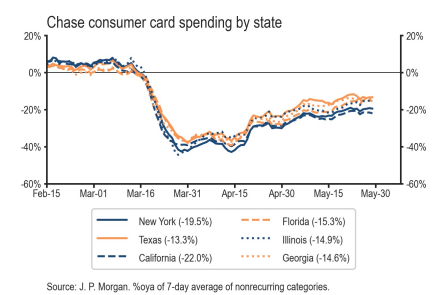
As noted in the last chart regarding consumer card spending by state, New York has a lot of catching up to do with its peers. Until New York full reopens, total U.S. GDP is likely to show a more moderate economic recovery… and why?
When it comes to understanding the size and scope of the $18 trillion U.S. economy, it’s sometimes easier to consider that it’s the sum of many parts. Many states already have economies that are comparable to some of the world’s largest countries, giving you a sense of what they might be combined. Below is a chart of the biggest state contributions to U.S. GDP as of 2019.
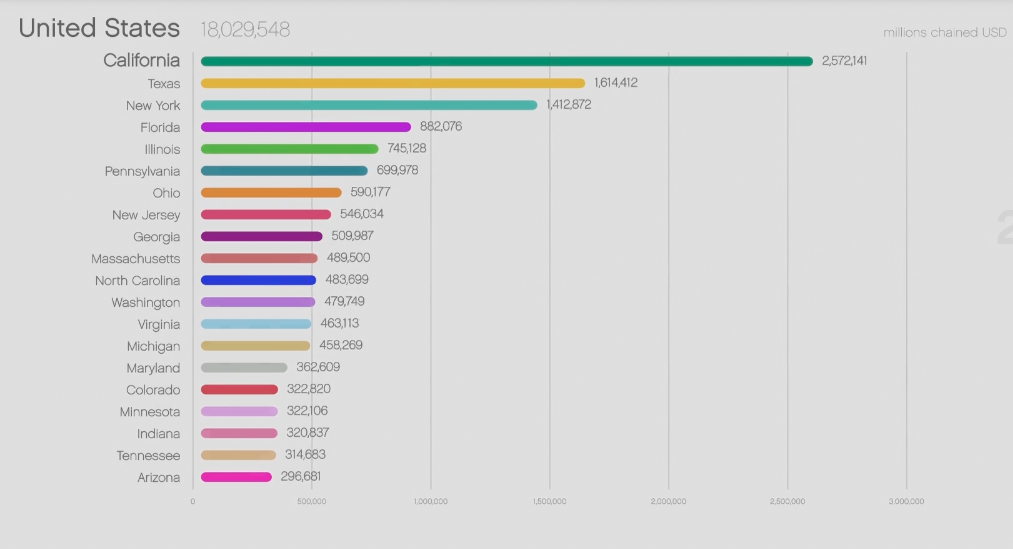
What’s interesting about the chart above is the path that Florida has taken up the chart in relevance and since the 1960s. It was around this time, that America began the great southern migration, which continues to the day. We would actually anticipate further migration over the next 10 years that would result in a reduction in New York’s contribution to total U.S. GDP and positively inflect Florida’s contribution to total GDP. There’s a good reason that they say as the southeast goes, so goes retail sales after all. In speaking of retail sales…
We’re still a couple weeks out from the release of the May monthly retail sales data, but Shoppertrak data suggests foot traffic is also slowly recovering, as we would anticipate.
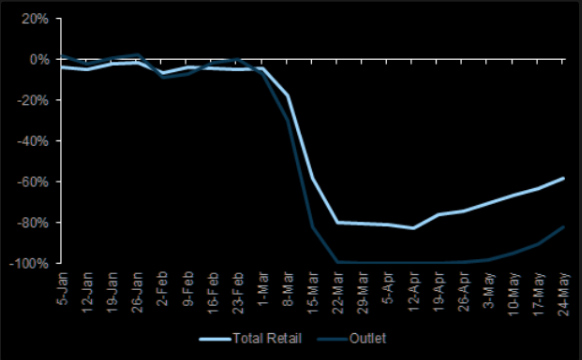
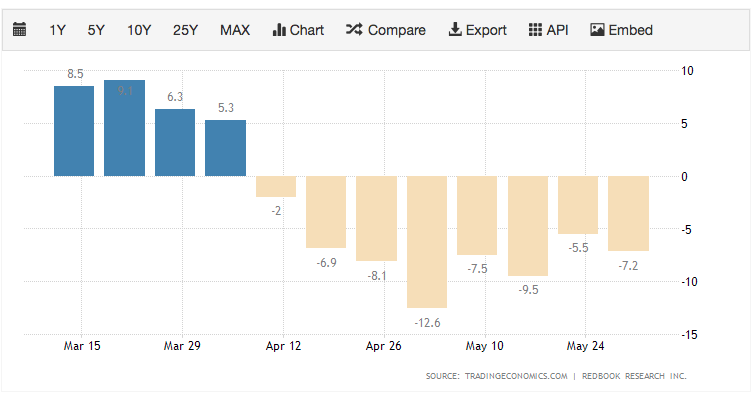
Until the Census Bureau’s release of May retail sales, we’ll be tracking the Wow Redbook retail sales. The Johnson Redbook Index measures the growth in the U.S. retail sales. The index is based on the sales data of around 9,000 large general merchandise retailers representing over 80% of the equivalent ‘official’ retail sales series collected and published by the U.S. Department of Commerce. As we can see from the latest weekly data, retail sales took a step back in the previous week.
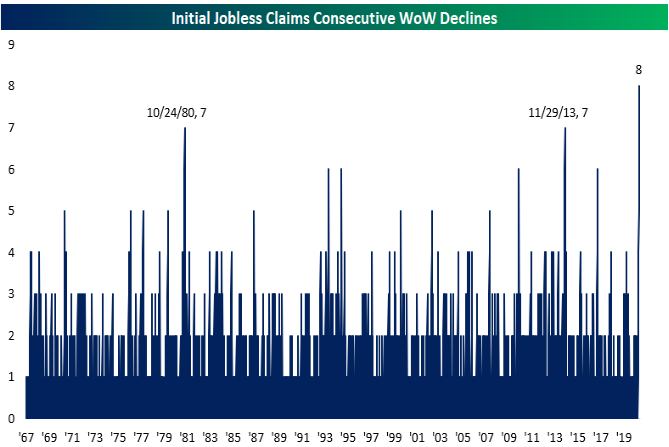
This week’s economic data calendar is certainly heavy than last week and today’s ADP payroll report will likely add to the weight of evidence that supports trough economic conditions that lead to rebounding economic activity. We anticipate Thursday’s initial jobless claims data to also continue on it’s descending path of weekly claims. To-date, we’ve seen claims rise to record levels, but with each of the past 8 weeks showing fewer and fewer reported claims.
Of course, Friday we’ll see what the Bureau of Labor and Statistics has to say about the unemployment rate, wages and Nonfarm Payrolls for the month of May. Back to the markets…
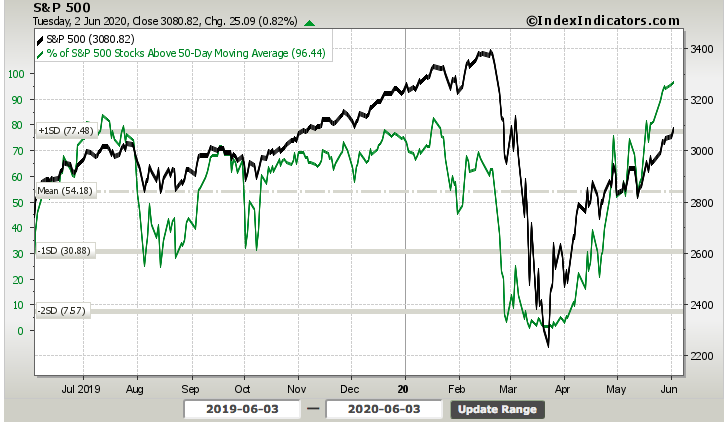
In past reports and articles we’ve outlined the belief that we had established a new bull market based on several criterion and even as we have not fired a Breakaway or Zweig Breadth thrust. The S&P 500 achieving and closing above it’s 200-DMA with now 96%+ of stocks trading above their 50-DMA is a clear sign of a new bull market.
Nonetheless, Leuthold Group questions the new bull market using a study of former bull markets renewing. He is what the firm had to say on Tuesday, regarding the “new bull”.
“Is this a 1st leg of new bull market or 2nd-largest bear rally of 125 yrs? The March low was 0-for-5 w/ conditions typical at cyclical bear lows. And the 30% surge off the low met 0-of-3 dynamics that usually accompany the 1st leg of a bull market. 0-for-8 is not encouraging.“
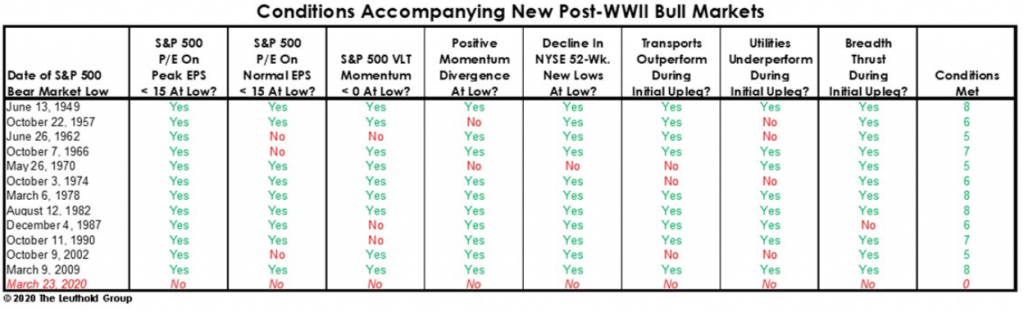
That’s a pretty “damning” study of new bull markets when compared to the present day. What I would have to recognize though is that the number of stocks trading above the 50-DMA is a goodly offset to many of the criteria in the study from the Leuthold Group. Either way, this study doesn’t exonerate or dismiss current market characterization any more than it dismisses a pullback in markets. Speaking of pullbacks…
Mark Newton of Newton Advisors and a frequent guest on CNBC offered his 5 reasons a pullback in markets is increasingly probable.
“I expect US stock markets have begun a short-term topping process that should result in a 5 percent decline in stocks into early or mid-June. I plan to sell into strength over the short-term.”

Here are 5 reasons that suggest a short-term selloff is near:
- Near-term overbought conditions – While Daily RSI is not yet overbought, RSI on a 2 and 4 hour bar chart has reached overbought levels and looks important as a minor negative for the short run.
- Technology waning- we’ve seen signs of rampant sector rotation all week, but it’s tough to see Tech moving up rapidly with the NDX right up near prominent former highs. This sector outperformed sharply since March, so the large-cap FANG stocks could certainly give back some ground, and at 26% of SPX Tech waning would be important.
- Early negative breadth on Thursday 5/28 rally attempt. I anticipate that even on a Friday or Monday bounce breadth will be negative.
- Demark indicators are finally in place on both a daily and weekly basis to suggest upside exhaustion is in place (TD Combo/TD Sequential/SellSetups)
- Defensive trading came back in a big way on Thursday and this happened actually as Equities were rallying in the morning. Utilities gained nearly 3% but managed an impressive short-term breakout that argues for further follow-through.
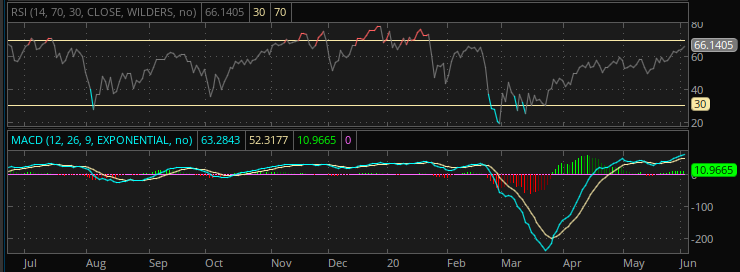
I could easily lean against a few of the Newton’s reasoning for lightening market exposure, but tactically I don’t disagree, as there are also some macro-considerations to put forth that pose risks to markets near-term. I actually like the look of the 14-day RSI and the current MACD histogram, although it is being argued that the 14-day RSI is less useful if thinking near-term.
In terms of a tactical approach near-term, lightening one’s exposure to markets can prove advantagous even as the market trends higher, for active portfolio managers. Why? Daily risk can still be executed until a more material pullback does develop. The securing of a cash position also lends itself well to trader psychology. But, and it’s a big but with regards to market exposure, it should be remembered that Tuesday’s MOC was rather extreme and extreme for good reason, as it led markets higher into the final trading minutes.
The Morgan Stanley Quant Derivatives Strategy Team estimates ~$10-12B of equities will need to be bought over the next week (or ~$2-2.5B per day) with the majority of that demand coming from trend following Commodity Trading Advisers. We would anticipate any intraday weakness to be bought by this cohort of investors and potentially resulting with late day MOC net buy side activity. Sometimes, market mechanics outweigh fundamentals!


