
Over the last couple of weeks, we’ve been able to compile and discern all the characteristics of a bear market that was on a path to reinstalling a bull market. The key variables identifying such a probable outcome for the market were based on market leadership, structure, breadth and moving averages. As of the close of last week, the S&P 500 had reached and closed above it’s 200-DMA with greater than 85% of stocks trading above their 50-DMA, thus a new bull market was born. On Monday and as we commenced a new trading week, the trend proved friendly despite the ominous societal headlines that sowed the seeds of civil unrest and as certain cities found demonstrations, marches and riots over the weekend. Extrapolating the proper context of these headlines can prove difficult for many, but the market understood that a couple doesn’t cities do not qualify as “en masse” or “across the country”. I’m not dismissing the violence and dismay out-of-hand, as the situation is nothing I desire to rehash with my grandchildren some day, but rather recognizing that in due time human ingenuity and rationale will find the answer/s. The market doesn’t care about social injustices, even if I/we do. In this outcome noted, I trust the human rationale more than the media hyperbole.
Just as it has been since the market’s bottom, small caps lead the way on Monday with the Russell 2000 (RUT) outperforming. And while the S&P 500 (SPX) was only slightly higher for the trading session, breadth still improved beyond the mega-cap tech names.
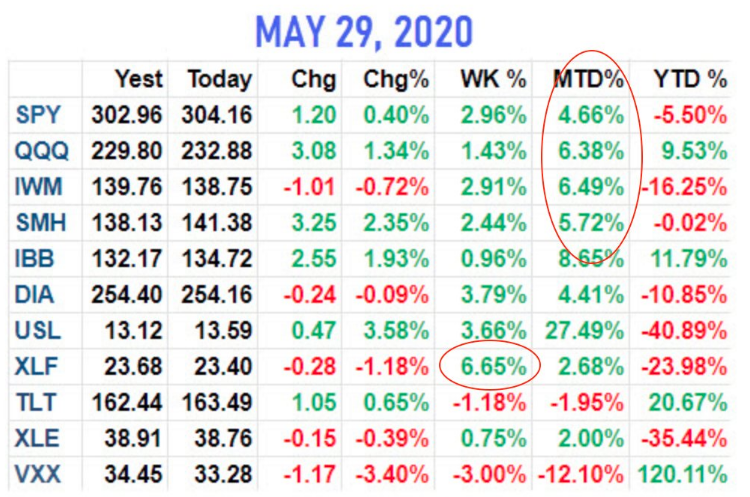
- Tech leading in 2020 +9.5% YTD.
- Small caps led in May, +6.5%.
- Banks led last week, +6.7%.
- Equal-weight has outperformed Cap-weight
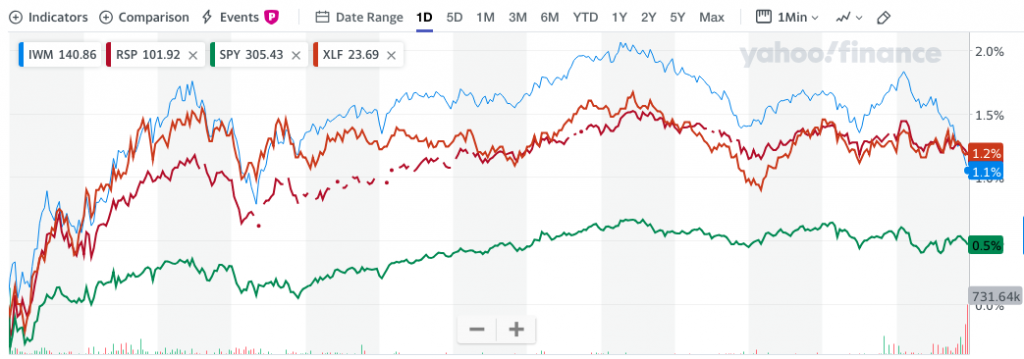
To reiterate, Monday once again found Equal-weight (RSP) outperforming Cap-weighted S&P 500 (SPY). The chart below identifies Monday’s ETFs percentage gains, with the XLF, small-cap IWM and equal-weight RSP all outperforming the SPY! This is not just sector rotation and index ETF outperformance but rather it is breadth broadening, the calling signs or validation of a new bull market. (SPY on bottom)
With strong, broadening breadth, we are forced to recognize the truth underlying price action, but this does not exonerate the probabilities for which to anticipate some degree of consolidation in the near-term. Overbought conditions are recognized in the 2-month markets’ rally. In fact, yesterday found more than 95% of stocks trading above their 50-DMA, the highest of the cycle and one of the highest on record.
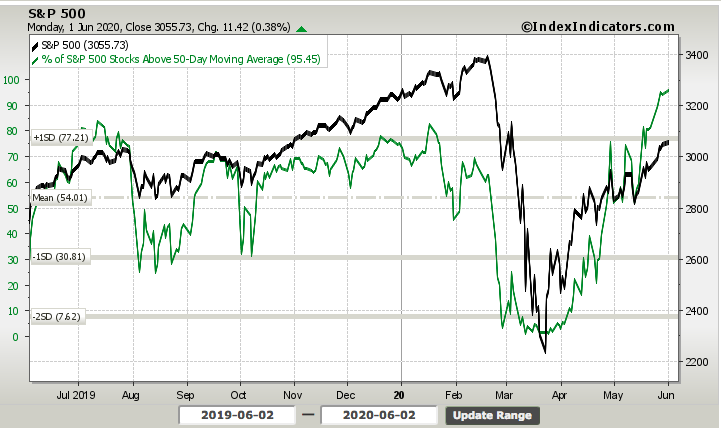
April and May proved the best 2 months for the market since the S&P 500 bounced off the 2009 lows. We’ve gone from severely oversold to overbought in no time. Such overbought conditions usually result in near-term turbulence and/or distribution, but the identifying marks of a bottom and new bull market suggest using such distribution/consolidation as buying opportunities.
Another mile-marker that identifies the new bull market is afoot took place on Monday. The New York Stock Exchange Summation Index (NYSI) had been negative from March-April. Since 2003, higher highs in S&P 500 have been ahead once it found itself above 500. It never reached 500+ during the 2007-2009 bear market.
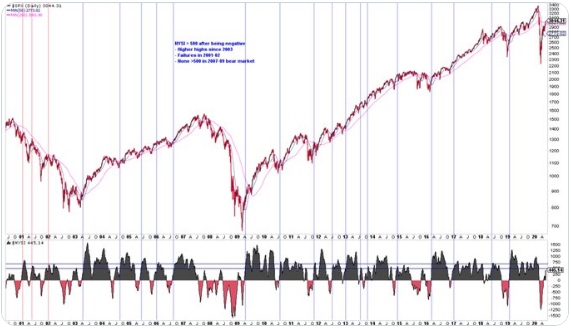
On Monday, the NYSI indeed achieved 507. The chart above identifies the S&P 500 (top panel) and NYSI (bottom panel) relative move. The NYSI achieving 500+ suggests flows continue to point to higher highs in the future, even if not right away. While the positive market breadth and index achievements have been laid before us, the overbought conditions and complacency suggest caution, at least over the coming weeks. In reviewing the Equity put/call ratio, we’re also forced to recognize the aforementioned cautiously optimistic outlook:
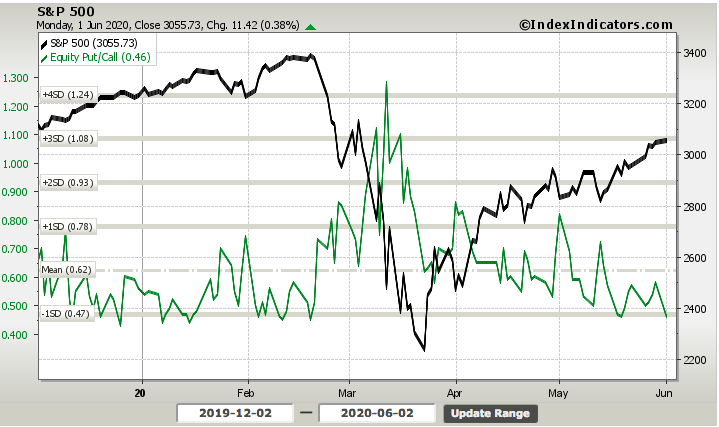
Additionally, the table positioned below identifies past occurrences whereby the Put/Call ratio was less than .60. On Monday, the Put/Call ratio fell to .46. History shows that the average return over the course of the following 20-days, when the Put/Call ratio is this low, is usually negative, albeit modestly. So nothing overly concerning, but it’s always beneficial to know the statistical probabilities for the market near-term with respect to this particular metric/input.
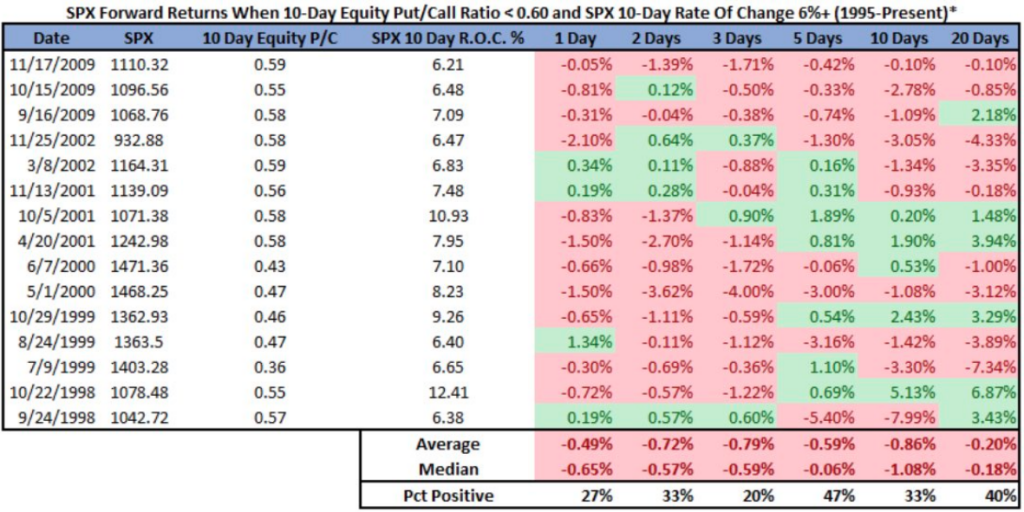
But don’t forget that liquidity could also exacerbated the negative returns identified in the table.
Possibly adding to our cautiously optimistic outlook is the following breadth chart analysis. The chart shows the spread between the percent of NYSE stocks above their 50-day moving average and the percent of NYSE stocks above their 200-day moving average ($NYA50R-$NYA200R, top panel). The bottom chart/panel is the New York Stock Exchange (NYSE).
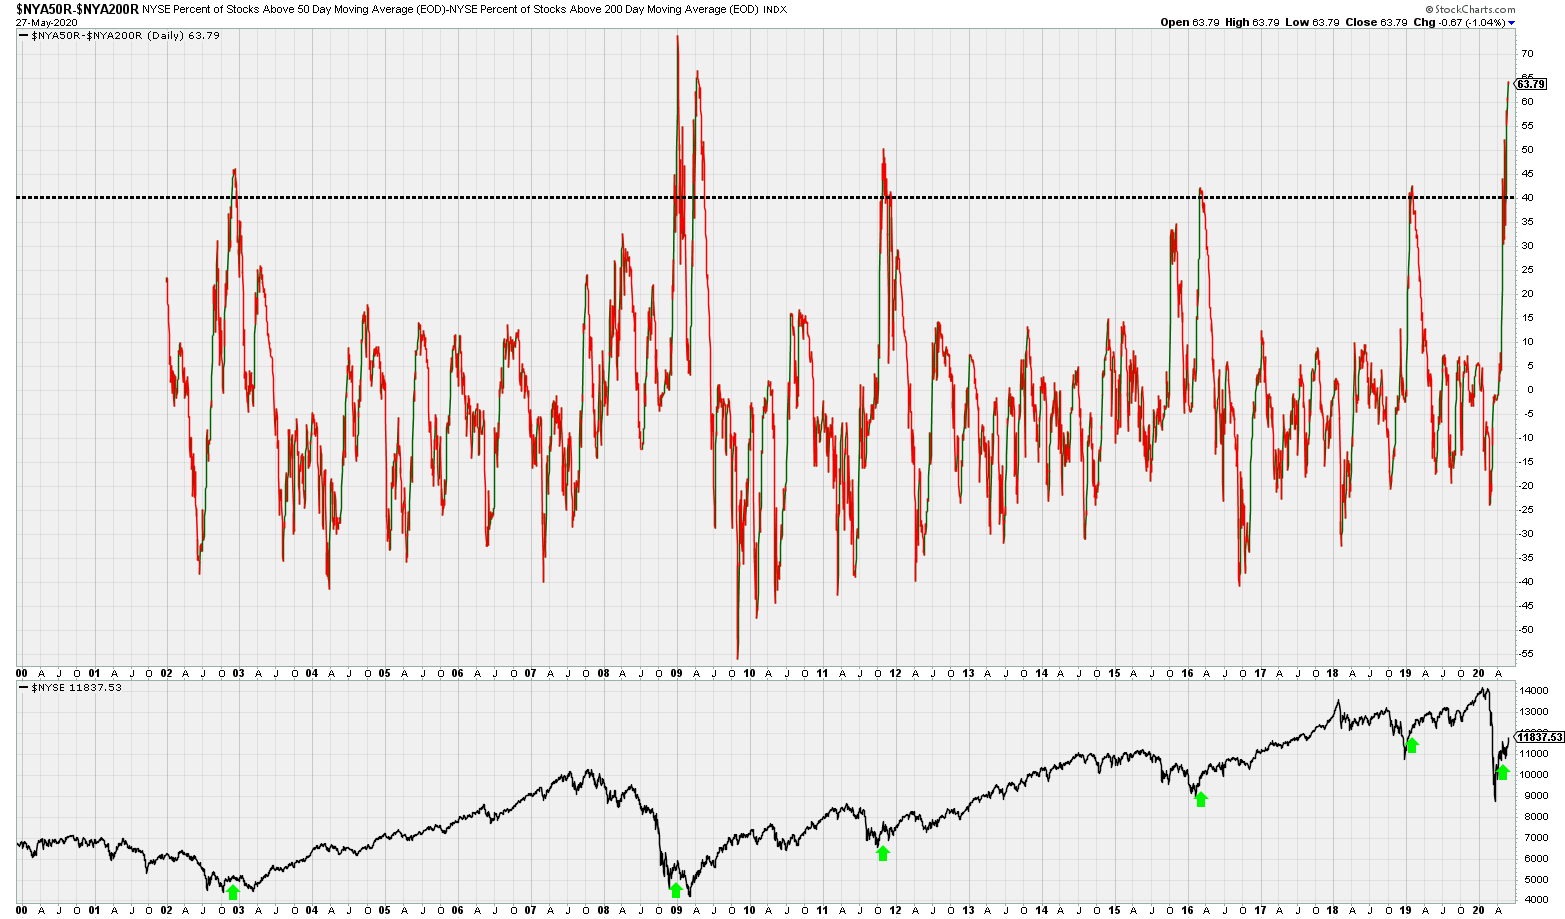
As of Monday, 91.57% of NYSE stocks were above their 50-day moving average, while only 27.78% are above their longer-term 200-day moving average. The chart recognizes that the spread between these 2 breadth metrics hasn’t been this wide since 2009, a major bear market low. The lower pane shows the NYSE over the past two decades with green arrows marking the instances where the spread spiked above 40. As you can see, this wide disparity isn’t exactly a bearish characteristic. The breadth study doesn’t discount near-term turbulence, it simply identifies that we should anticipate higher prices in the not too-distant future.
As the market seems to both defy the present situation and discount future earnings, historically a normal market function, disbelief in the move off the bottom has plagued investors. Some of the most highly recognized market participants have warned of an ultimate calamity still yet to come for the market since April.
Jim Bianco of Bianco Research is a well regarded market historian and research analyst, but his call in April was offsides and inconsistent with the actual market achievements since. The list of market participants and fund managers that echoed his sentiment is too long to list, but identify the wall-of-worry that the market typical overcomes.
- Buffett Not buying.
- Druckenmiller says worst value ever
- Tepper says too rich for my blood
- COVID second round of infection escalation
- Marko Kolanovic says could consolidate
- Mike Wilson says could consolidate
- David Kostin “… consolidate”
- U.S./China tensions.
- Forward Next 12-moth (FWN12) PE.
- Marches/riots/demonstrations.
- Unemployment rate 20%+
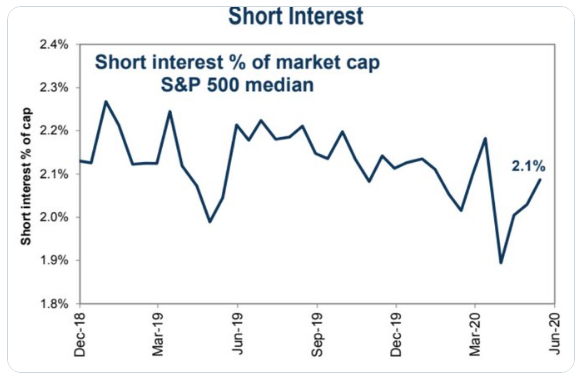
Maybe all the aforementioned negative sentiment and variables of concern are sustaining a high, albeit lower than in previous months, level of short SPY and S&P 500 futures (ES) interest. To-date, however, such short interest and positioning has also proven in error.
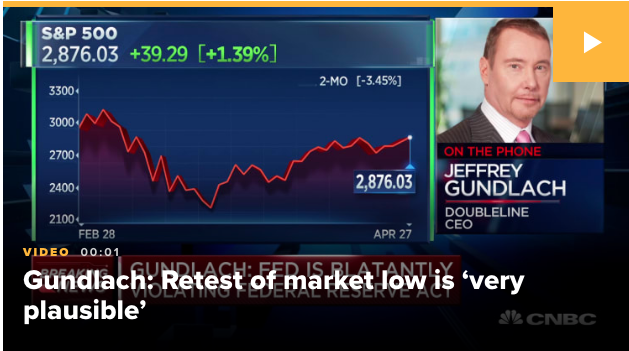
Least we forget Double Line Capital’s Jeffrey Gundlach went short the S&P 500 nearly 200 S&P 500 points ago?
“Actually I did just put a short on the S&P at 2,863. At this level, I think the upside and downside is very poor. I don’t think it could make it to 3,000, but it could. I think downside easily to the lows or beyond … I’m not nearly where I was in February when I was very, very short.”
These are supposed to be the best of the best fund managers and analysts alike? If they are, they clearly aren’t any better at timing markets/price than you or me!
Adding to the list of near-term sentimental headwinds for the market is Citigroup’s Manolo Falco, investment banking co-head. Falco said that financial markets were “way ahead of reality” with tougher times to come, warning corporate clients that they should raise as much money as they could before the pandemic’s true cost is factored in by investors.
“We definitely feel that the markets are way ahead of reality. We really are telling every client to tap the market if they can because we think the pricing now couldn’t get any better.
As the second quarter comes along and we start seeing the pain, and the collateral effects of that, we think this is going to be much tougher than it looks.
Markets are pricing a V [shaped recovery], everyone’s coming back to work, and this is going to be fine. I don’t think it’s going to be that easy quite frankly.”
And if the list of concerns noted by all the aforementioned market participants wasn’t enough, simply watch the following Sven Henrich (NorthmanTrader) YouTube video with guest commentary from CNBC contributors Dan Nathan and Guy Adami.

Both Guy Adami and Dan Nathan have been suggesting investors fade the S&P 500 rally since about 2,600. Roughly 400 points later…, well you get the picture. Again, market timing and the so-called pros fail to recognize market breadth, long-term risk-reward as determined by the equity risk premium (ERP) dominate and overcome such market timing efforts. Are these the folks guiding your portfolio decision-making process?
In no way, shape or form am I suggesting a market correction isn’t probable, but rather identifying the long-term opportunity is a better vantage point for which to manage one’s portfolio as the near-term outlook is lesser understood. Additionally, history suggests the market should perform well during the summer months. But this statement deserves a bit more discover and due diligence. Here is a seasonal chart dating back to 1962 from Renaissance Macro Research:
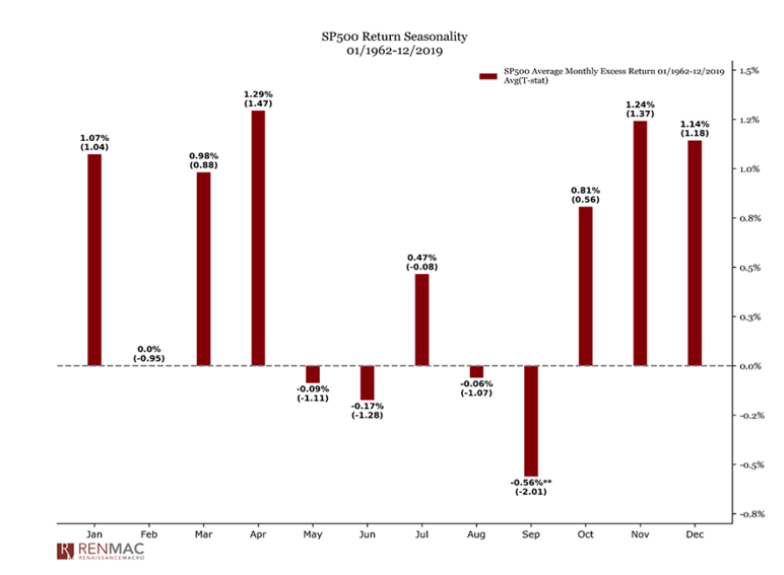
While the month of June hasn’t fared positively on average, dating back to 1962, July may prove a better time to sell. July coincides with the end of Q2 earnings season. Fade the earnings season, which leads up to the best time to own stocks, November to January. Having said that, if we look further back in time we recognize that the 2nd best 3 months of the year to own stocks is actually June-August. Going all the way back to 1928, which may skew some of the data, the next 3 months of the year tend to produce the 2nd greatest returns, next to the 4th quarter.

This is why it can prove difficult to assess the probabilities for market returns near-term, as the study of historical data itself is very dependent on time frames and inputs.
In the 6:00 a.m. EST hour on Tuesday morning, equity futures are marching higher, building on the gains from Monday and since the market bottom. As of Monday, the S&P 500 has rallied nearly 37 percent. Can the market actually finish positive for the year?
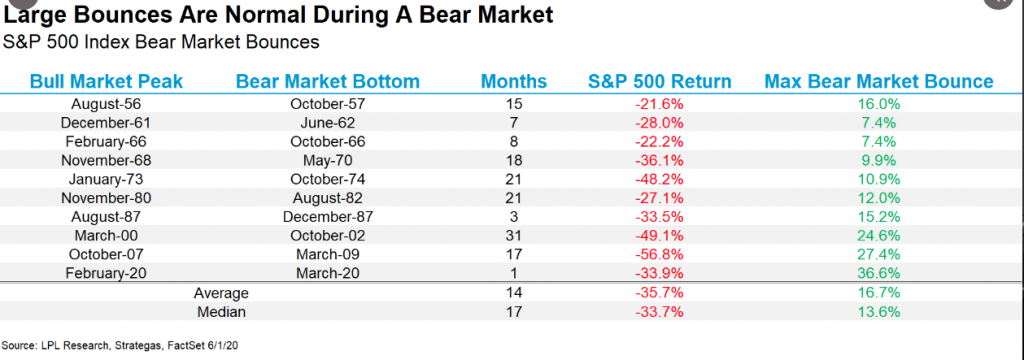
As shown in the LPL Financial table above, at the lows the S&P 500 was down nearly 34% on the year. There has never been a year that saw the benchmark index down that much, and then come all the way back to green. Here are the previous largest reversals.
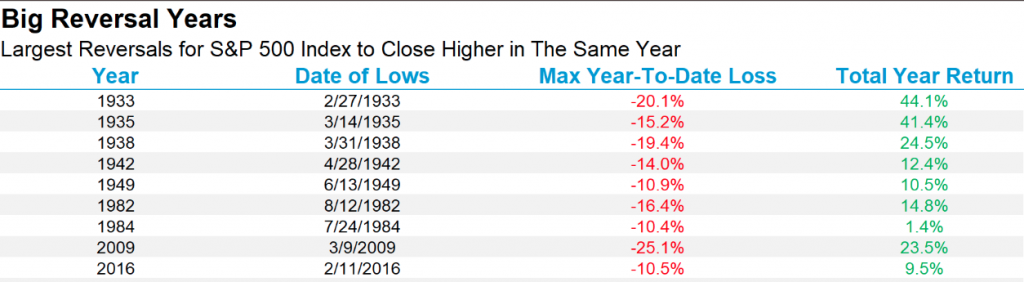
No year within the table above showed the magnitude of decline as there has been in 2020. It would be unprecedented to see the S&P 500 higher at year end. This doesn’t mean it can’t happen, it simply forces us to calculate the probability. Nonetheless, broad market breadth that has led to a nearly 40% rebound off of the lows forces us to recognize the longer-term implications for S&P 500 returns.
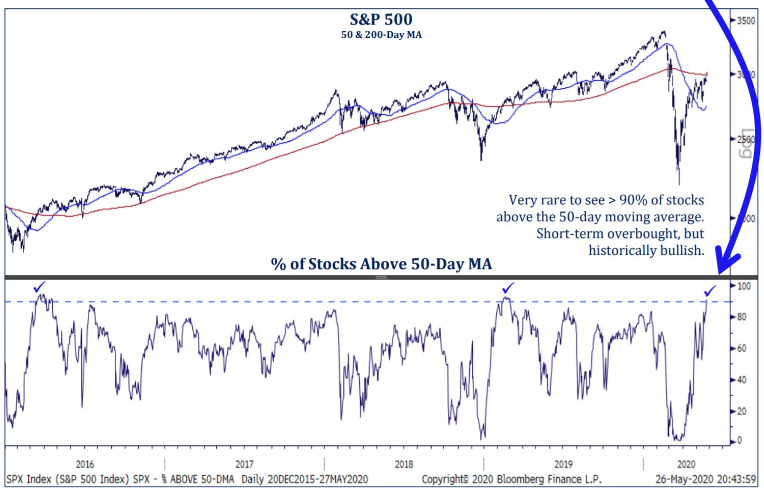
Historical S&P 500 data reveals that these momentum/breadth surges have tended to be followed by solid returns. Any near-term bumps along the way typically have been short-lived, and the uptrends often continue.
Putting numbers to this, when the percent of S&P 500 constituents with returns above their 50-day moving averages has exceeded 90%, performance for the S&P 500 over the subsequent one, three, and six months has been above average.
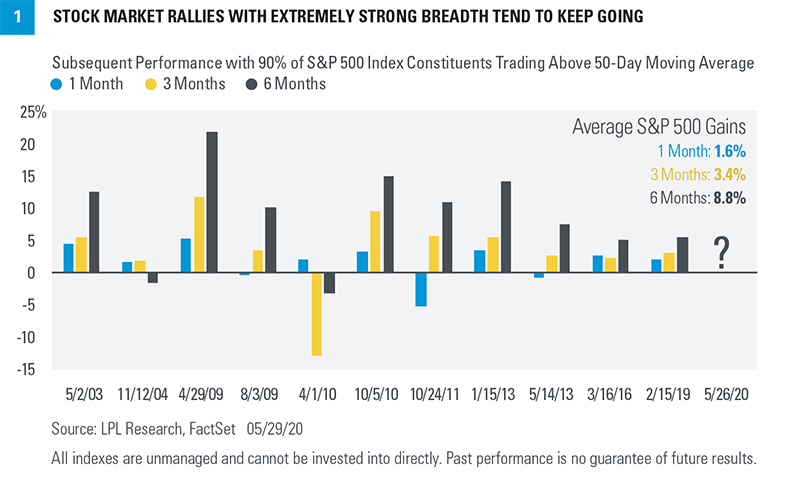
That was the case the week of May 25; additionally, the reading exceeded 95% of S&P 500 constituents on May 27 and May 28 for the first time since 1991. The LPL Financal chart displays 17 years of data, but returns in this scenario have been above average going back four decades.
While a majority of analysts and strategists continue to pound the table regarding a market pullback/consolidation, which is a high probability, LPL Financial discloses it’s year-end price target and optimism. Here is what the firm recently outlined to clients:
“Our year-end 2020 fair value target range for the S&P 500 remains 3,150–3,200. To get to this number, we use a price-to-earnings ratio (PE) of about 19 and a normalized earnings figure of $165. An annual earnings run rate like that may not be achievable until late 2021 and early 2022. With interest rates so low, the potential for a vaccine during that time frame, and support from massive stimulus, we are comfortable using a longer-term earnings target to value stocks. For long-term investors, we find stocks more attractive than bonds at current valuations and recommend overweight allocations, and a corresponding underweight to fixed income for suitable investors.”
Can the average investor account for every tick of every day, of every week for the S&P 500? No and they shouldn’t try to do so! Investors should think and manager their risk exposure with a longer-term time horizon as it tends to remove the psychological elements associated with near-term price fluctuations. And there will likely be fluctuations folks! Moroever, can the average investor account for and forecast the headwinds that will prove to cause price fluctuations? Again I would offer a resounding no and especially given the uniqueness of the current fiscal/economic policies that prove quite uncertain…
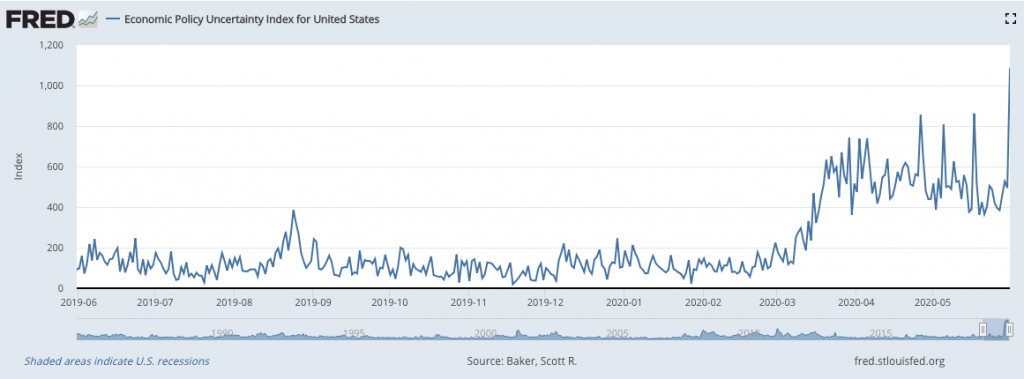
With the White House administration apparently talking up a negative tone with China and tensions seemingly on the rise between the 2 largest economies in the world, how this latest saga plays out remains front of mind with media pundits and investors alike. And that is before we consider the President’s latest tiff with social media platforms like Facebook (FB) and Twitter (TWTR). The latter seems to be catching more of the President’s ire than the former, but we believe this will prove an opportunity for investors with TWTR’s stock price coming under pressure. Speaking more directly to the options activity surrounding TWTR…
Over the last 10 trading days, the 20 stocks below have attracted the highest weekly options volume, thanks to data courtesy of Schaeffer’s Senior Quantitative Analyst Rocky White. Stocks highlighted in yellow are new to the list. Standing out this week is TWTR), which recently made headlines after applying a fact-check notice to U.S. President Donald Trump’s tweets regarding voter fraud. Below, we’ll take a closer look at the options activity surrounding TWTR and see how its been performing on the charts lately.

Puts on an overall basis, puts have been unusually popular in the options pits, per TWTR’s 10-day put/call volume ratio of 0.54 at the International Securities Exchange (ISE), Cboe Options Exchange, and NASDAQ OMX PHLX (PHLX), which sits higher than 98% of other readings from the past year. In Monday’s trading, the weekly 6/5 30-strike put is most popular, followed closely by the 32-strike call in the same series, with new positions being opened at the latter.
With the options activity outlined above, again, I would be of the opinion the current political tiff between President Donald Trump and Twitter will prove an opportunity for savvy investors, over the long run! Having said that, and with respect to full disclosure:
With economic data surrounding the labor market ahead of us, I believe this week could be found with more choppy trading action, which is more geared toward active traders. Wednesday’s ADP private sector payroll report is going to lend itself toward identifying the probabilities for under/outperformance of Friday’s Nonfarm Payroll report. As of right now, Merrill Lynch is forecasting payrolls to fall by 8mm and unemployment to rise to 19.0 percent. At present, the consensus Nonfarm Payroll estimate is for 8,250,000 jobs lost, and for the unemployment rate to increase to 19.7 percent. There were 20,500,000 jobs lost in April, and the unemployment rate was at 14.7 percent. It ain’t a pretty picture being painted in the here and now for the labor market, but the bar is being set at nearly a record-low level, potentially making future labor & employment reports easier to jump over. Less bad will prove… good and something the market has been pricing in over the last 2 months!


