
The trading week has started more positively than the last and with small caps bridging the lagging gap between large caps, as the Russell 2000 (RUT) proved the outperformer on Monday. The S&P 500 gained almost .7% or 20 points on Monday, now more than halfway toward completing the $3/point weekly expected move. Other than a continuation from better than expected Q3 earnings results, headlines were rather light on the geopolitical front Monday. As we plow through the busiest earnings week of the season, some key reports will be delivered before the opening bell on Tuesday and with the S&P 500 looking to hold above the 3,000-level.
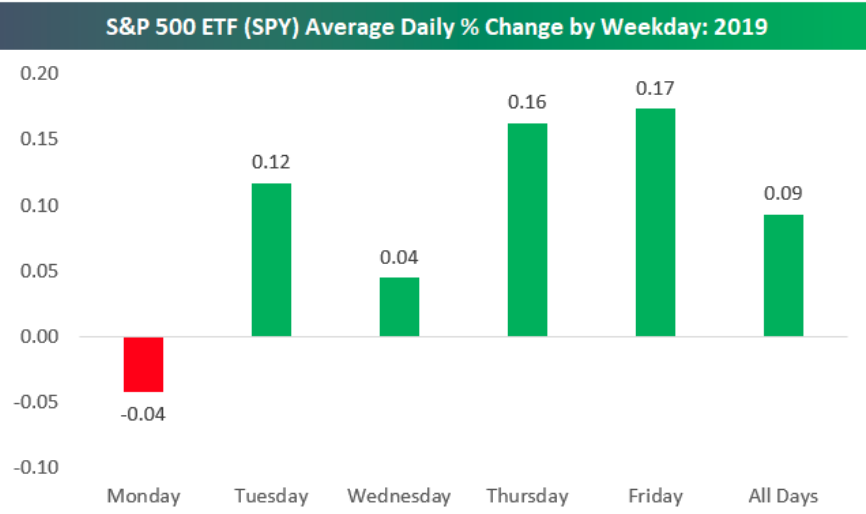
The strong stock market start to the week is a bit unusual for 2019. In fact, according to Bespoke Investment Group, Monday has proven the worst performing stock market day of the week in the current calendar year. Check out the chart below of the stock market’s daily performance for 2019, maybe not what you would have expected:
The economic data calendar is light Tuesday and for the majority of the week. No economic data was released Monday and Tuesday investors will get another tally from Existing home sales. Housing sector economist Tom Lawyer outlined his expectations for Existing home sales last week and as follows:
“Based on publicly-available local realtor/MLS reports released across the country through today, I project that existing home sales as estimated by the National Association of Realtors ran at a seasonally adjusted annual rate of 5.36 million in September, down 2.4% from August’s preliminary estimate but up 3.5% from last September’s weak seasonally adjusted pace. Unadjusted sales should show a higher YoY increase, with the SA/NSA gap reflecting this September’s higher business day count relative to last September.“
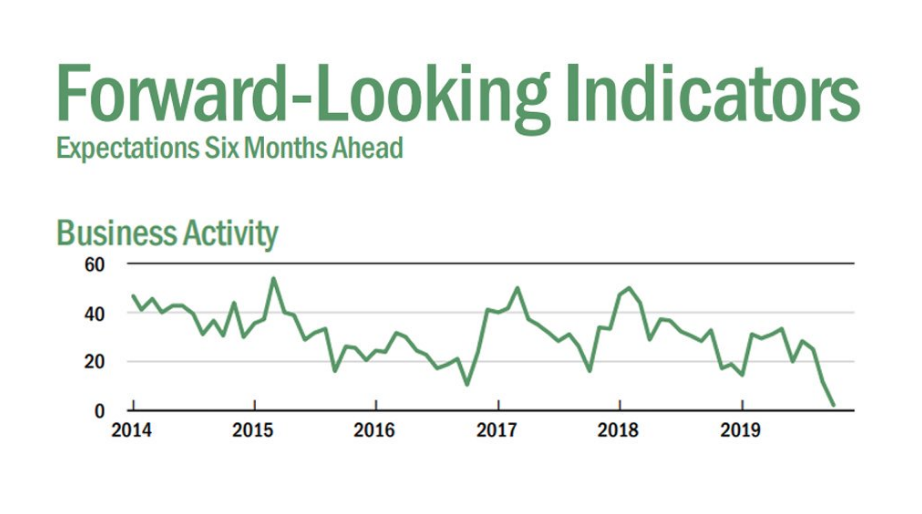
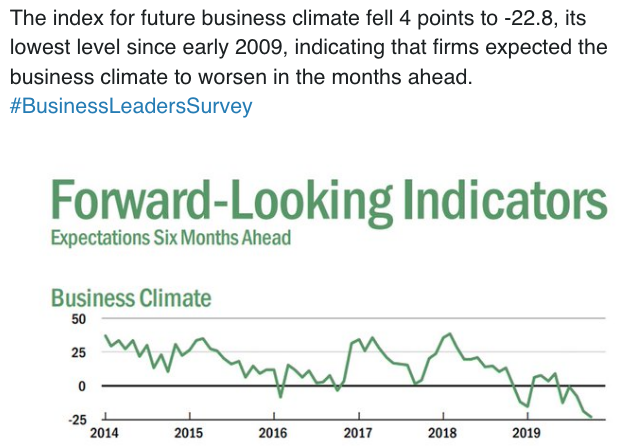
The economic data calendar is back week-loaded with Thursday’s release of jobless claims, Markit PMI data, Durable goods orders and New home sales. Most economists will be adjusting their respective Q3 GDP forecasts on this day and post the released data. At present, the U.S. economy slowing from above trend-growth in 2018 to trend-growth in 2019, which feels a lot worse than it sounds, depending on which media outlet you prefer. With the slowing growth, expectations are the worst of the cycle. That summary was supported by the N,Y. Fed’s October survey. The business activity index fell 9.2 points to -4.3 which is the worst reading since the trough in mid-2016. Expectations for business activity in the next six months fell 9.5 points to 2.2 which is the worst reading since early 2009. As the chart below shows, expectations for the business climate fell 4.2 points to -22.8 which is also the worst of the cycle.
Much of the fear or concern over the economic outlook is similar to what we more recently experienced in 2016, but with a more significant earnings recession. Having said that, the recent MoM retail sales decline combined with some squishy industrial production data has given economists cause for concern. As such, we would be paying close attention to both Durable goods and Markit services PMI releases on Thursday. At present, regional Fed banks and big money center banks have been reducing their Q3 GDP outlook over the last month.
- From Merrill Lynch: Weak inventories data edged down 3Q GDP tracking by a tenth to 1.5% qoq saar. [Oct 18 estimate] emphasis added
- From the NY Fed Nowcasting Report: The New York Fed Staff Nowcast stands at 1.9% for 2019:Q3 and 1.1% for 2019:Q4. [Oct 18 estimate]
- From the Atlanta Fed: GDPNow: The GDPNow model estimate for real GDP growth (seasonally adjusted annual rate) in the third quarter of 2019 is 1.8 percent on October 17, unchanged from October 16. [Oct 17 estimate]
With sentiment for future economic growth seemingly souring with each passing quarter and reduced expectations for growth going forward, such conditions usually prove a strong set-up for improved monetary and economic policy. This is, at least in part, why we have seen both the Fed easing and some de-escalation in the protracted trade war.
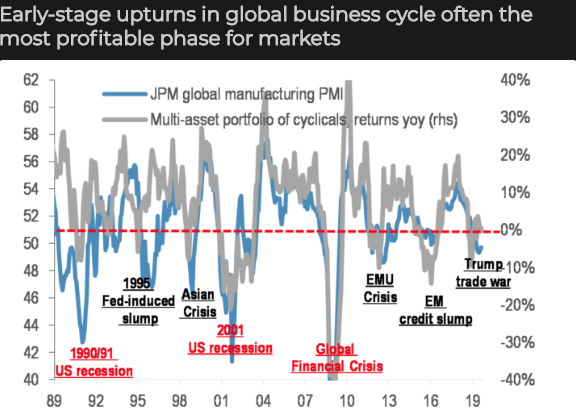
One of the more often overlooked aspects of the financial economic data we contend with on a weekly basis is that when the data becomes weak or is weakening, this tends to produce the greatest noise within the data. The earlier a metric is at predicting future outcomes the noisier it will likely prove to be. With this in mind, investors might also consider that when the economic data looks its most bleak, it tends to be at a trough and about to turn higher based on easing financial conditions offered through central banks and a shift in economic policy, both previously noted. Given the noise in some of the global manufacturing PMIs, the conversation and consideration offered might be the opportunity investors are looking for going forward, according to JP Morgan. The firm believes that PMIs are presently near or at a bottoming point and will prove to rebound going into 2020. Historically, bottoming PMIs have produced strong “cyclicals” returns over the next 12-month period, at least.
While most blame the protracted trade war for the slowing global and domestic economies, not everyone is of the opinion that the trade war will lead to a recession over the next 9-12 months. Goldman Sachs economists Jan Hatzius offers 3 reasons why the trade war wont lead to a recession:
- First, we estimate that the direct effect of trade restrictions—that is, the effect excluding financial conditions and sentiment—on US growth is only about ¼pp, as the hit from lower real income is partially offset by a shift in demand towards domestically-produced goods. This is quite small relative to past shocks that ultimately caused recessions. To take an extreme example, we estimate the direct effects of the 2008-2009 housing and mortgage crisis at over 2pp.
- Second, while trade restrictions have likely tightened financial conditions—with an estimated growth hit of ¼-½pp—the Fed’s turn toward easing has offset this effect so far. In fact, financial conditions have eased substantially on net this year, so our FCI impulse measure is now gradually turning more positive.
- Third, it is surprisingly difficult to find large additional growth effects via the business sentiment and uncertainty channel. Starting with overall economic policy uncertainty, there is a clear negative correlation with capital spending. However, the link weakens substantially when we take into account the FCI and company capex expectations (which both still signal a decent outlook).
And with respect to a potential phase 1 trade deal that leads to a more comprehensive deal in the future between the U.S. and China, here is what Christopher Woods, an economists at Jefferies had to suggest in 3 points of his own.
- Trump is beginning to realize that he thought he had more leverage on China than was in fact the case because he incorrectly assumed that last year’s 25% decline in the China A share index was caused by his trade war.
- Christopher remains firmly of the view that Trump will not want to raise tariffs on the $160B of US consumer goods in December, because of the obvious risk to the American economy, which has already showed signs of deceleration.
- These aforementioned items keep Christopher hopeful that a more substantive deal will be agreed upon in the run up to the November meeting of the two leaders in Chile.
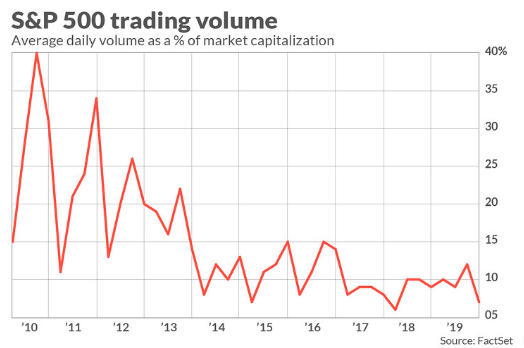
U.S. equity futures are pointing to an ever so slightly positive open on Tuesday and with European indexes in the green. Equity market volume has been quite light in the last couple of trading weeks and we would not anticipate a change in volume trend near-term.
Recall from the most recent notes via the JP Morgan quant team and with consideration of the light market positioning:
“Equity positioning remains light overall, presenting upside risk for the market if trade headlines today/over the weekend are positive, but positioning was volatile recently as the market bounced around important technical levels. Investors should consider buying short-dated OTM calls on the Russell 2000, XOP and/or S&P 500 to position for upside on positive trade developments, given this positioning tailwind and steep call wing skew.”
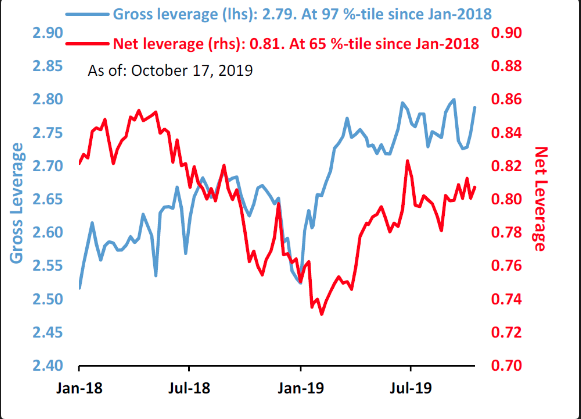
Finom Group offered these notes from the most recent JP. Morgan quant team report last week and it would appear as though investors were paying attention. When we take a closer look at hedge fund leverage some 6 days after this reporting from JP Morgan, it suggests that, indeed, hedge funds have been leveraging higher. And that’s how you get the market moving higher folks!
Finom Group remains of the opinion that the economy is on steady footing and found with loose financial conditions that support a continuation of the rebound in interest rate sensitive sectors of the economy, such as housing. This is a key determination in our growth outlook through Q4 and into the H1 2020 period. It cannot be stressed enough, the critical role that lower rates and an easing Fed policy set the stage for economic stimulus. The Fed is provide an ample liquidity backdrop for the economy and financial markets. And when the Fed is printing…
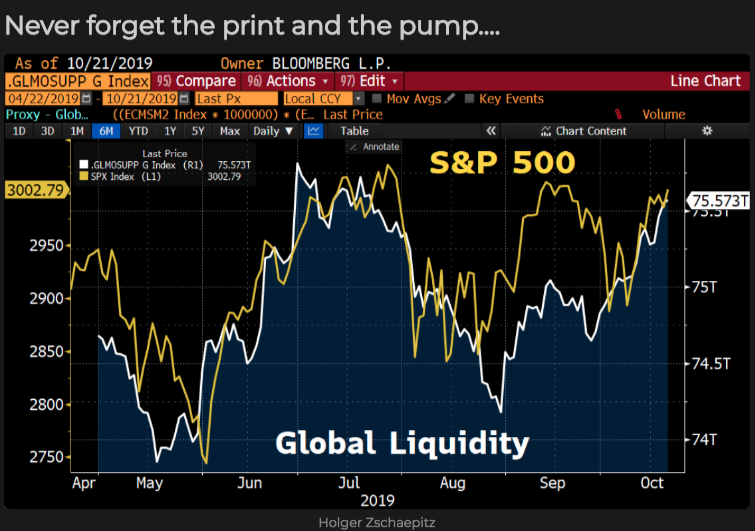
As shown in the chart above, when global central banks are easing and providing such liquidity to markets, the S&P 500 performs well. They are printing and providing liquidity and as such, Canaccord Genuity’s chief market strategist Tony Dwyer says investors may benefit from more aggressive equity positioning going forward.
In Dwyer’s latest appearance on CNBC’s Fast Money show, the strategist outlines his case for increased equity exposure.
- The Fed has said they are printing more money/liquidity. This means investors should have a more offensive playbook. The 10-year has made a low and has moved higher. Cyclicals are in play.
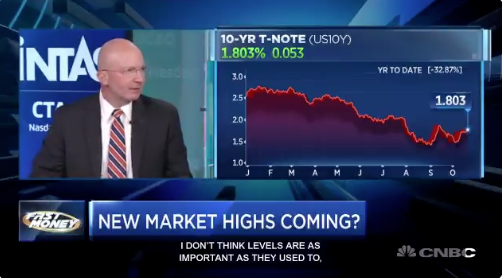
- The bull story is that economic growth has gotten weak enough to bring the Fed back into the picture and begin easing.
- An inflection point in global PMIs
- Rates have been cut in half and Fed is still printing money.
- Demographic tailwind with Millenials peak birth turning 30-years old.
In terms of a recession in the future, Dwyer doesn’t believe the Fed has limited tools to combat the onset of a recession. He emphasizes that the Fed has cut rates twice and it has indeed given a boost to the economy and interest rate sensitive sectors such as housing, which has a multiplier affect from goods purchased to go into homes purchased.
A lot has and continues to be offered with regards to the demographic tailwind the market is forecasted to see from the millenials hitting peak consumption age. Dwyer hints at it in his latest CNBC interview and Ciavocco Capital’s latest weekly research video, Chris outlines the case for a significant and potential stock market rally that lasts another 15 years.

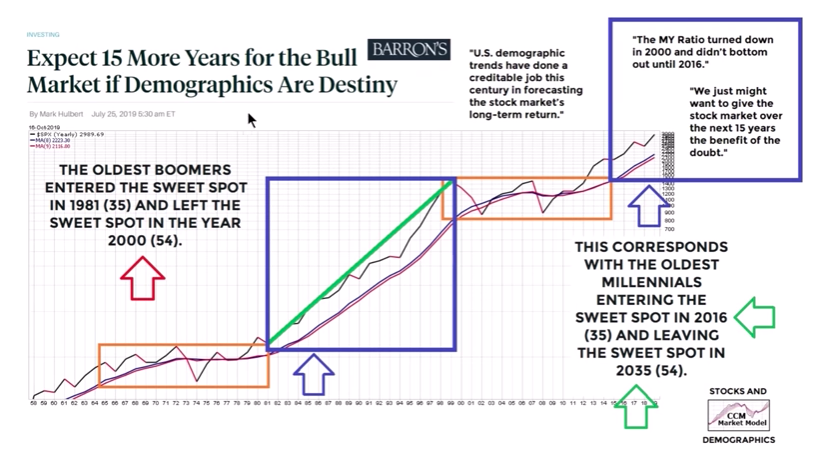
Finom Group strongly urges investors to review the YouTube video analysis from Ciavocco Capital as it poses a strong argument for the equity markets to surge higher into 2020, at least. But, we must emphasize the subject matter related to demographics may not hold up under the weight of greater scrutiny and analysis. Within the video, Chris dedicates the demographic boom to the economy and/or stock market boom, from human behaviors seen during the baby boom generation and their peak spending habits once this generation hits the age of 39-54, the sweet spot of consumption. The thesis is that human behavior doesn’t change that much, if at all. Finom Group doesn’t subscribe to such a thesis and is not of the opinion history will repeat for the demographic, specific reasons.
One of the major factors impeding our alignment with the demographic boom thesis is quite simple, birth rates.
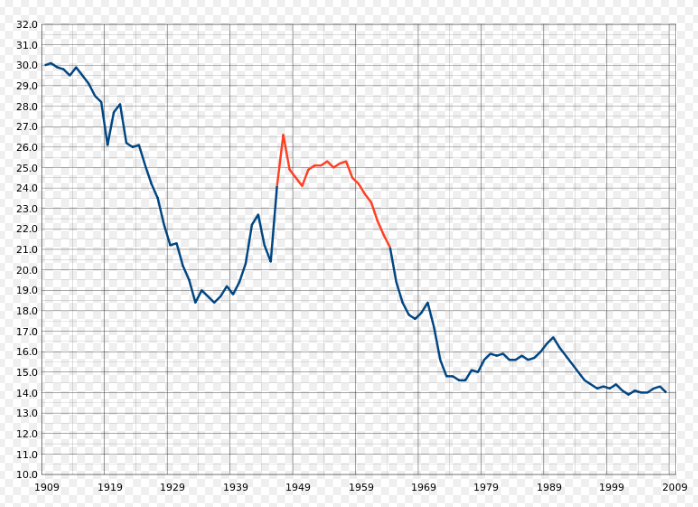
The segment for the years 1946 to 1964 is highlighted in red, with birth rates peaking in 1949 and dropping steadily around 1958 reaching pre-war Depression-era levels in 1963. The red segment is known as the Baby Boomer period. As we can see from the chart, something/s have impacted the rate of births in the U.S. ever since the post war and Depression-era. We can’t stress enough this key “behavioral change” in birth rates/reproduction.
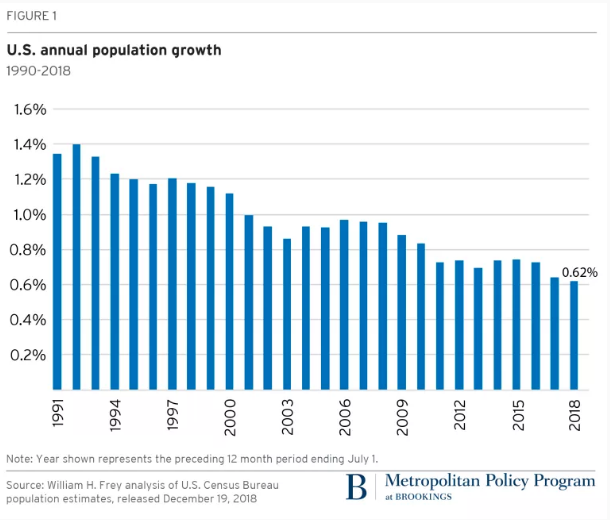
Moreover, you’ve heard the term aging population right. Well it aint getting anybody for Japan’s economy now is it? The U.S. population growth rate of 0.62% for 2017-2018 is the lowest registered in 80 years. While the nation’s growth rate varied through wars, economic upheavals, baby booms, and baby busts, the current rate reflects a further dip in a trend toward a lower level of growth,below 0.80%, registered since the Great Recession of 2007-2009.
Fine, you don’t believe that Japan’s former baby boom couldn’t be repeated and birth rates/population growth don’t show shifting and ever-evolving human behaviors, then just take a gander at the Personal Savings rate over time in the United States. Remember, if its about growing the economy then it’s about consumption, sales. As Millenials are now the majority demographic, we see a very different behavior through the Personal Savings rate
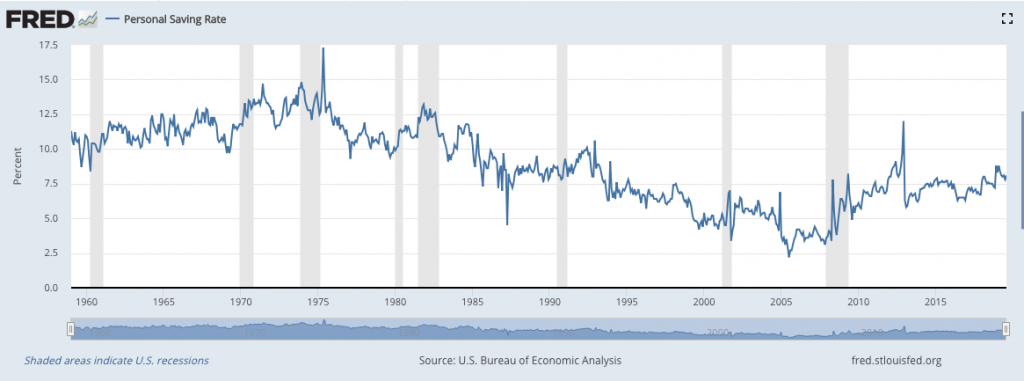
During what is now the longest economic expansion in history, we’ve seen an anomaly in the Personal Savings rate. It has consistently climbed higher through the expansion cycle, which was not seen in the mid-80s and during the peak consumption period of the baby boom cycle. It’s important to review these offerings from strategists and various YouTube market participants for their fundamental offerings, but it may prove even more critical to distinguish facts and opinions from theatre.
There’s a great deal to discuss from one day to the next in the financial markets and at present, investors remained focus on whether or not the S&P 500 can achieve another record level high in 2019. Finom Group continues to trade what the market delivers, offering our Trade Alerts daily/weekly to Premium members. Our latest trade was completed on Monday, with VIX Futures continuing to converge onto spot VIX. Our short on shares of UVXY from $21.81 Friday was covered for a profit of nearly 2% on Monday morning.
With respect to what appears to be improved risk sentiment from the investor community, we’ll leave our readers with the latest notes on the market from Goldman Sachs macro-guru Tony Pasquariello:
- I’d argue the path of least resistance is a rally in global risk assets from here to the end of the year.
- The past few weeks have brought hopes of a genuine macro inflection point (in the form of peaceful Brexit) and de-escalation of the trade war (a truce at most, but ceasefire nonetheless).
- In the context of very conservative positioning and very favorable seasonals, to my eye the implication of these events is clear: there should be some gas left in the market’s tank.
- On a tactical basis, the risk/reward of owning short-dated upside on global equities is worth the premium spend.
- Now, somewhere in the (mythical) trading handbook, there’s a rule of thumb: when the market is de-risked … and the outlook fundamentally changes … you’re supposed to go for the most obvious trades. therefore, my instinct is the cyclical parts of the risk complex — think NKY and DAX, RTY and BKX –


