Doing well, doing well, doing well, doing well… and then…It’s all fun and games until the flows stop flowing and the earnings start missing estimates. It proved quite the choppy day on Wall Street as the S&P initially climbed and held onto gains for much of the trading session, but then…
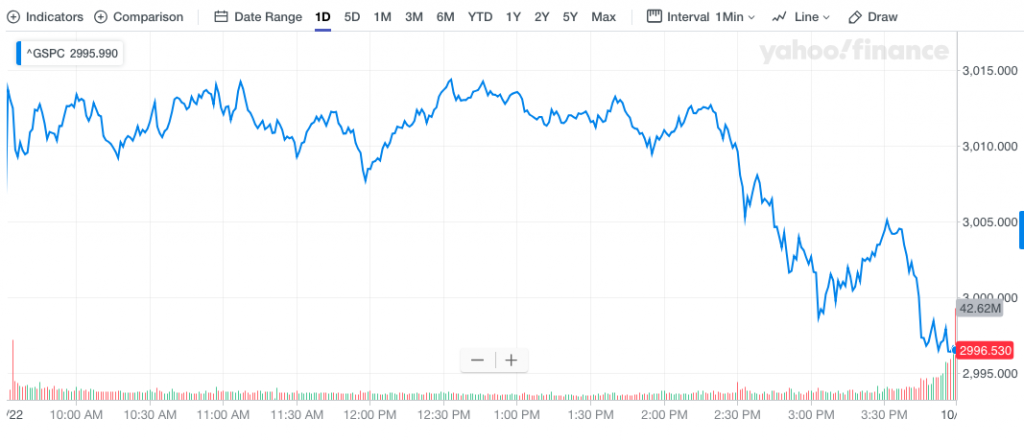
The S&P 500 (SPX) Tuesday, intraday chart shows that the trading day was moving along rather swimmingly until the bottom dropped out and gains turned into losses. And what caused the intraday reversal of fortunes you might be asking? Well it was the usual geopolitical headline, but this time it had to do with the latest Brexit vote failure that would otherwise force the U.K. to ask for yet another Brexit extension.
On Tuesday, a majority of MPs (Members of Parliament) signaled their support for the agreement that Johnson reached with the other 27 EU nations last week. However, in a follow up vote just 15 minutes afterwards, they refused to rush through the necessary legislation to leave the EU in three working days.
The U.K. is now in a holding pattern with Johnson pausing his Withdrawal Agreement Bill, which could still be scrapped altogether. This significantly reduces the chances that the U.K. will leave the EU on October 31, as the prime minister had vowed.
The immediate focus has now shifted from Westminster to Brussels. The other 27 countries need to decide if they will say yes to the U.K.’s request for an extension. The Brexit saga will apparently carry forward and continue to drive uncertainty for market participants.
Despite the Brexit headlines proving the undoing of market gains on Tuesday, there was some internal market strength that carried forward. The number of new highs on both the S&P 500 and NYSE grew on Tuesday, Apple producing one of those new highs of course. (Green bars/new highs)
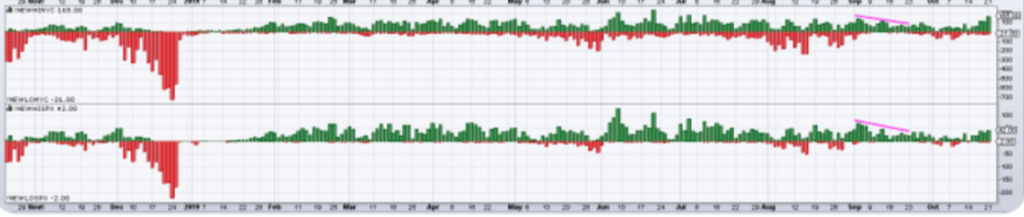
Is an expansion of new highs evidence of an upcoming recession? We would argue it is obviously not! And probably one of the most interesting charts we discovered on Tuesday really wasn’t a chart that identified technical strength or weakness, breadth improving or faltering, but rather the relationship between money flow and the S&P 500. As we’ve pointed out through 2019, fund flow data has shown a clear flight from equities and into bonds.
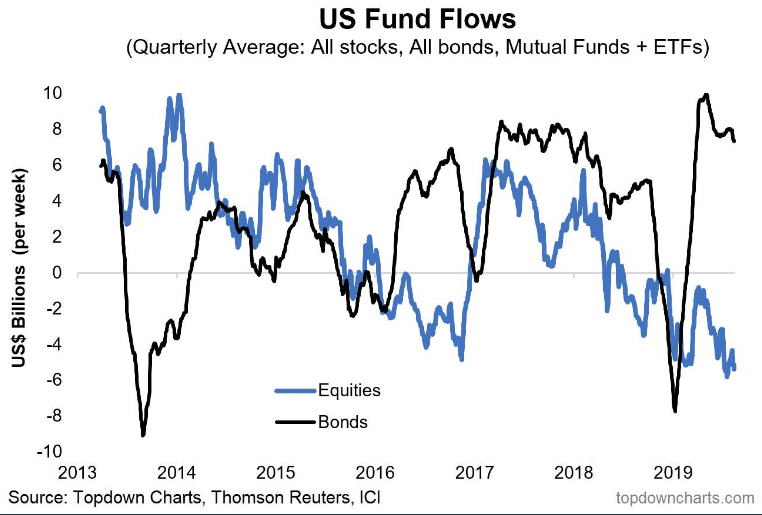
While there is no debating the asset class that has benefited from the great uncertainty around the global economy, the S&P 500 has managed to gain roughly 20% year-to-date. When we look at the money flow chart below, one likely wouldn’t draw this conclusion, which would otherwise beg of more information, to define where exactly the gains in the stock market are coming from. The S&P 500 represents the top chart and shows the divergence from money flows, the bottom chart.
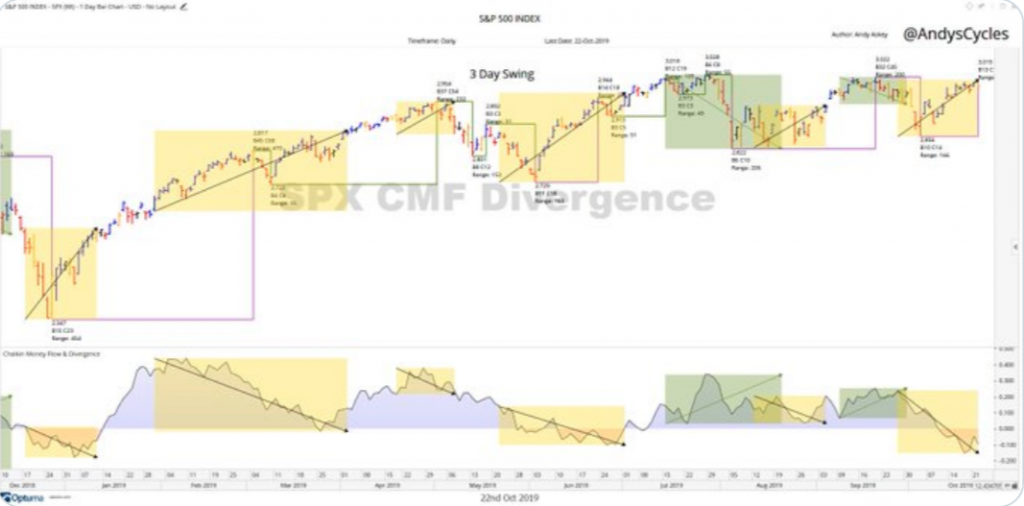
So who is buying stocks, if all we see are net outflows? What is missing here in the above charts is the calculation or representation of corporate buybacks. Since 2009, S&P 500 companies have bought back $5trn. of their own stock. This cumulative flow is more significant than mutual fund and/or ETF flows. This bull market cycle is about buybacks and forces investors to also recognize why volumes have been on the decline for the duration of the cycle as well. As Jim Bianco of Bianco Research would say, “Investor flows are a sideshow.”
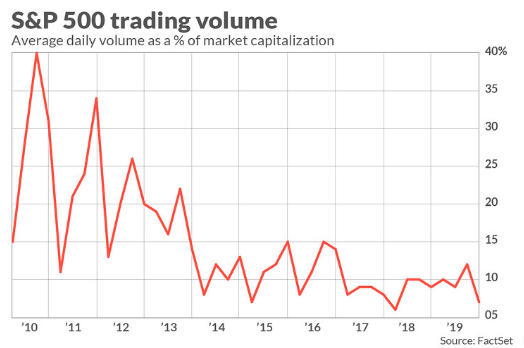
As mentioned above, the bull market cycle that is looking toward extending into 2020 is found for ever-declining volume. The lack of willing buyers has been replaced by stock buyback plans which more than eclipse the outflows. However, in the absence of natural buyers of equities, the problem arises during episodic market drawdowns. Some analysts fear dwindling volume could spell trouble for investors during the next selloff, setting equity investors up for a repeat of last year’s fourth-quarter swoon. Finom Group doesn’t see this outcome as being highly probable, given the differences in central bank activity on a YoY basis, as well as forward looking 12-month EPS expectations, just to name a two variables.
Average daily trading volume in the S&P 500 over the previous 90 days has fallen toward a 10-year low, declining to 7% of total market capitalization during the three months ended Oct. 19, versus 21% average volume between 2010 and 2013.
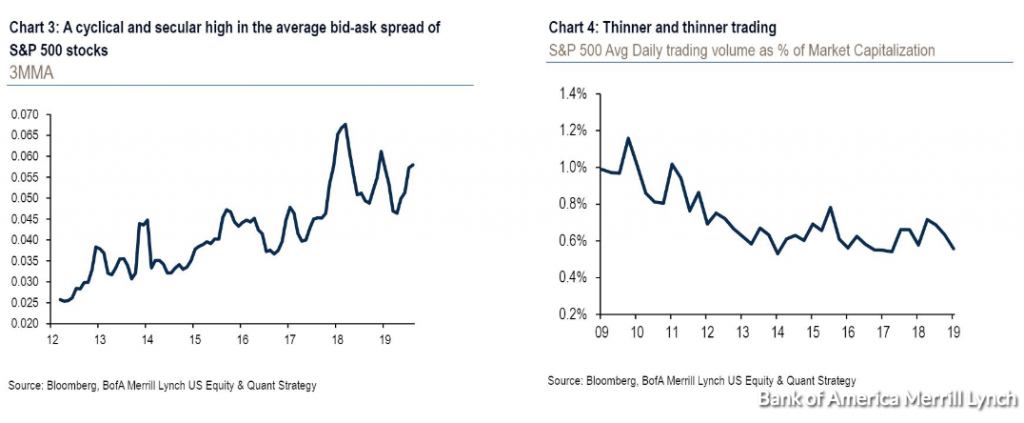
When the wall of worry turns to panic selling, we worry about an unlikely area of liquidity risk: the S&P 500, the equity benchmark perceived to be more liquid than most,” wrote Savita Subramanian equity and quant strategist at Bank of America, in a note to clients.
She argued that in recent years, trading volume for large cap U.S. stocks increasingly has been provided by “non-fundamental investors” including algorithmic investment funds, passive investment funds and high-frequency traders.
“Average trading volume for S&P 500 stocks has been falling for years. Banks no longer provide the same liquidity as [before the Great Financial Crisis]. The result is a bid-ask spread for the average S&P 500 stock that is close to a multi-year high.”
“At an asset owner level, pension funds’ exposure to private equity has risen demonstrably amid a reach for returns. But any disturbance to private markets (IPO friction, funding shocks via credit or rates) could force pensions to raise cash for distributions by selling the more liquid parts of their portfolios, namely public equities.
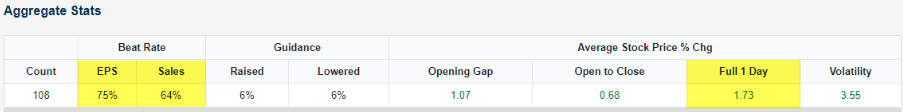
While market volume, Brexit headlines and U.S./China trade headlines are just a few of the blocks for which the market creates an ever present wall-of-worry for investors to climb over, earnings season is cresting this week. For the most part, earnings are coming in better than analysts’ estimates.
Having said that, we expect the recent breakout in the semi-conductor sector to come under significant pressure on Wednesday. The following chart from J.C. Parets identifies the “bullish” breakout of the semi-conductor ETF (SMH).
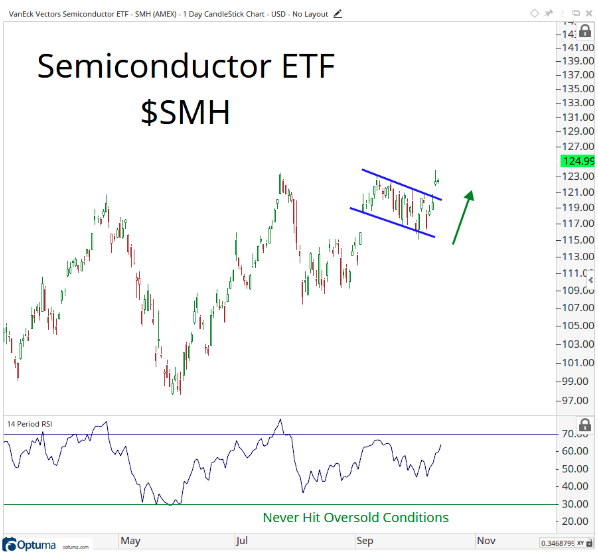
Alongside the chart identifying the breakout, Parets had the following to say regarding the seemingly bullish signal:
“I want to make something perfectly clear: Semiconductors breaking out of a 6 month base to new all-time highs is historically not a characteristic of a downtrend for semi’s, tech, or US Stocks as an asset class. These are facts. As go Chip stocks, so goes Tech. And in case you forgot, Technology is a quarter of the entire S&P500.”
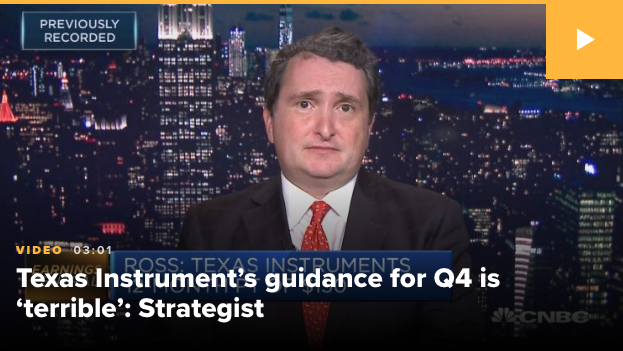
The breakout in the Semiconductors offered by Parets may prove a “false breakout” based on the latest earnings release from Texas Instruments (TXN). The semi-conductor sector is under significant pressure Wednesday morning after the tech giant released its Q3 2019 results and guidance.
Texas Instruments Inc. shares dropped 9.4% in the extended session Tuesday after the chip-maker’s outlook fell well beneath Wall Street estimates, and other chip-maker stocks took an after-hours hit.
The company said it expects fourth-quarter earnings of 91 cents to $1.09 a share on revenue of $3.07 billion to $3.33 billion, down from $3.72 billion in the fourth quarter of 2018. Analysts surveyed by FactSet expect $1.28 a share on revenue of $3.59 billion. Texas Instruments Chief Financial Officer Rafael Lizardi blamed the outlook on ongoing trade uncertainties with China and customers holding back purchases.
“Our sense is that customers are just far more cautious than they were certainly a year ago, but even 90 days ago, and many of them talk about the caution,” Lizardi said.
The company had previously warned that a slowdown in demand for microchips that started late last year may last a few more quarters, as China’s economy slows and manufacturers face the fallout of an ongoing trade dispute with the United States.
The company reported third-quarter net income of $1.43 billion, or $1.49 a share, compared with $1.57 billion, or $1.58 a share, in the year-ago period. Revenue declined to $3.77 billion from $4.26 billion in the year-ago quarter, marking the fourth quarter in a row of declining revenue. Analysts surveyed by FactSet had forecast earnings of $1.42 a share on revenue of $3.82 billion.
Stifel analyst Tore Svanberg said the forecast should not come as a surprise given the downward trend in Purchasing Managers’ Index numbers globally in the last few months.
Circling back to J.C. Parets displayed chart commentary, it’s clear that charts aren’t always right and technical analysis is not an exact science. For this reason, Parets offers this caveat:
“Very simply, these are the types of charts we want to be buying. We’ll be wrong sometimes, and sure Semi’s could peak today and begin to crash tomorrow. Anything can happen. But if we make this bet 100 times, we’re going to be winning an awful lot. Think of it this way: do we want to be betting against these charts? I say ‘No sir’.”
One sector does not make a market and what may prove the undoing of the recent rally in the semi-conductor sector certainly hasn’t proven the undoing of the financial sector stocks. After a robust earnings season, the financial sector has rallied and may prove to offset the weakness in the semi-conductor sector going forward and with the tech sector earnings kicking off this week as well.
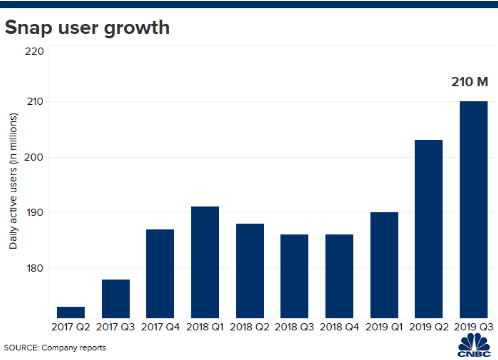
In addition to Texas Instruments earnings release after hours on Tuesday, Snapchat (SNAP) also released it’s results. The company posted a slimmer-than-expected loss for the third quarter while exceeding expectations for user growth and revenue.
- Loss per share: 4 cents vs. 5 cents forecast by Refinitiv
- Revenue: $446 million vs. $435.1 million forecast by Refinitiv
- Global daily active users (DAUs): 210 million vs. 207 million forecast by FactSet
- Average revenue per user: $2.12 vs. $2.10 forecast by FactSet
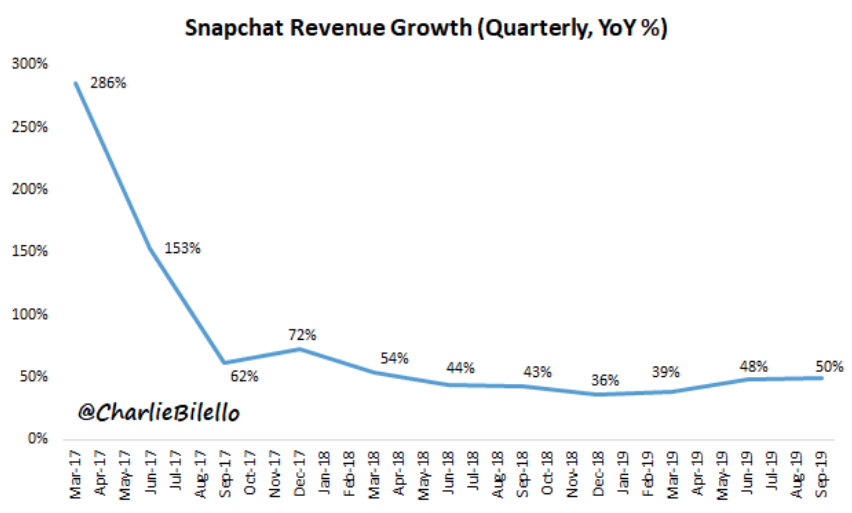
Snap said revenue in the fourth quarter is expected to be $540 million to $560 million, a disappointment relative to expected sales of $555.4 million, according to Refinitiv. At the midpoint of its guidance range, sales in the fourth quarter would climb 41% from a year earlier.
SNAP shares initially traded sharply lower upon the release of its results, but has reversed all its losses and is pointed higher in the pre-market trading session Wednesday.
Snap Chief Financial Officer Derek Andersen said the company gave a light forecast for the fourth quarter, because 2019 will include one less week between Black Friday and the end of the holiday shopping season, which is Snap’s peak demand period.
“The way the calendar falls this year there’s one fewer week of activity between those two holidays,” Andersen told analysts. “That’s a potential headwind for us, and the guide reflects that.”
Wednesday is a busy earnings day and the most visible and market moving report will likely come after the closing bell in the way of Microsoft’s (MSFT) earnings release.
Microsoft’s stock has performed well in recent years because its hybrid cloud strategy began to take hold in 2018, two years after the first technical preview in 2016, and this spurred faster growth than the market estimated.
Last quarter, Microsoft beat revenue expectations by $920 million and the consensus earnings per share (EPS) estimate by $0.16. The company exceeded expectations handily in the two quarters before that as well. The company’s fiscal fourth quarter was its best yet for commercial cloud, with revenue increasing 39% year-over-year. Azure had the strongest growth at 64%, followed by Dynamics 365 at 45% and Office 365 Commercial at 31%.

Analysts on average expect Microsoft to report earnings of $1.24 a share, according to FactSet, up from $1.14 a share in the fiscal first quarter a year ago. Microsoft is expected to report revenue of $32.15 billion, according to a FactSet survey of 32 analysts covering Microsoft, up from $29.08 billion a year ago.
Heading into the height of earnings season, Finom Group expected the trading week to be choppy, as mega-cap stocks would be reporting quarterly results. Here is what we offered to our subscribers in this weekend’s Research Report:
“Finom Group’s expectations for the coming trading week are muted. We anticipate some choppiness and would not be surprised to see a revisitation of 1% daily moves in the latter part of the trading week, should the VIX ascend.”
It’s pretty clear that with the surge in equities on Monday and slight pullback on Tuesday, choppiness is showing itself to be the shape of the trading week. But we also discussed one individual stock that would be reporting earnings this week and has reported prior to the market’s opening bell Wednesday. From our Research Report:
“The coming week could be a tricky one! Both Boeing and Caterpillar (CAT) are set to report alongside the previously mentioned companies. These mega-cap names aren’t likely to offer a good deal of positive commentary based on the evidence presented from a global slowdown. The chart of CAT alone gives investors enough “cause-to-pause”, as shown below:”
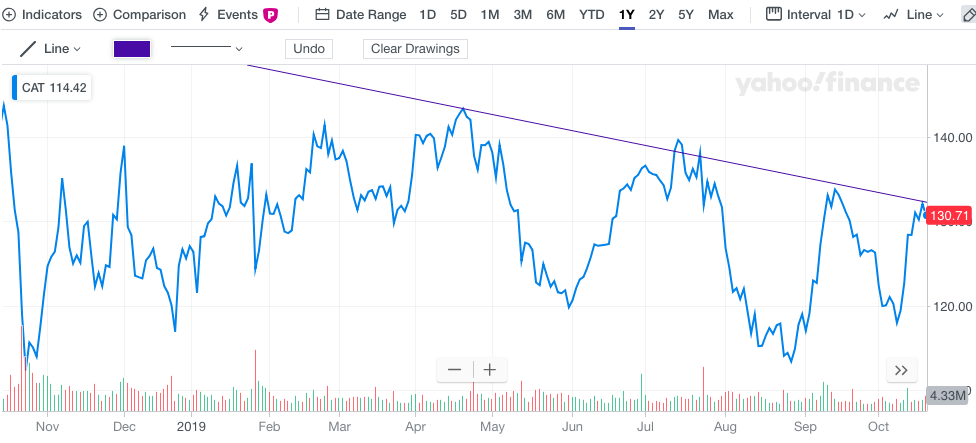
Shares of CAT are pointed lower after releasing Q3 results below consensus estimates and guiding lower for the Q4 2019 period. Turns out the lower highs were presenting a bearish pattern, and not toward a potential breakout. Caterpillar shares fell 5% after the company said it earned $2.66 per share in the third quarter, versus the consensus estimate of $2.88 per share, according to Refinitiv. Revenue came in at $12.758 billion, while Wall Street expected revenue of $13.572 billion. The heavy machinery manufacturer lowered its full-year earnings per share forecast to a range of $10.59 and $11.09, lower than the expected $11.70.
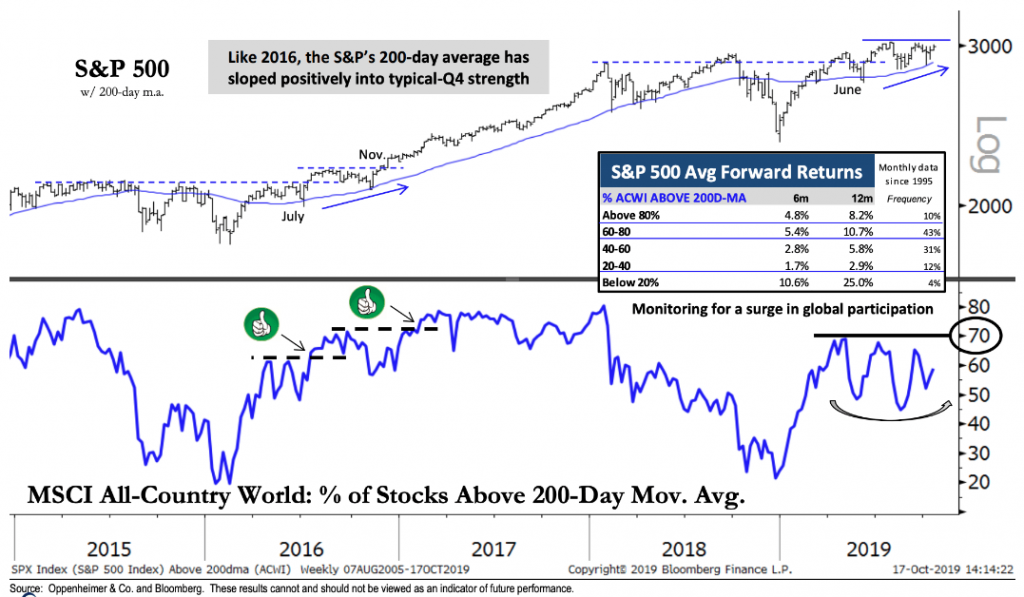
Prior to the peak of earnings season and the notable results to-date, Oppenheimer’s Ari Wald offered the following commentary. With the S&P 500 heading back towards its all-time highs this week and fears over the future outlook for the economy, it seemed there was a divergence between sentiment and global equities. (See chart included)
The S&P 500 has rallied toward a test of its July peak (3,028), and although timing the next leg higher remains challenging, we think this setup is slowly developing. We’ve discussed key positives like the lack of investor enthusiasm, stabilized interest rates, an oversold economy, as well as renewed seasonal tailwinds, and this week we focus on the improvement in global participation too. Currently, 59% of the stocks in MSCI All-Country World (ACWI) are trading above their 200-day average. Readings between 60-80% have been followed by above-average S&P returns over the next 6-12 months since 1995, and we’d ideally like to see a higher-high vs. May’s print (69%) similar to the action in 2016. We believe incremental improvement in Europe, E.M., and US small-caps are the pillars for this to occur.
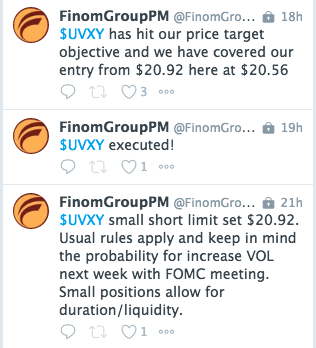
With certain mega-cap companies issuing disappointing results Wednesday morning, equity futures have moved modestly lower and the choppiness may continue ahead of eBay (EBAY), Microsoft, PayPal (PYPL) and Tesla (TSLA) quarterly reports, due out after the closing bell Wednesday. Having said that, we see some opportunities developing in the market that may demand active trading, whereby most trading volume is coming from the passive investing paradigm. Finom Group’s trade of the day for our Premium Members is shown in the screen shoot below. Subscribe today and trade with us. our YTD hit rate on over 200 trade alerts issued is 99% with still yet another 2.5 months worth of trading left in the calendar year.