
Welcome to our Finom Group September Monthly Macro-Market Recap
September 2025 MONTHLY MACRO-MARKET QUANT RECAP
THE MOST HATED V-SHAPED RALLY: MARKET STRUCTURE, CYCLES & THE QUANT TIGHTROPE
September, notorious for its volatility and bearish lore, instead delivered yet another display of broad resilience and underlying macro strength. Contrary to pundits and headline fear, economic growth continued to surprise—with Finom Group’s long-standing no-recession call again borne out despite Q1’s “growth scare” and every new round of exogenous policy risk. With tariff realignments and labor disruptions receding, businesses adapted, consumption rebounded, and jobless claims trended toward new lows by month-end. In short: this cycle’s adaptability and productivity remain underappreciated by the consensus.
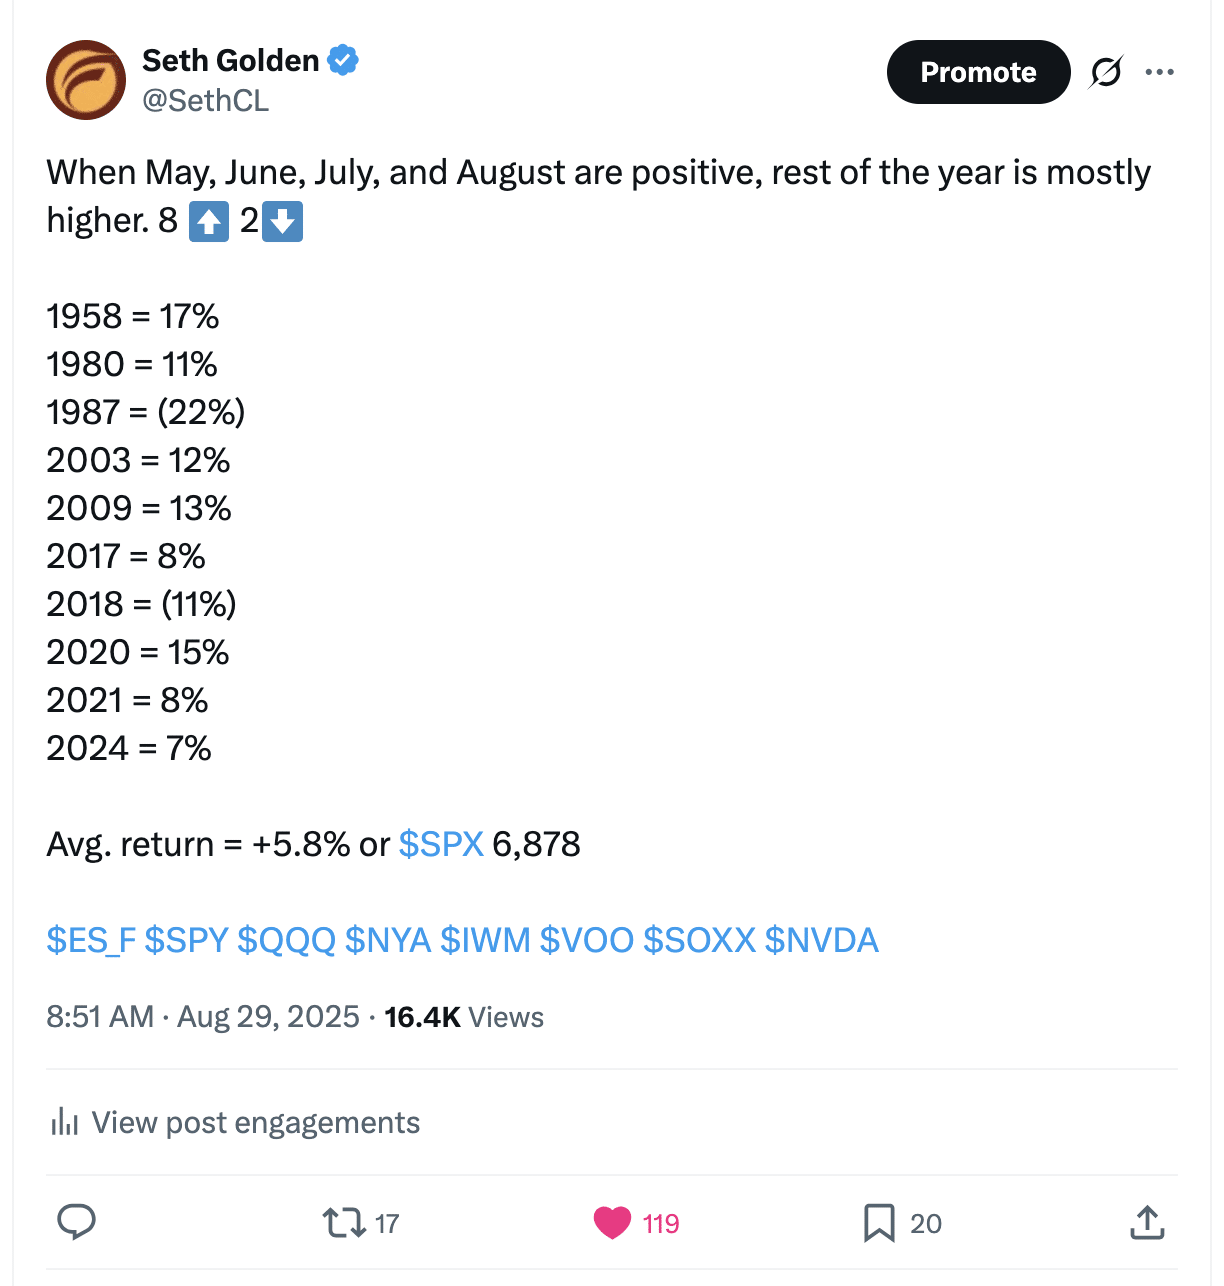
Beneath the headlines, technicals and breadth told the real story. The S&P 500 notched a nearly +4% September—rare for what’s typically the worst calendar month—carrying its win streak to 5 months and marking repeated all-time highs confirmed by the NYSE Advance/Decline Line. Quants unveiled in this month’s report show a dramatic shift: positive returns in both the first 9 sessions and September at large historically signal not just year-end strength but a high probability of bullish follow-through into Q4. Even the government shutdown posturing and mid-month pullback only reinforced the “buy ANY dips” narrative, as leadership in Growth, Tech, and Semis persisted and relative breadth, though softening, remained the backbone of the move.
But this is not a time for complacency: our review of rolling quants (from Wayne Whaley to Optuma and Bluekurtic) highlights the importance of context and patience. Stretches above the 50-DMA and overbought RSI are textbook signals for consolidation, and the data show that when corrections do come, executing “aggressive discipline”, per Brad Carter, matters far more than prediction. If and when a deeper pullback emerges, it will set up new added opportunities—not a reason for panic, as every quant points toward robust probability of new highs and above-average returns by year-end, especially with earnings and bottom-up targets moving higher into Q4.
To stay ahead, investors must recognize what’s changed: this market is structurally stronger, less levered, and more broadly led than previous cycles—even amid high headline multiples and valuation anxiety. Technical “false breakdowns,” the durability of the April/July breadth thrusts, and the persistent underperformance of the bears this year all argue forcefully for process over forecasting.
As the curtains fall on September:
– Follow the quants. Seasonals matter, but context and adaptive planning trump (no pun intended 😂) rote history.
– Focus more on leadership, ETFs, and broad index exposure over single-stock bets as breadth shifts.
– Don’t get shaken out by volatility or the next macro headline. Structural bull markets reward discipline and rebalancing; fear and FOMO never outperform process.
Lastly, it’s Q4 and the savvy investors are always considering the year to come, playing Chess not Checkers. This is that part of the year that our chief equity strategist (Seth Golden) reinforces the portfolio rebalancing discipline and exercise of planning and positioning for a 2026 Outlook. What are your early expectations and is your portfolio “gearing up” for 2026? If not, you’ve got work to do, from my lips to….
This recap synthesizes actionable insights and Finom Group’s ongoing analysis, connecting every price action and signal to our published research so readers can judge forecasts versus reality. Use it as both roadmap and checkpoint. Whether seasoned or new to these pages, let this guide clarify market truths, reset expectations, and keep your playbook sharp for the road ahead—because as history shows, markets reward those who adapt, not those who flinch.
Dig into the research sections that follow. September offered the risks, the volatility, and, for disciplined hands, another set of unique opportunities.
Direct quote from Finom Group’s “A Soft Patch To Land The Economy″ Report (September 7th, 2025)
The negative consequences of fiscal policy have been seeping into the macroeconomic data for several months and since Liberation Day. While tax legislation (OBBBA) is set to provide a tailwind for economic growth, trade and immigration policies have demonstrated a greater and more immediate impact on the U.S. economy. There has been a rather broad softening of economic conditions of the last 4 months or so, and that softening may ultimately bring about a “growth scare” of sorts. A growth scare is not a recession, but can and has in the past proven a breeding ground for recessions if fiscal or monetary policy response isn’t expedient or efficient. In other words, sometimes it takes a growth scare to wake up “the powers that be.”
With equity markets at all-time highs, it can become difficult to appropriately manage through a growth scare or even a pending recession should a recession come to pass (still not our base case outlook). The difficulty usually encompasses the near-term equity market prospects, which would otherwise dim. It’s with this understanding that many investors have and will act irrationally and disadvantage their own long-term investing objectives for the sake of potentially negative price action. With headlines blaring poor economic conditions and pervading investor psychology, such stimuli will often find even the most hardened of investors fashioning a game plan to LIMIT DOWNSIDE through a variety of hedging exercises and/or outright selling equities. While such actions may seem or even prove smart under the guise of downside price action, the more difficult part of this process would be to know when to “get back in” the market. As such, it’s not just the exercise of making 1 smart decision, but 2 smart decisions and decisions with precision else opportunity costs will compound, as they almost always do. Buy and Hold is the top rated investing strategy because it bears NO opportunity costs and outperforms all other strategies that deviate.
None of the aforementioned monologue is to outline some bearish or fearful commentary on the state of the macro-market environment, but rather to reinforce discipline and recognize that regardless of the near-term economic prospects, market outcomes can be more diverse than many care to consider. Negative economic conditions don’t always equate to negative stock market outcomes at the same time. In fact, 2025’s technical bear market for the S&P 500 (SPX) and official bear market for the Nasdaq (COMPQ) may have long since priced a growth scare or recession. Don’t let the rapidity for which the markets soon after recovered dismiss the reality of those bearish market conditions. It happened! What didn’t happen was a slow down or decline in earnings per share. That may very well have proven the growth scare price action in Q1/April 2025, recognizing that economic conditions would soften after Liberation Day, but not where or to the extent that would prove to upend corporate earnings growth. And so here we are in September with the softer economic conditions and having ended Q2 2025 earnings seasons with strong earnings and strong guidance. I want to point out that despite tariffs and immigration policies, some of the worst retailers over the past 20 years have reported quarterly beats and even raised their guidance for 2025 (Macy’s and Kohl’s). I would not have thought such an outcome would materialize back on April 2, 2025, but here we are in September 2025… outcomes can be more diverse than many care to consider, especially in the face of hardship and negative headlines.

“So here’s a helpful reminder depicted in the graphic above, which identifies that S&P 500 returns during different GDP environments: Since WWII, negative GDP (recessions) have delivered absolute best forward stock market returns on average.
1945 returned +30%
1954 returned +45%
1961 returned +23%
1970 returned +1%
1980 returned +25%
2020 returned +16%
Not all recessions are created equally!”
Historically there’s very little to inform when or where the market will precisely price economic conditions into the future. Our default, therefore, is what we just heard from corporations speaking to higher profit margins, greater revenues, and increasing earnings. We use this information, as investors, to respond to equity price weakness appropriately. While fear was accelerating and prices were declining from February 19th to April 8th, we were buyers of cheaper prices and regardless of the economic concerns fueled by fiscal policies. Cheaper prices are cheaper prices! Buy low… wait… and sell higher. When higher prices come is not a matter of if, but when!
The below excerpt from Finom Group’s May 4, 2025 macro-market Research Report evidenced the behavior we encouraged investors to employ throughout what would be a technical bear market.
“… the rendering of a game plan below is that of how the average investor/trader could have benefited from the current correction/bear market.
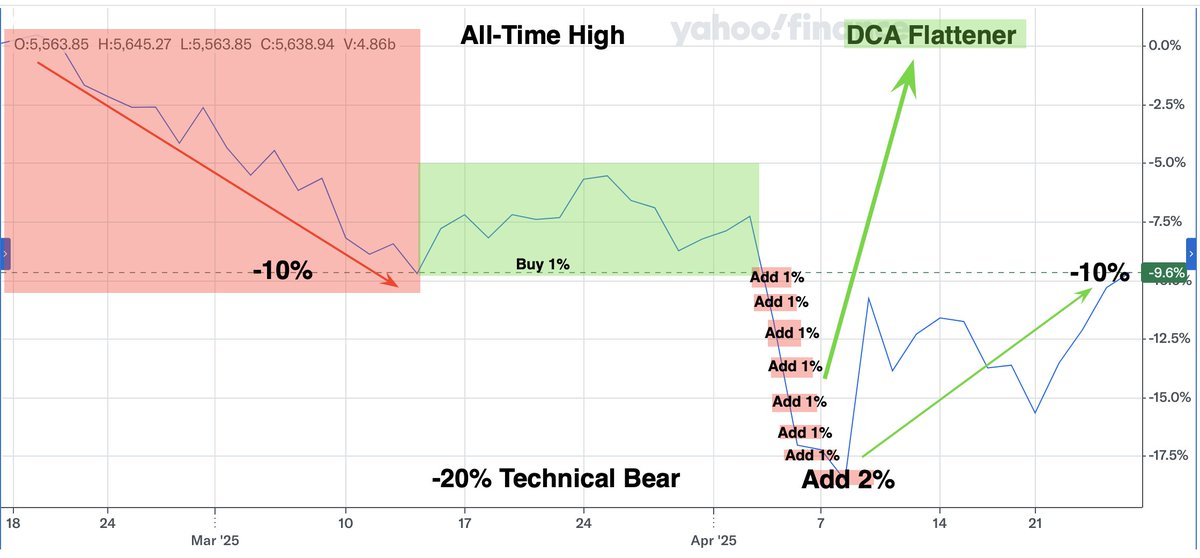
Speaking to an index ETF portfolio only (which we understand is not the typical portfolio), had you bought +1% for each -1% downside in the technical bear market, an index ETF portfolio would be up
+4% since the former ATH while the S&P 500 remained -10% from the former ATH and down -3.3% YTD (+2% add at bear market, chart and annotations from 8/28/2025). This dollar-cost-averaging exercise would have helped the average investor/trader outperform the market, get back to even quicker than the market, and now finds the index ETF portfolio with gains on the year. Additionally, this dollar-cost-averaging exercise is why I (Seth Golden) often suggest there is no such thing as a bad market, only lost opportunity. It’s the lost opportunity that investors often accrue and compound, with great misfortune. DON’T find yourself amongst this herd of sheep
!”
After reading or re-reading this excerpt from May, ask yourself if the macro-economic conditions have improved or the rhetoric surrounding economic conditions would lend optimism, encouraging you to buy stocks or any risk assets. If the answer to the question is NO, that is why selling equities based on fear or economic conditions softening/weakening is bad idea. Holding stocks, weathering the storm is always the better action taken. It didn’t feel that way in April and it won’t feel that way in the future, but discomfort is part of investing and usually a signal you’re doing something right.

Holding existing long-term positions and adding more equity exposure through the technical bear market proved a rewarding 2025 game plan. Buying any dip, as we’ve encouraged investors/traders to do so for the last few months, has also proven rewarding. While our outlook through year-end calls for higher prices, investors will need to prove more discerning with respect to “what they buy and choose to hold” through any upcoming macro-market turbulence.
Despite the higher prices already achieved in the usually dreadful month of September, we downplay complacency and elevate diligence. In the Golden Capital Portfolio we are not going to shy away from any downside pricing pressure due to macro-economic conditions or concerns. This statement in and of itself is why we are not found in the financial media and Seth Golden has shied away from such television appearances, as the statement sounds… dumb, but is factually the best approach. At worst, we view softening in the economy as temporary, but admittedly fail to have the ability to measure with precision the duration of the softening cycle and largely due to the inconsistent fiscal policy implementation/s. With this in mind, we reconsider and reiterate a belief that the White House administration does not desire to produce a recession ahead of, or during, a Midterm Election year. We believe this is also a widely held investor class belief, expressed through stock market price action, a variety of breadth thrusts, and price achievements since April 2025.

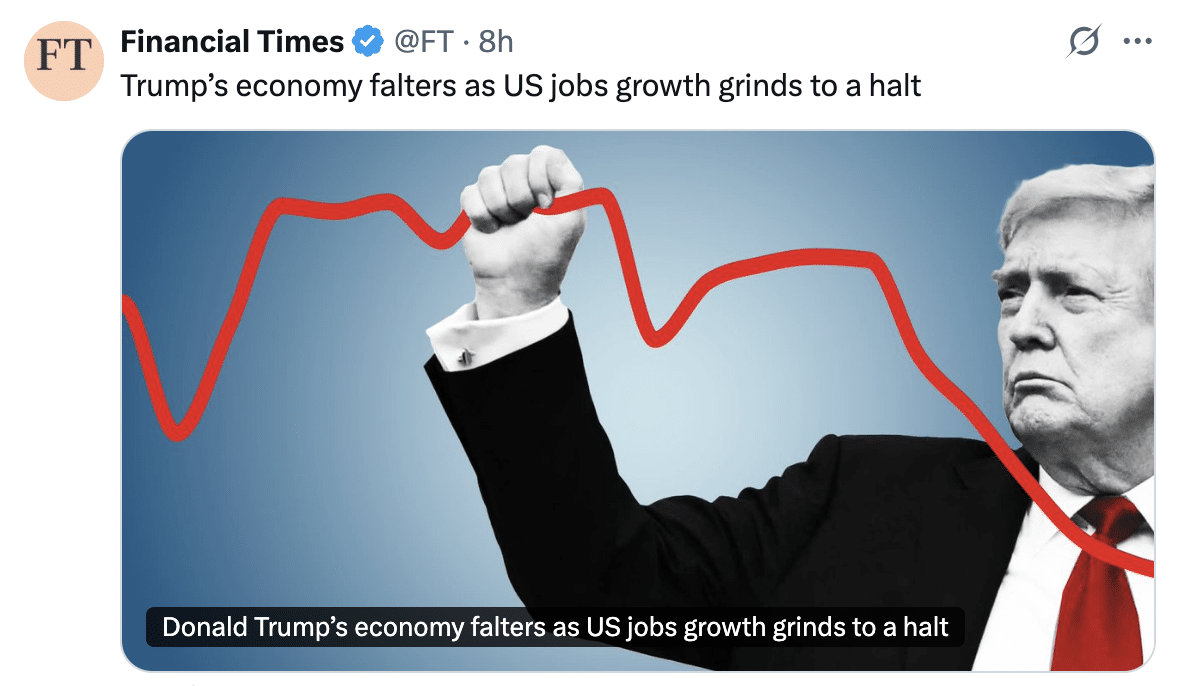
I doubt very much that the White House administration desires to see these headlines worsen in the coming months, even if they may do so in the coming weeks and with more inflation data set to be released. As such, please be reminded of the following:
“While the shine comes off the Zweig Breadth Thrust given distance in price from the signal date/price as of the present day, we can’t overlook another fact of the Zweig Breadth Thrust which also lends to the macroeconomic outlook.

Unfortunately, when the financial media megaphones a negative/pessimistic narrative, investors allow such narratives to pervade greater, more historically accurate data. Referencing the Zweig Breadth Thrust quant study above:
The fact that markets express technical bear markets and not just recessionary bear markets allows the macro-tourists to lay claim to the old adage “markets have priced 9 of the last 4 recessions.” The problem with this type of attack on forward discounting markets and the accuracy of that pricing mechanism is that it DOES NOT work in the opposite direction, i.e. when markets price out continued economic expansion as opposed to recession. In this forward discounting operation, the market has NEVER BEEN wrong. If it has priced forward a 12-month economic expansion, and in post-WWII era, it has been right EVERY. SINGLE. TIME. (Zweig Breadth Thrust (ZBT)) With that, I have a saying that has also proven 100% accurate: “Everyone has access to the economic data, but not everyone can sequence and weigh the data properly and with respect to delivering an effective outlook. Sequencing/weighing is the upmost priority.”
Direct quote from Finom Group’s “A Soft Patch To Land The Economy″ Report (September 7th, 2025)
The average S&P 500 return, after a long pause in monetary policy that precedes another cutting cycle, is still mostly positive and as evidenced in the chart below. If the cutting cycle proves more rapid and we are seeing 50bp to 75bp cuts at subsequent FOMC meetings, the Fed is likely responding to the fear of a recession, and equity markets will likely be rapidly repricing risk. Speed denotes uncertainty for the masses, but you’ll know what to look for either way.

A quick word on the market cycle and price action in early September before outlining the trending economic conditions evidenced in this past week’s economic data releases.
“…the Cycle Composite is but an average performance path. Additionally, the S&P 500 has strayed from the path throughout the Q1 and early Q2 period. The magnitude of the outperformance in Q1, then sudden underperformance in April, now the outperformance once again, however, is what proves most informative. Bottom line and simply put; the S&P 500 does not seem to hold fast to the Cycle Composite path in 2025, so the savvy investor may only find utility in it as a reference point in hindsight, but not with respect to future expectations. In truth, this is a new consideration that I’m coming to accept for the Cycle Composite in this particular calendar year. It may not prove the case in 2026, but the S&P 500’s adherence to the Cycle Composite in 2025 is just not terribly strong more than halfway through the calendar year.
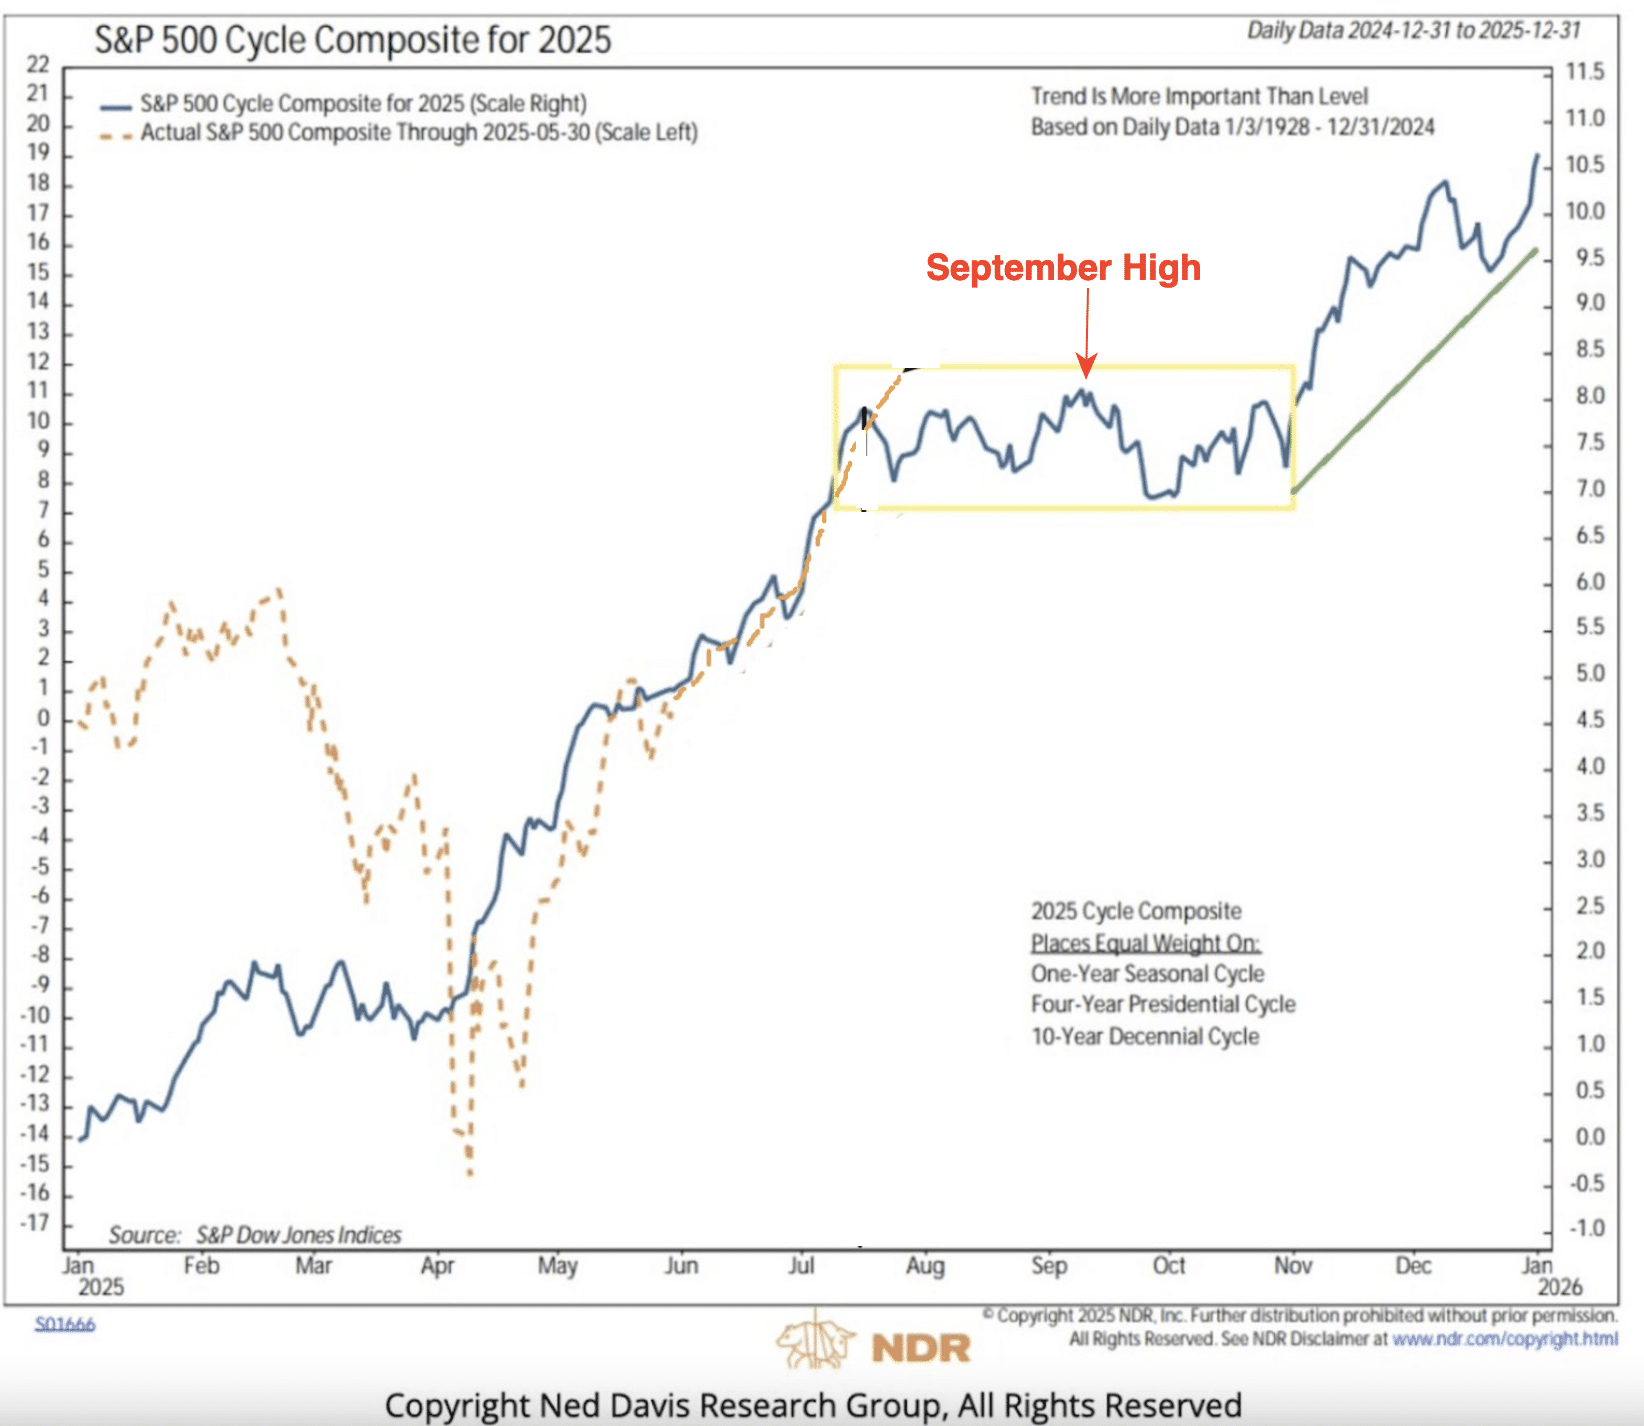
Despite the understandings about poor September returns, indeed, the Cycle Composite evidences the average intra-year new high during the month of September (which has occurred) and before additional downside besets investors/traders. Admittedly, the Cycle Composite has been on again-off again in 2026, but we still keep it handy, as a guide but not a guarantee. If it is on again and downside lay just ahead for the S&P 500, we are ready to buy-the-dip ✅.
Direct quote from Finom Group’s “A Soft Patch To Land The Economy″ Report (September 7th, 2025)
Overall, we can recognize that since the 2025 introduction of fiscal policies, economic conditions have softened, but remain largely in expansion territory. The consumer-centric data remains healthy, if not robust, by way of Bank of America Card Spending, Redbook retail sales and Chase Card Tracker (all shown below). So while the masses are so focused on absolute job growth and the level of Unemployment rate, the consumer economy also validates a labor market that is in balance.


Current economic trends may warrant a recession watch if labor market data does not improve in the next 2 monthly reporting cycles, but we think there is enough political incentive for the White House administration to soften its policy/ies stance over that time period. Where there is a will there is a way, even a way to reintroduce migrant labor participation responsibly and with appeal to “the base.” As such, our base case remains with an outlook for the expansion cycle to carry through year-end 2025, at least. We have seen these “soft patches” in the economy many times during the post-GFC expansion cycle and even the 1990s Dotcom economic cycle, akin to the Dotcom cycle in fact (chart via Dario Perkins).
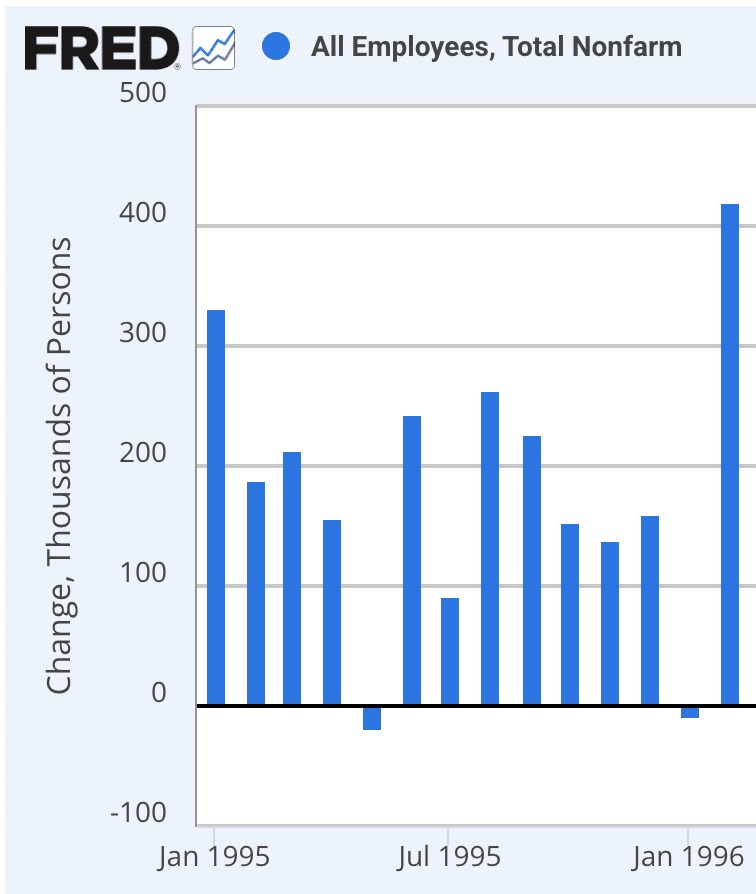
The chart below depicts monthly payroll growth ahead of the first rate cut in 1995, when payroll growth turned negative. We may still see such a likeness in 2025, but history informs that indeed an economic expansion cycle has soft patches, even negative payroll growth results periodically, and yet the expansion cycle survives… even thrives!

Unfortunately, while Perkins believes in this type of job growth analogue, there is little likeness today. Let me explain with the following chart and employment data, from 1995. Unfortunately, negative job prints without a recession are not terribly frequent. In 1997 it happened, but the prior month delivered +298K jobs and the following month was nearly +500k. In 1993, 1995, and 1996; all one-offs in the midst of a very strong job creation regime. That’s simply not the case today, as the surrounding months are “soft” with only +19k and +79k jobs created, encompassing the -13K job losses from June.
With this in mind, we can’t dismiss out-of-hand that soft jobs growth can lead to soft consumption, and fulfill recessionary conditions. Again, this is not our base case, but we remain openminded.
It may be hard to envision today, and with the noise of a decelerating economic backdrop blaring through the financial media, but if we think about it more deeply and akin to why we bought the bear market, what can go wrong may be going wrong in the economy, NOW. That, in and of itself, can only lend to the next outcome; what can go right? If the negative June payroll report (revised to negative) is even near the worst of the decelerating economic conditions, from here we may just need a little more time before the tailwinds from 2025’s tax legislation work through the economy alongside a better understood tariff landscape, lower rates, ongoing AI CAPEX spend, and deregulation. And…, the Fed has seemingly also accepted tariff reflation as temporary or transitory.
Direct quote from Finom Group’s “A Soft Patch To Land The Economy″ Report (September 7th, 2025)
September’s Worst Week Quant
From here, the quant data gets more competitive and may demand some deeper consideration that still does not deliver forward certainty. So first, some good news, but the good news does not provide anything definitive:
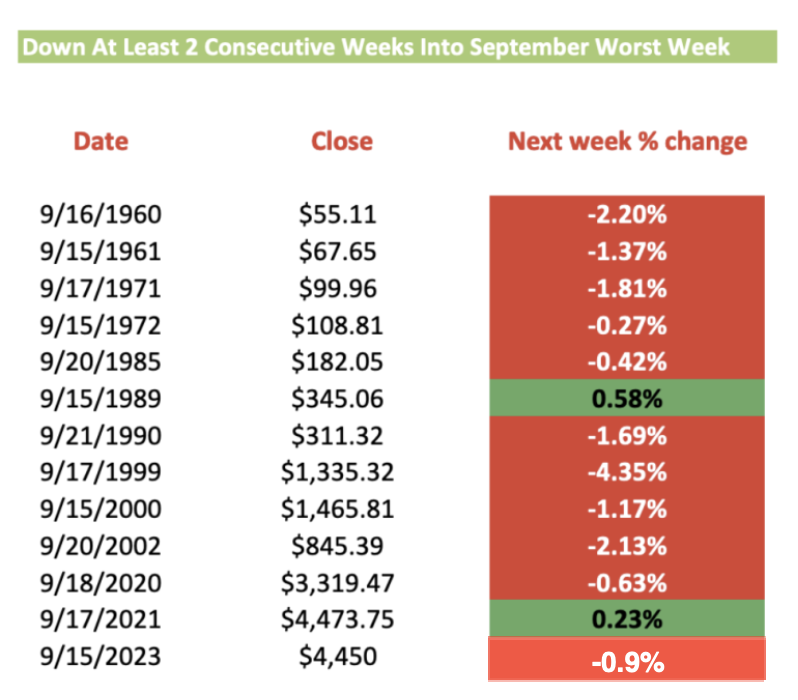
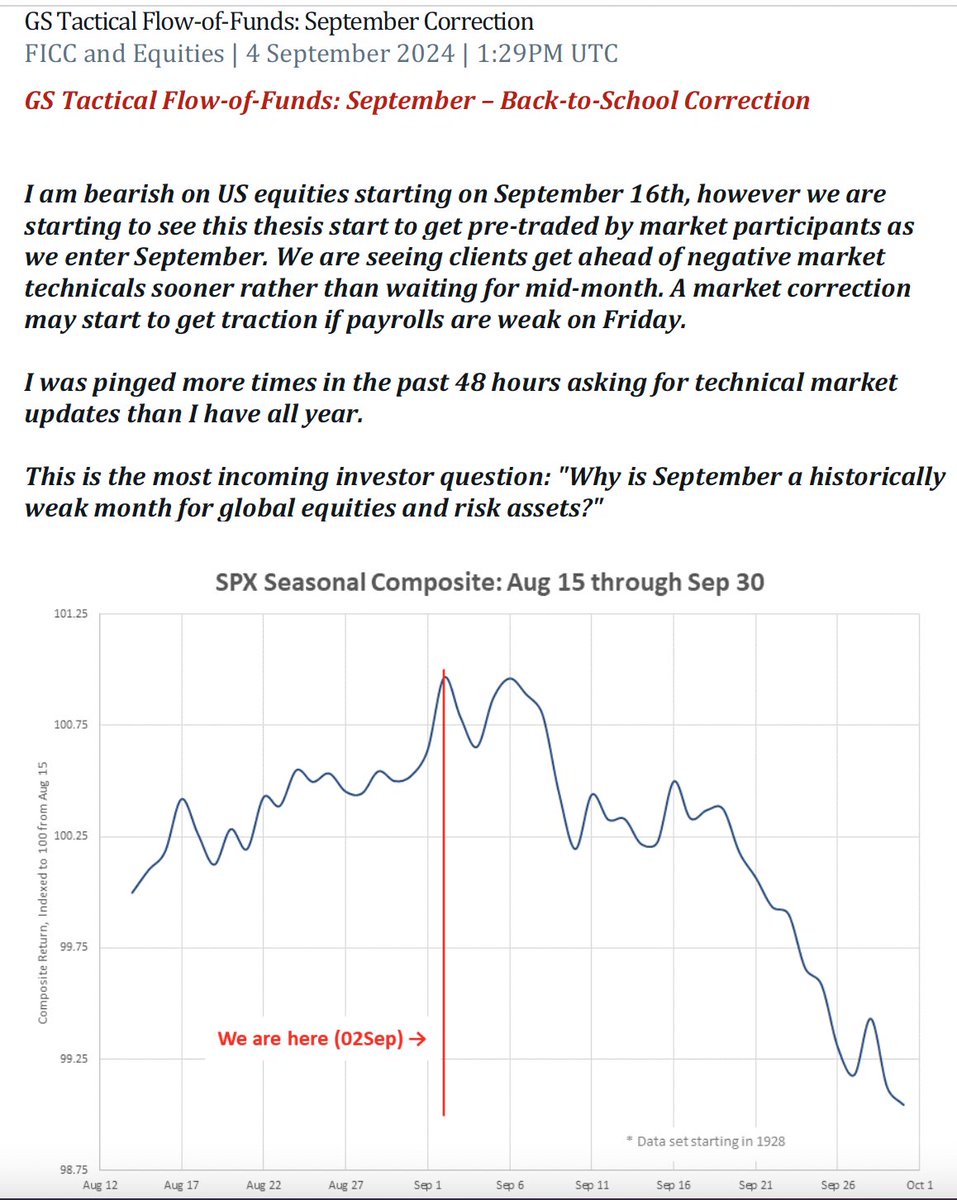
It was a net positive to finish this past week with a weekly gain… duh? The table above is a study that we have tracked and trained our investing process to recognize why September has often provided negative returns. As the quantitative study informs, when the S&P 500 has delivered at least 2 consecutive weekly declines heading into the WORST WEEK of September (usually monthly Op/EX), the WORST WEEK also delivers a negative weekly return more often than not, way more often than not. With this understanding and this past week’s positive weekly performance, it’s not possible to have 2 consecutive down weeks heading into the Worst Week. While this doesn’t guarantee an outcome, it tilts favorably bullish. As such, we can be less pessimistic about the 2H September period, but not overly optimistic. By the way, this was the case in 2024, whereby the S&P 500 avoided consecutive down weeks in 1H September, and the whole of the month delivered a positive return. Recall the following from inside our September 2024 macro-market Research Report whereby Goldman Sach’s head of trading (Scott Rubner, now with Citadel) flows went “bearish” on equities:
This is why we follow the quants/data, and why savvy investors don’t solely rely on “seasonality.”
Direct quote from Finom Group’s “September’s Op/EX And The Worst Week Of The Year Await Investors″ Report (September 14th, 2025)
This past week proved another seasonally defying week of the September calendar month for which we often suggest, “When the market does something it historically has not, there is likely a message Mr. Market is sending to investors/traders.” Our job is to follow a game plan and be open to a wide variety of outcomes.
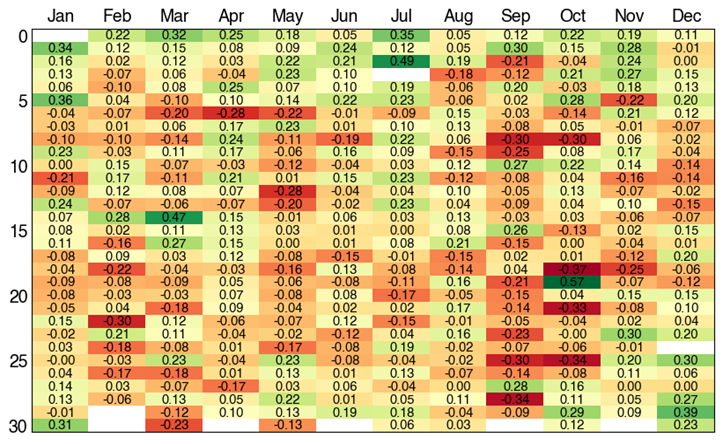
- September’s Op/EX week is the worst of any month, as evidenced in the chart of daily returns by month:
Look, the month has gotten off to an unexpectedly and defiantly strong start, given historic fund flows data that mirrors September’s worst monthly returns for the major averages. As such, a pullback during monthly Op/EX week would not be unusual and more than likely welcomed by a wide swath of investors/traders. Be ready to pounce if the pullback presents itself, as over-extended conditions are present in both the S&P 500 and Nasdaq 100. I wouldn’t find myself deviating from a game plan by price action or any upcoming threats of a government shutdown. If these are your concerns and greater fear, then do it afraid anyway. Let your concerns be reflected in the position sizes you buy, but I would be buying indeed.
Direct quote from Finom Group’s “September’s Op/EX And The Worst Week Of The Year Await Investors″ Report (September 14th, 2025)
Finom Group In Review
As far as predicting what the markets are going to do next, we generally leave that up to the quants, which are better at informing of the higher probability outcomes for markets. Recall the following Wayne Whaley quant, which spoke to the high probability of higher prices from August 19 – September 1, 2025:

Indeed, on August 18th, the day before the start of the forward time period, S&P 500 closed at 6,449. It traveled as high as 6,501 (closing basis) before settling the month of August at 6,460. While narrowly above the August 18th value, the positivity rate will now improve to 10-1 and having rewarded savvy investors who bought any price below 6,449 over the last couple of weeks (low closing value 6,370). In look at the next setup period from the quant above, it doesn’t speak well for much of September and into the first couple of trading weeks in October, but that specific time period relents to more favorable returns in the October 26 – November 2nd time period.
We also have a “price trend quant” that countered the Presidential cycle quant, from Wayne Whaley:

The quant reads and offers the following:
“You may recall that the S&P experienced an 18.9% selloff from the Feb 19th Close of 6144.15 to the April 8th Close of 4982.77, exceeding 20% if measured vs the April 8th intraday Low of 4910.42. From that 4982.77 Closing Low on April 8th, the S&P 500 has now advanced 26.0%, doing so in less than a Quarter, 86 calendar day (April 8-July 3) to be precise. Looking back through post 1950 history, I can only find five prior occasions in which the S&P 500 has advanced 25% in less than a Quarter and none of those five occasions were anywhere near an impending top. Certainly, one would prefer to have more than five data points from which to draw conclusions upon which to base one’s market exposure but the magnitude and uniformity of the advances across the following 12 months in those five cases appears worthy of our respect. All five cases were positive over the following 1 to 12 months, up at least +19.2% one year later, +31.7% on average. None of the five cases experienced a –4% drawdown as measured from the signal Date.”
Through Whaley’s quant, shallow pullbacks and higher-highs are the greatest probability. Indeed, the sample size is small, but not when paired with the former quant the build the bullish case both near and interim-term. Last, but not least, with some updated commentary as follows…
Since the quant triggered on July 3rd, the 2-month forward positivity rate is 100%, and considering August Republican Post-Election has never delivered a positive return, these 2 quants have a bit of a conflict and both are small sample sizes please at 6 and 4 samples respectively. 6,279 is the signal/date price. I’m of the opinion that if the White House Administration doesn’t lend endogenous headlines for the market to consider, the Whaley quant and price trend will overpower the August Post-Election quant performance.
Direct quote from Finom Group’s “September’s Op/EX And The Worst Week Of The Year Await Investors″ Report (September 14th, 2025)
Equally important to point out or consider, is that when markets perform outside of the baseline expectations, as they have done at certain points during the recovery period and to-date, be flexible with your approach to data signaling a pullback even one’s that seem all but certain. It’s for this reason that I have previously urged investors to be willing to buy even the slightest of pullbacks in Q2 and now Q3.
Moreover, the VIX had fallen for 4 straight months to end August. This is a rare streak, but also confirms our reasons to buy any dips henceforth, and as outlined in the following study from Subu Trade:

I’m not terribly concerned with the near-term and when reviewing VIX quant data, but the longer-term probabilities are even more compelling than the near-term, which are still quite positive. The S&P 500 positivity rate 2 weeks forward speaks to limited downside potential through mid-September and leading up to the September 17th FOMC rate announcement/meeting. With a 2-week forward positivity rate of 91%, it will prove difficult to not buy the dip in the coming weeks. Having said that, there’s a lot of green in the table and the forward 9-month positivity rate of 100% informs investors that should any near-term probabilities fail to achieve their higher probability outcome, simply wait longer. The S&P 500 signal date/price… 6,501! Don’t be afraid  of a little increase in volatility ahead, embrace it and compound returns by year-end if not by May of 2026.
Direct quote from Finom Group’s “September’s Op/EX And The Worst Week Of The Year Await Investors″ Report (September 14th, 2025)
I’m of the opinion the significant strength expressed in the Russell 2000 since the April lows and through August, validates owning the cap-tier index ETF (IWM/TNA). *Update: A growth scare diminishes the opportunity for small-caps to outperform, hence I will be looking to sell into any strength (not advice). The quantitative study from Bespoke Investment Group also lends positively to the small-cap outlook:

There are those whom believe the markets have come too far too fast, and the already lacking of a more significant pullback is a calling-card for a market crash. We have no data to support such considerations, and recognize that with the S&P 500 gaining some +25% in the last 100 days it has never delivered a negative return 3-months forward… NEVER  .
.

While the macro-economic landscape can find narratives that are both bullish and bearish, the quantitative and technical analytics deliver the same bullish message to investors/traders.
Updated Thoughts:
The markets have moved into over-extended territory on a time and price basis given their distance from their respective 50-DMA, and closing above Upper Bollinger Bands. Rarely, do markets not pullback/correct from such over-extended conditions. As such and regardless of this coming weeks headlines and/or data releases, a pullback would prove healthy given market conditions. Certain Growth vs Value performance ratios (QQQ:SPY, SMH:SPY and XLK:SPY) have been consolidating since August, leaving non-confirmation signals of leadership that might be foreshadowing a likely pullback near-term. The fact that Growth-y areas of the market aren’t leading as the indices achieve new all-time highs and with extremely robust earnings performance, suggests that there is little active fund flow left to satisfy further upside without some degree of a pullback, even if only a percent or two, as has been the case since May. Making it more bullishly difficult for the pessimists, economically sensitive Equal-Weight Consumer Discretionary is at al-time highs on both an absolute basis and relative basis (Compared to Equal-Weight Consumer Staples). For all of the concerns floated about the economy over the past several months, such an economically sensitive area of the market is not validating these concerns in any way. Can price action be this wrong. Yes, but it would be unusual!
The economic backdrop and landscape continues to soften, putting emphasis on this coming week’s economic data releases. The jobs picture is one of softening, but also quite murky and nuanced for understanding better. With that being said, the uncertainty around the labor market might find near-term relief if the Fed offers something greater by way of a rate cutting cycle as opposed to a rate cut that doesn’t lend to future cuts. Thus far and regardless of the softening labor market, retail sales have been surprisingly strong, and at worst steady to-date. We anticipate a continued strong retail sales dissemination from the Census Bureau this coming week, as high frequency retail sales data from Redbook has remained strong in conjunction with BofA card spending data. As a culminating opinion on the broader economy, I would suggest we’ve entered a soft patch that could prove a “Growth Scare.” The policies set forth by the White House Administration have yet to soften, and can be directly traced to the start of the softening labor market conditions as well as reflating of prices. There is still time for policy to soften and/or prove more growth-y, but until then I continue to lean into corporate guidance, which is proving that any economic slowdown isn’t impacting the greatest portion of consumer spending, directly flowing to corporate earnings growth in Q3 and Q4 2025. ~ Seth Golden
Direct quote from Finom Group’s “September’s Op/EX And The Worst Week Of The Year Await Investors″ Report (September 14th, 2025)
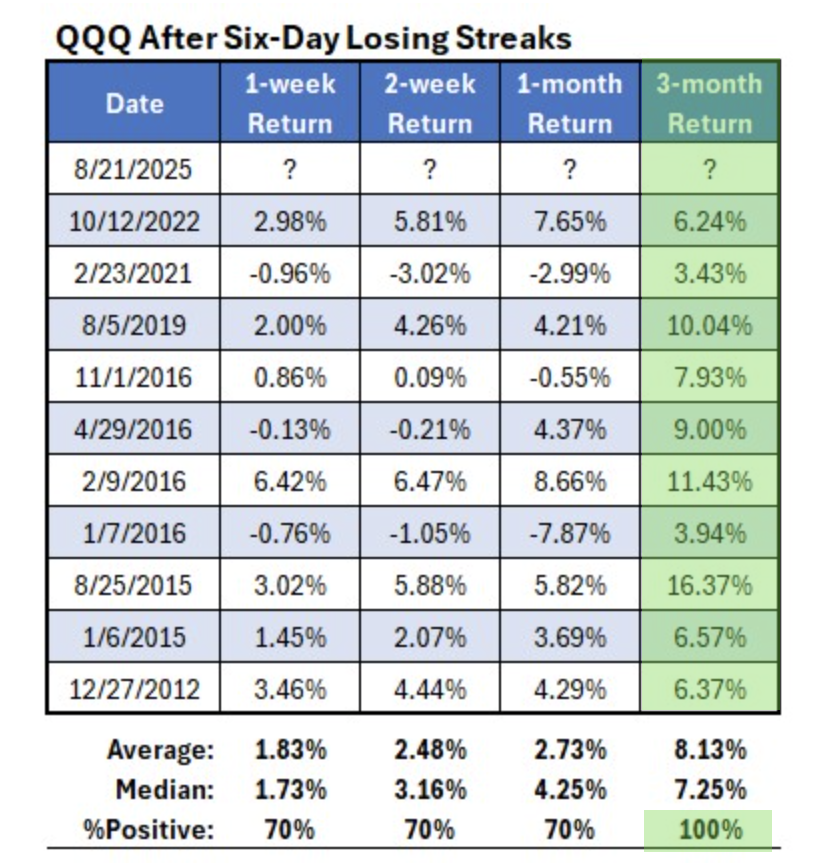
The Nasdaq 100 had 6 consecutive losing sessions ahead of the Jackson Hole Summit. Historically, this has proven to be a buying opportunity and will likely prove to be one for the months ahead, assuming cheaper prices.
As the table below identifies, 6-day losing streaks for the Nasdaq 100 offer a 3-month forward bullish signal. The closing price for QQQ/NDX as of the final trading day of the streak was 563.28 on August 21, 2025. This will prove our baseline for expectations and should price fall below that level at any point over the next 2.9 months.
I’m looking to reduce the SGOV position during the potential pullback in the markets and re-leverage the NVDA and QQQ position while trading the Semiconductor ETFs (SMH/SOXL). Least we forget the perfection in the Semiconductor quant data from Nautilus Research below:

In prior weekend Research Reports I’ve recognized the propensity for the market to produce only modest, sub -3% pullbacks. At this stage of the bullish trend and considering the scheduled fund flows associated with September, I’m more confident in supporting an outlook of a greater than -3% pullback, but still less than a -9% pullback, barring a growth scare that turns into something more sinister for the economy. Confidence is not the same as portending a guaranteed outcome, but merely confidence.
Direct quote from Finom Group’s “September’s Op/EX And The Worst Week Of The Year Await Investors″ Report (September 14th, 2025)
The Trump administration inherited a fully employed economy, but one showing most leading indicators (except the stock market) flashing yellow or red. Nearly eight months into his term, that’s still the case—only more so.
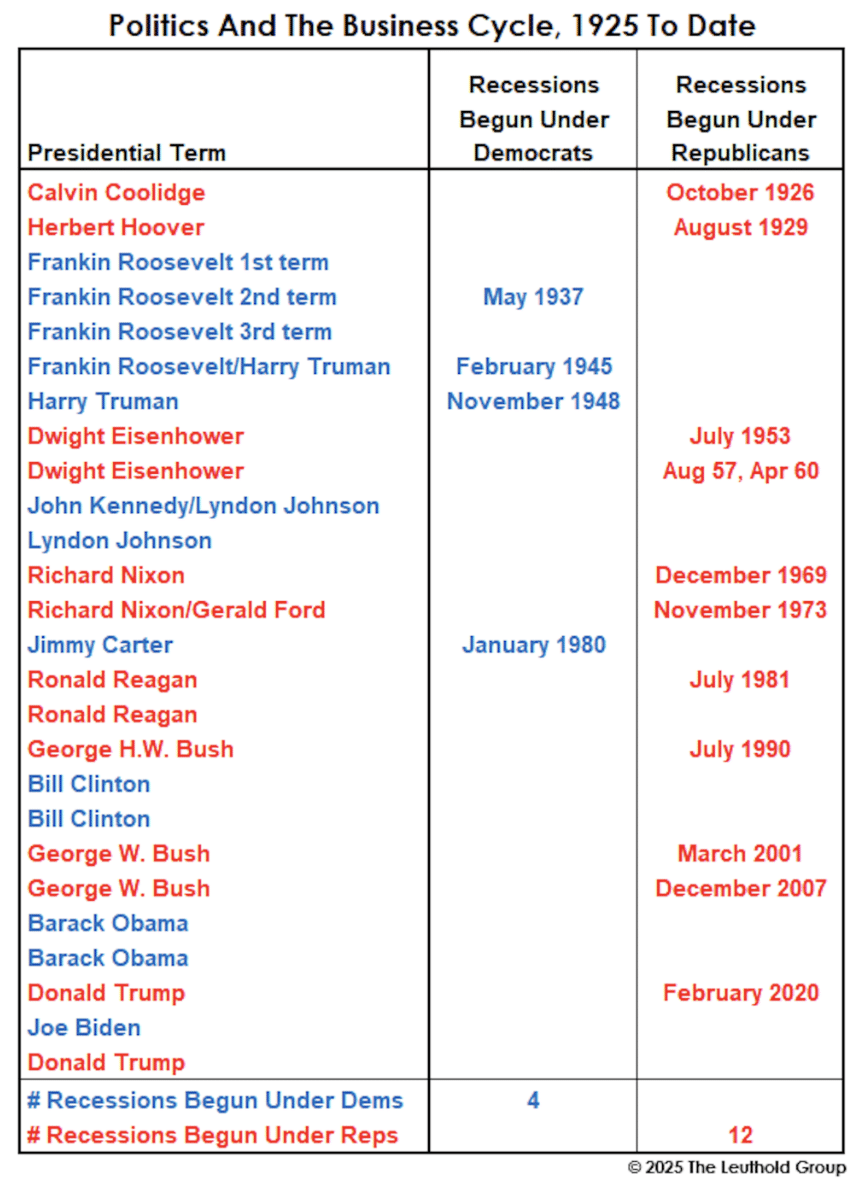
Given the fundamental backdrop, we’ll be more than stunned if a recession doesn’t break out between now and the end of Trump’s term in January 2029. There’s also a bit of political history working against Trump. In the last 100 years, only a single Republican presidential term concluded without the economy falling into recession (Reagan’s second term). Since 1925, twelve recessions have begun under Republican administrations (note there were two during Eisenhower’s second term) compared to just four under the Democrats. Since 1952, Republican terms have accounted for 10 of the last 11 recessions.
Party loyalists can obviously have a field day with this data. Democrats can simply cite the hard stats. Republicans might counter that the policies of a prior Democratic administration set up the economy for failure. Indeed, four of the 12 recessions under Republican administrations occurred in the first year after wresting control of the White House from the Democrats (1953, 1969, 1981, and 2001).
Hyper-partisans are free to use or abuse these statistics in any way they wish. (But when confronting hyper-partisans of the opposite persuasion, please refrain from citing my name or my company’s name as the source.)
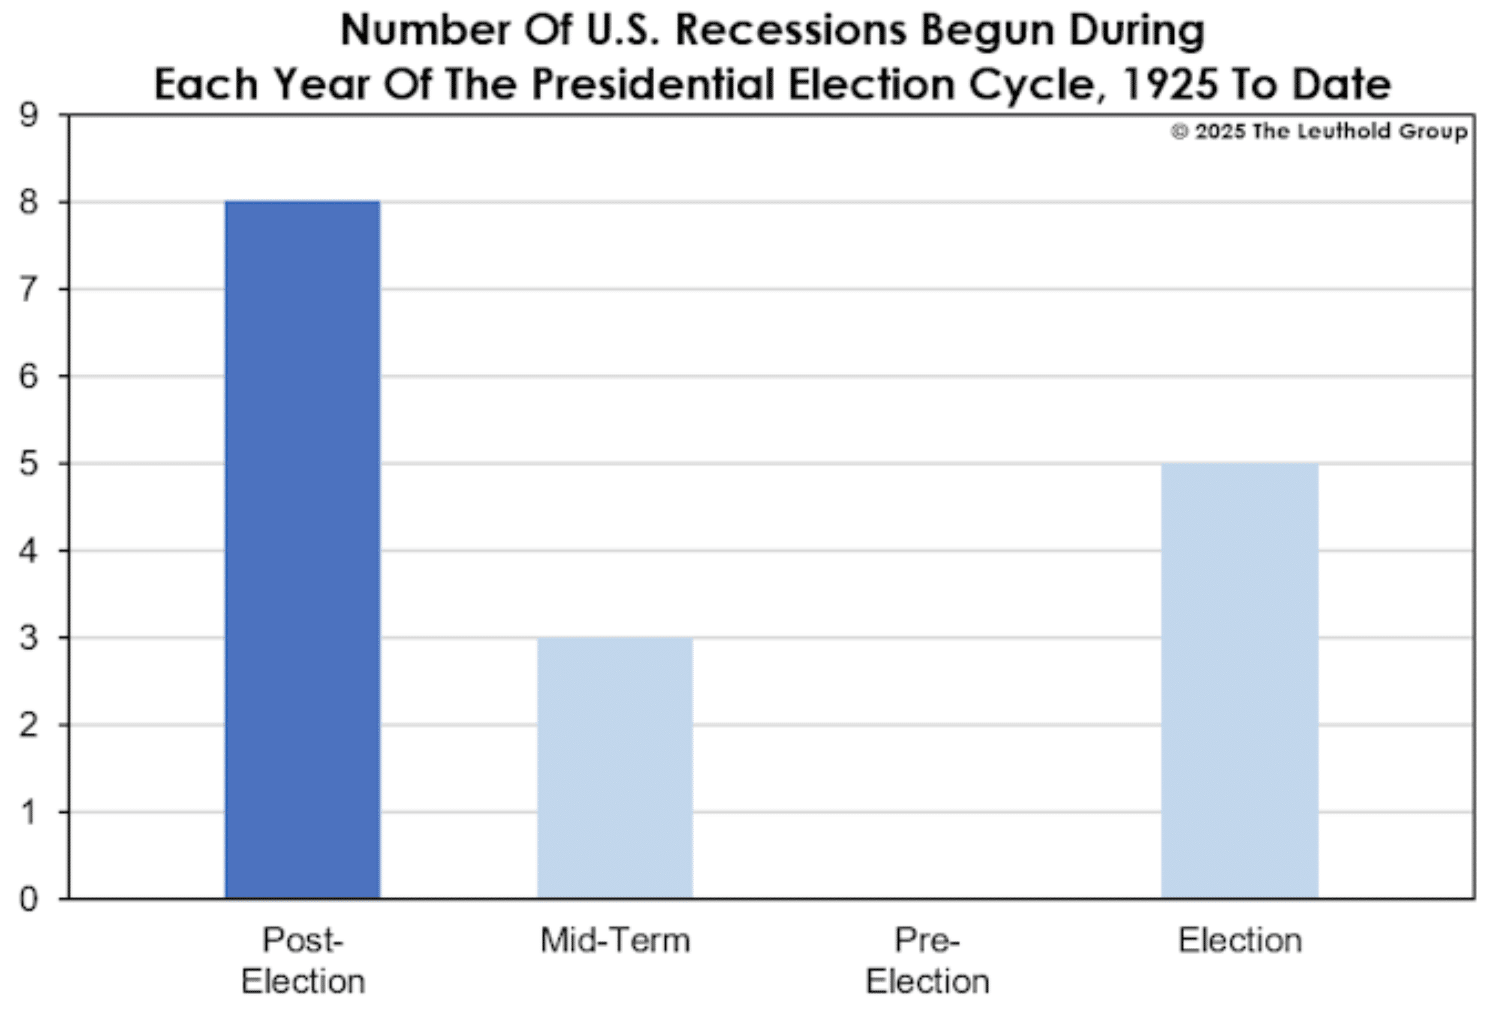
As suggested above, the first year of a term—whether it’s a White House incumbent or new occupant—has shown heightened recession risks. Half of the 16 recessions since 1925 began during the first calendar year following an election. The implication is that stimulative policies aimed at keeping the incumbent party in power—be they successful or not—frequently produce economic hangovers.
Direct quote from Finom Group’s “At 6,600+ There Are Too Many Wallflowers At The Stock Market Dance″ Report (September 21st, 2025)
Why We Quant… And More
Within the reviewed and former quants above, we want to refocus on this statement or offering: “Equally important to point out or consider, is that when markets perform outside of the baseline expectations, as they have done at certain points during the recovery period and to-date, be flexible with your approach to data signaling a pullback even one’s that seem all but certain. Here’s another “pro tip” to consider when studying quantitative data and their probabilities: Markets are intrinsically constructed to go higher, not lower and investors largely position and participate for such outcomes. Hence, if there are quant probabilities informing of a greater than 70% downside probability, these still have a higher failure rate than quants informing of a greater than 70% positive outcome. In other words, always leave more room for negative quants to fail than positive quant failures. Markets are designed to go higher, which is the basis for investing.
As a final reminder from our August 31, 2025 macro-market Research Report, this is why we consider not just quant data, but analogous price action from past years or price trend regimes:
As shown, the Post GFC (red) bull market vs the Post Covid (green) bull markets look extremely similar, shy of a couple brief divergences that quickly aligned thereafter. If the analogue plays out like it has been to-date, the S&P 500 would finish the year around 6,650, which is where we feel more comfortable establishing an updated sentimental price objective (will cement a new price objective in September).
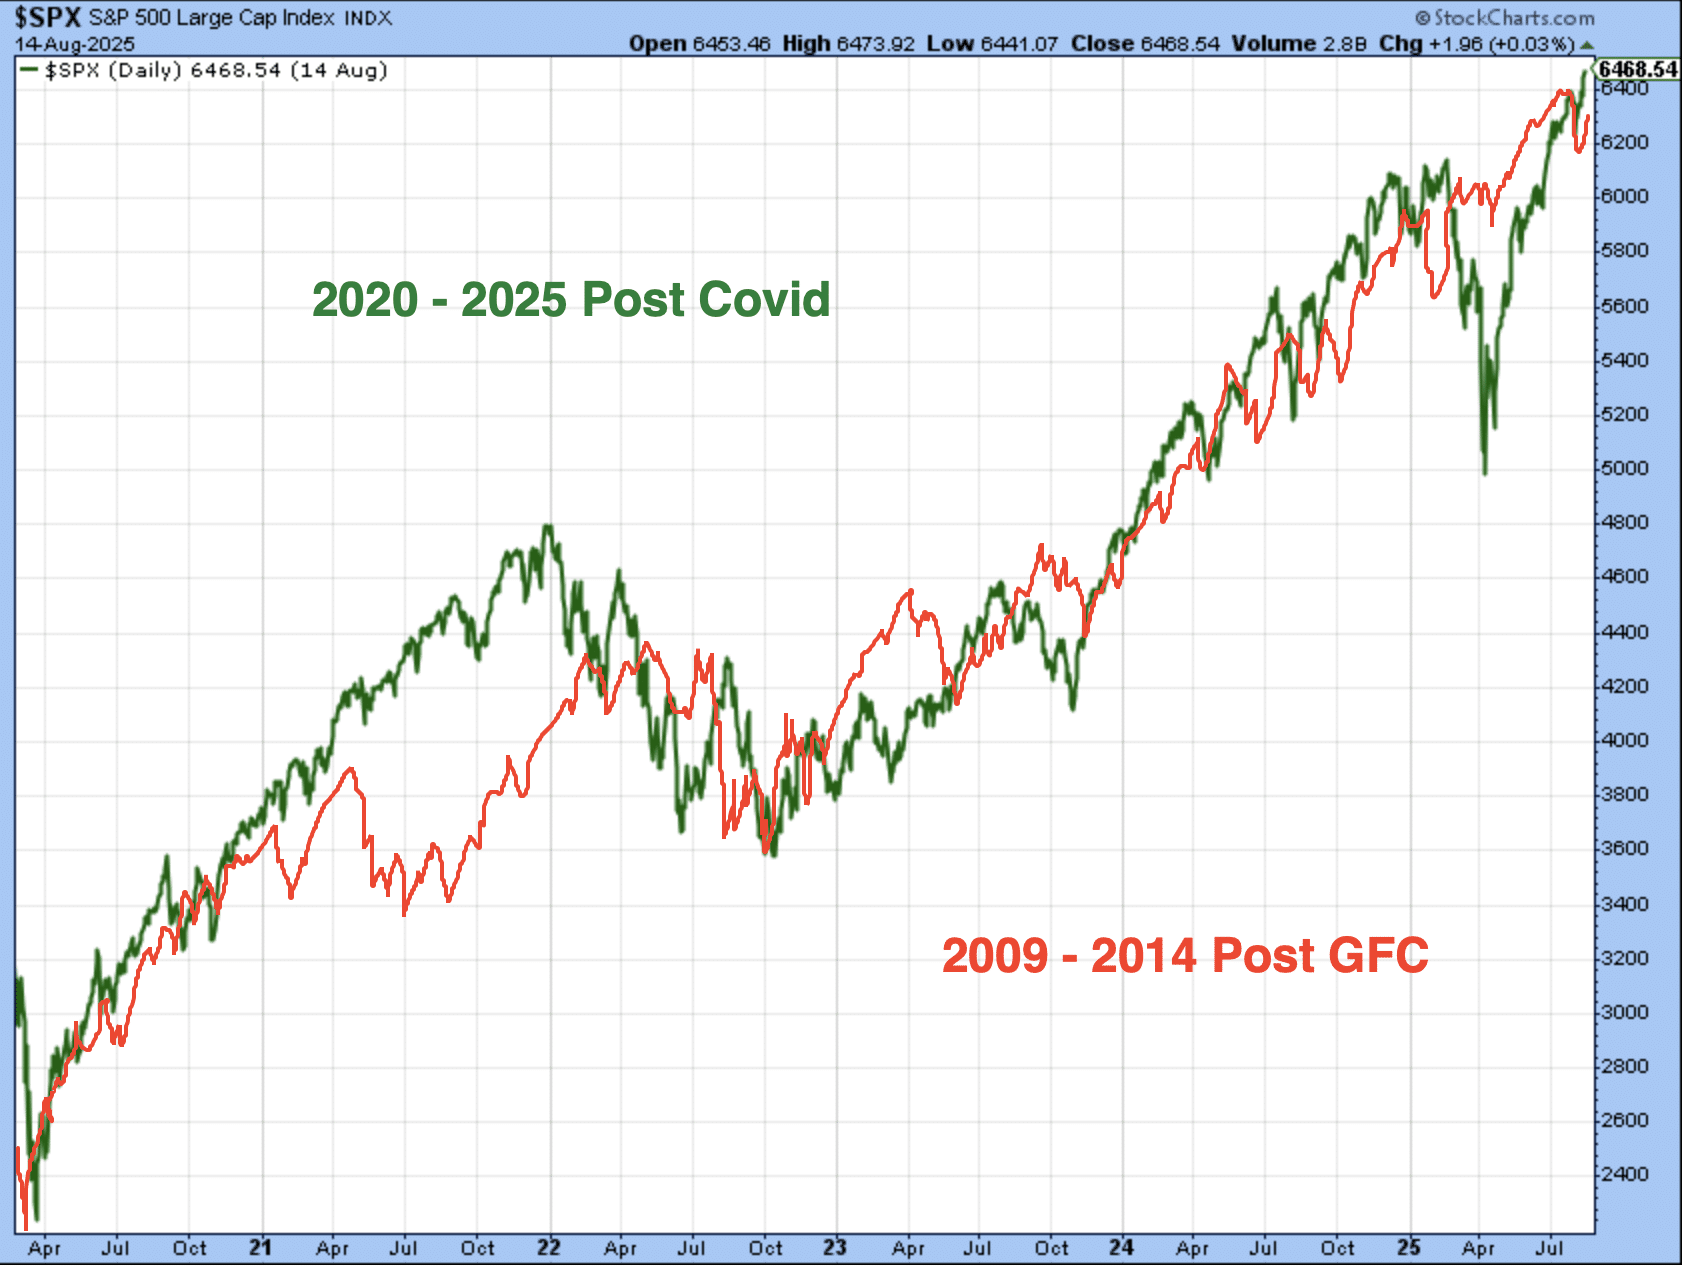
While many will view such analogues as coincidental at best and nonsense at worst, we choose to recognize such analogues as validation of scheduled fund flows and algorithmic investing. In other words, much of what we experience is validating both human behavior and pre-determined algorithmic, scheduled fund flows. With the dreaded “man-splaining” out of the way, the newly cemented S&P 500 price target objective of 6,800 satisfies the year-end time period and the Q1-end of 2026 time period. Within these time parameters, we believe the weight of the evidence which includes the current 22.5X forward 12-month EPS valuation, inform that the S&P 500 should achieve at least 6,800 and absent exogeny/endogeny; if not by year-end then by Q1-end of 2026. One could categorize this outlook by simply recognizing it is a 6-month price target objective.
Direct quote from Finom Group’s “At 6,600+ There Are Too Many Wallflowers At The Stock Market Dance″ Report (September 21st, 2025)
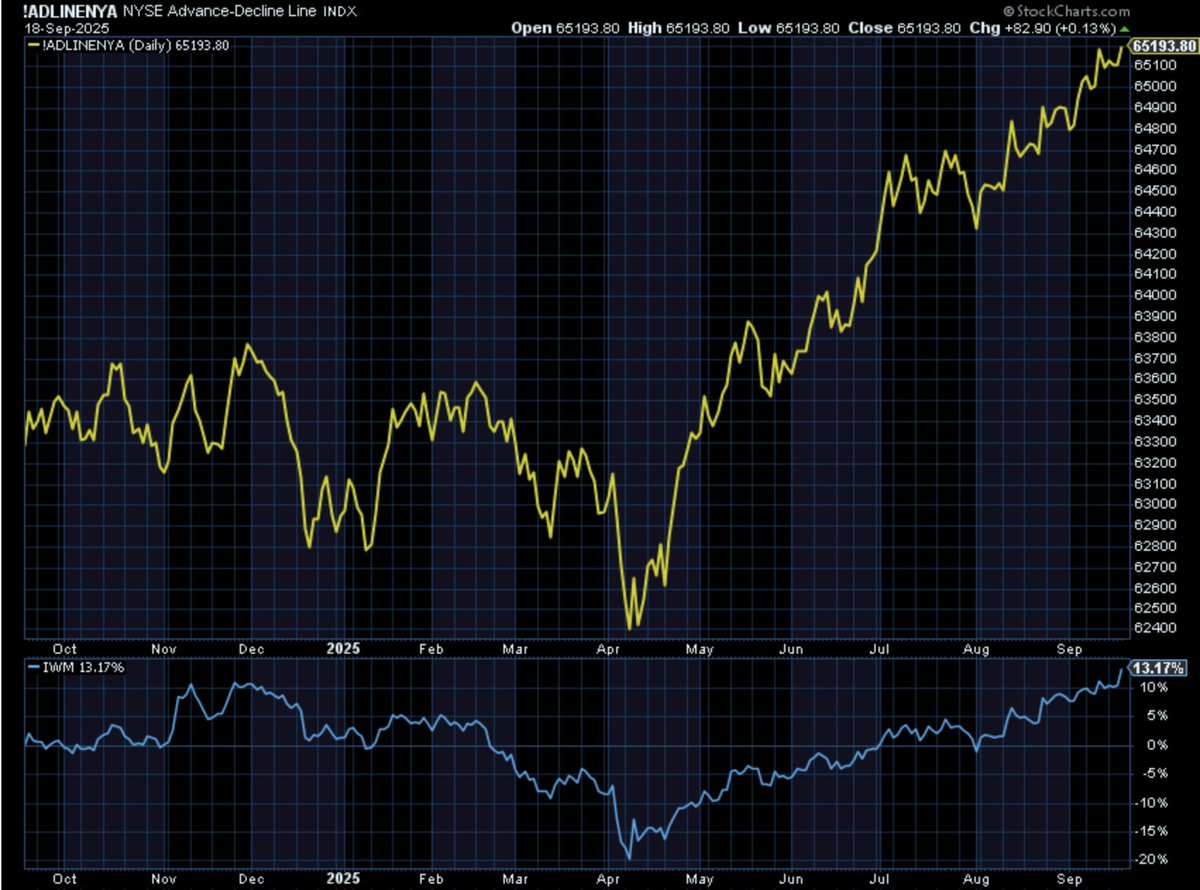
First, we don’t view the recent and 27th new all-time high as the ultimate high for many reasons, all supported by the fundamentals, technicals and quants. Far too many technically bullish achievements have just occurred, as noted in the below post/s from Finom Group’s chief equity Strategist Seth Golden (NYSE A/D Line and IWM small-cap ETF all-time high chart accompanied):

Direct quote from Finom Group’s “At 6,600+ There Are Too Many Wallflowers At The Stock Market Dance″ Report (September 21st, 2025)
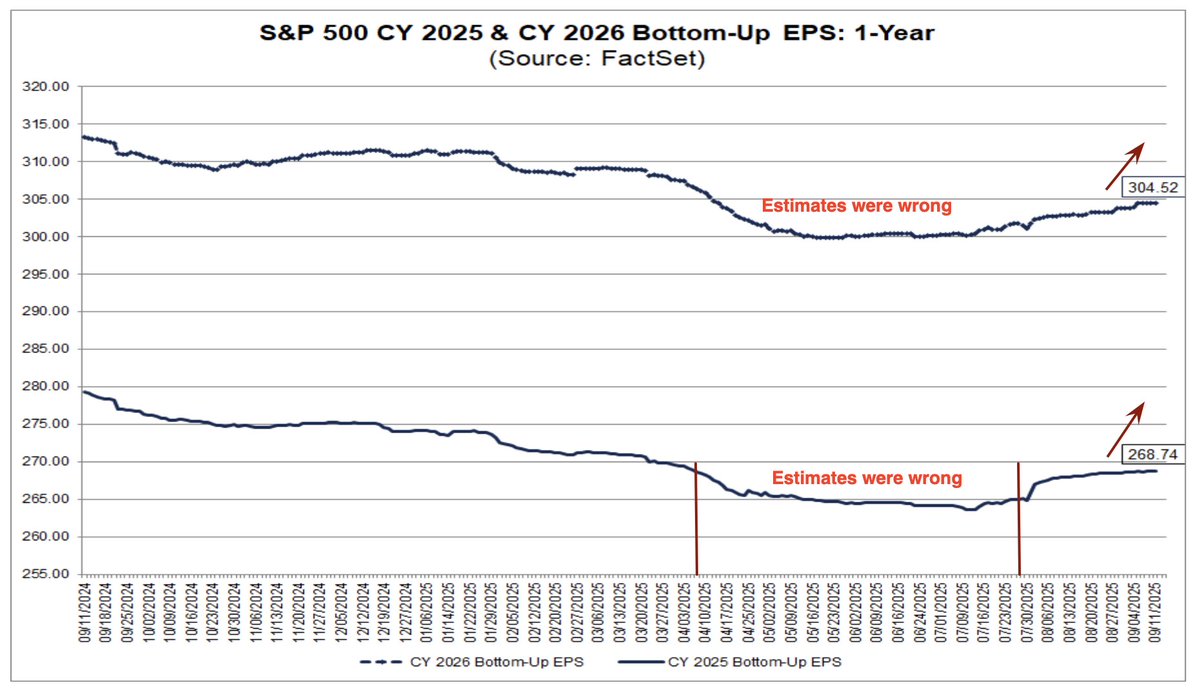
Secondly and from a fundamental perspective, Seth has previously expounded on the earnings revision strength and demands on markets to REPRICE the March and April “recessionary price action”, which doesn’t seem to be a likely outcome, to-date. In the Finom Group July 20, 2025 macro-market Research Report, Seth had offered the following fundamental earnings perspective relative to future market performance potential:
“Given the similarities in fiscal policy deployment as of July 2025 we can better understand why the S&P 500’s recovery has proven so fiercely V-shaped and without meaningful pullbacks, keeping in mind that Earnings Breadth Revisions have performed the SAME V-shaped recovery:
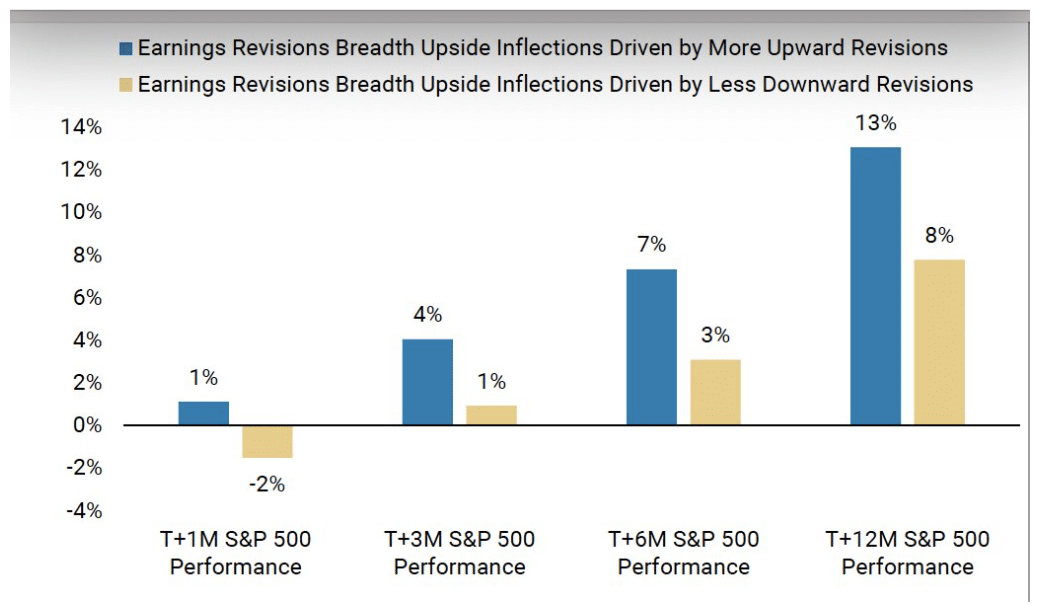

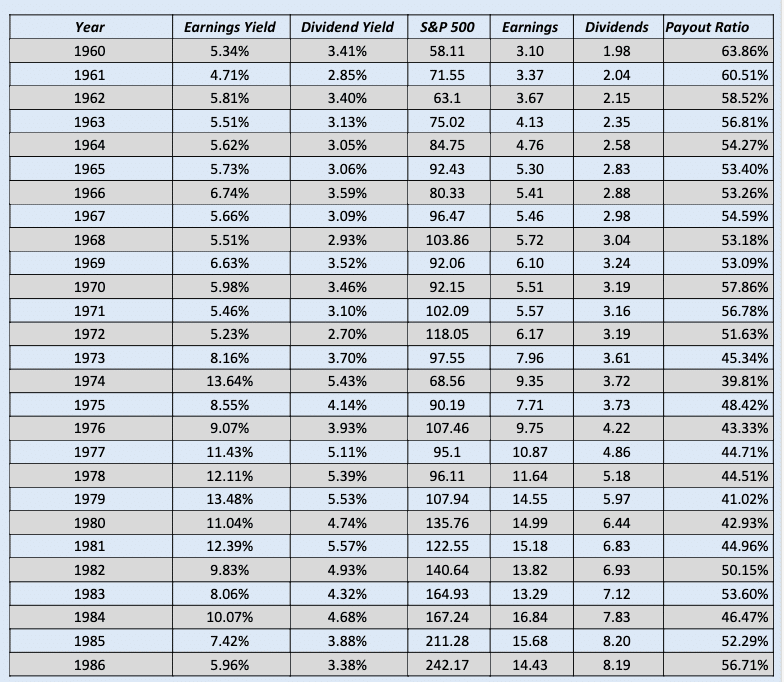
Just a week ago, the Earnings Revisions Breadth trend line was beneath the zero-bound level (chart above). What now happens to the markets if the trend line rallies above the peaks from 2023 and 2024? Remember, in 1995 and 2017 the analysts and strategists simply couldn’t keep up with positively revising their EPS outlook. In the following tables, we recognize the massive Y/Y jump in Operating Earnings from 1994 to 1995 and 2016 to 2017 (highlighted):
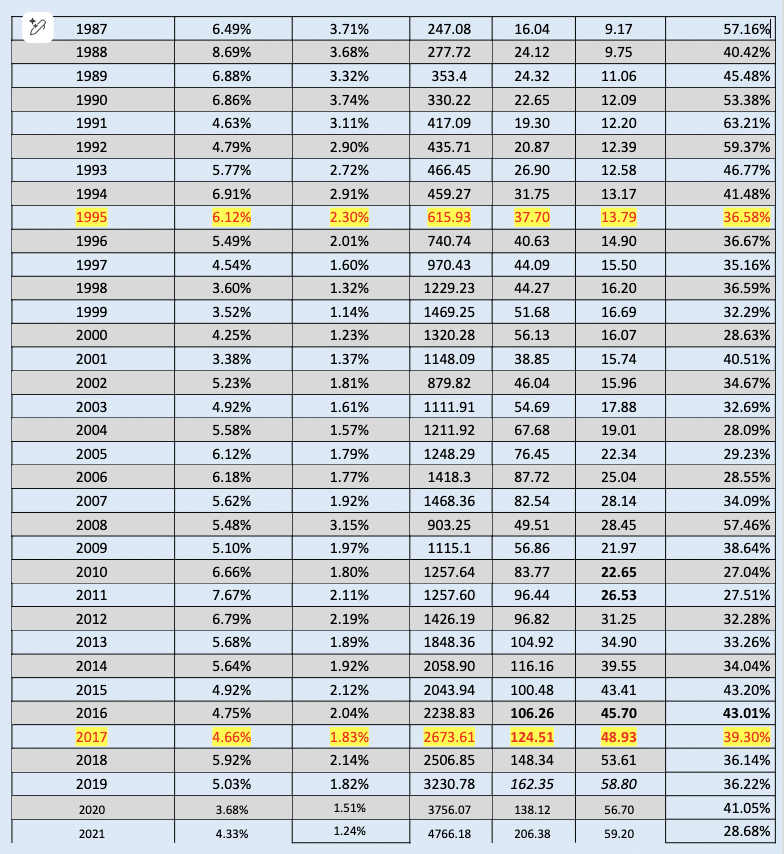
I don’t desire to suggest that the similarities between 1995, 2017, and 2025’s seemingly relentless efforts for analysts/strategists to catch back up to the former FY2025 EPS estimate will guarantee a -3% or less drawdown/pullback the rest of the year, but if we’re not considering the 4-year Presidential Cycle and the driving force of markets over time (earnings growth rate), then what are we doing, guesstimating ??
Direct quote from Finom Group’s “At 6,600+ There Are Too Many Wallflowers At The Stock Market Dance″ Report (September 21st, 2025)
I (Seth Golden), don’t envision positive FY2025 EPS revisions halting during the Q3 2025 reporting period due ahead in October. I don’t think the markets envision this either, akin to the 1995 and 2017 periods and why I remain of the opinion that higher prices and earnings are in the offing, with short and shallow dips being the savvy investor’s opportunity to re-leverage or recapture market exposure.
We’ve looked at the probabilities for higher-highs in the S&P 500 by year-end from a technical and fundamental perspective, although using limited samples/examples, so now let us look at a limited quant example that encapsulates the rally or price trend since April’s lows.
In the quant below from Bluekurtic, the study recognizes the best S&P 500 rallies since 2000, and those rallies of at least +28%. For the sake of argument, I’ve also included the same Nasdaq study, but for all Nasdaq rallies of at least +36% over the same 100-trading day period.


Direct quote from Finom Group’s “At 6,600+ There Are Too Many Wallflowers At The Stock Market Dance″ Report (September 21st, 2025)
There may have been a “hint” that small-caps would outperform in early August. According to the COT Report: Commercials are almost record-long Russell 2000 futures. Meanwhile, Large Speculators/hedge funds are almost record-short (chart via Subu Trade). This is smart money (Commercials) vs. dumb money (Hedge Fund Speculators) folks, and this is also recognition that the heard of smart money is more often found “right” when compared to the heard of dumb money.
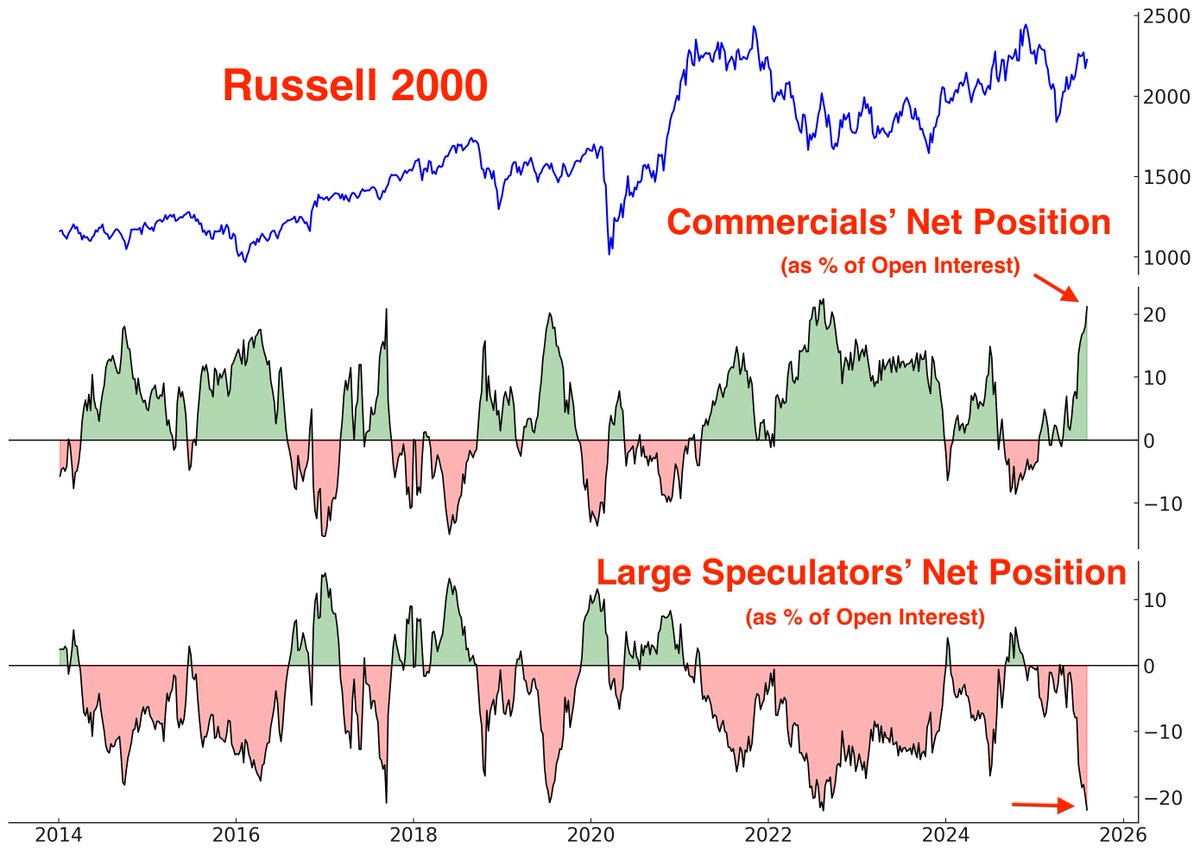
I’m not prepared to overweight small-caps, given I view the surge of late as more of a catch-up trade than anything else, least of all having anything to do with the prospectus for near-term rate cuts. Should small-caps do better with rate cuts? Yes! Better than large-caps? Not as likely! Historically, the only time small-caps outperform is during recessionary rate cutting cycles that find bear market bottoms and not rate adjustment cycles which this has all the signs for being.


Owning small-caps, yes, but overweighting small-caps we don’t yet see as the optimal positioning given the weight of the evidence approach to capital allocation.”
Direct quote from Finom Group’s “At 6,600+ There Are Too Many Wallflowers At The Stock Market Dance″ Report (September 21st, 2025)
I would feel remiss if we didn’t discuss, briefly, the highly anticipated and now delivered Fed rate cut. As easily predictable as this rate cut proved to be, future policy action may prove less predictable for the October FOMC meeting at this point. Equity markets are far more predictable, however, than future policy actions. With the Fed cutting rates within 2% of an all-time always proves bullish for the S&P 500 12-months forward, as evidenced in the Carson Research study below:
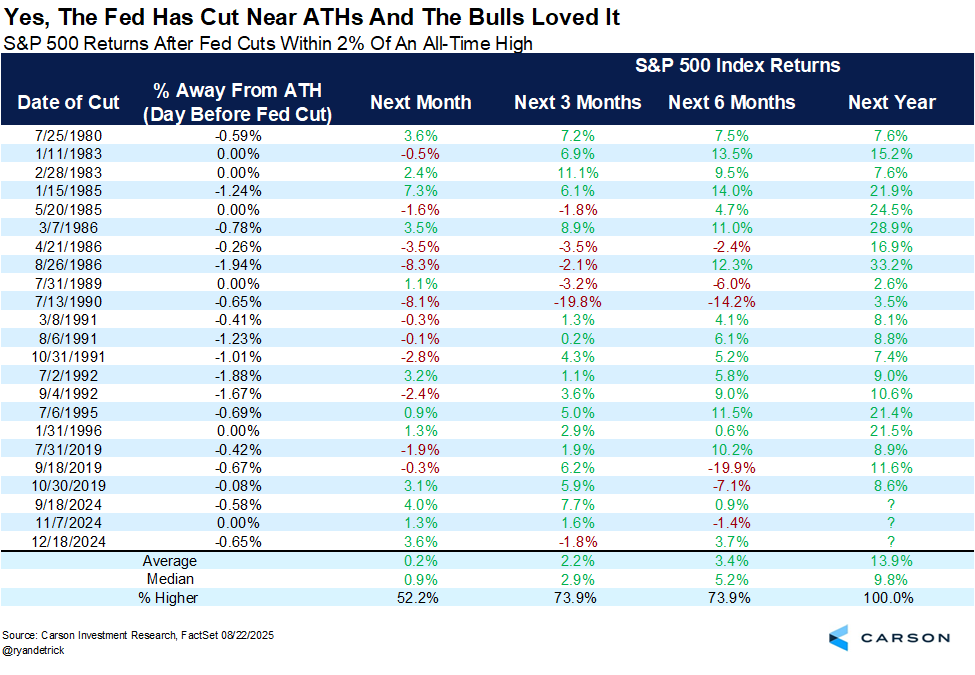
Mind you, the 12-month forward 100% positivity rate doesn’t exclude some seriously strong corrections within the forward 12-month period.
Unfortunately, once again however, the bond market’s price action is less predictable. Even though the Fed cut rates at the September meeting, we can’t dismiss that this may not drive long-end Treasury yields even lower, and did not do so the last cutting cycle from September of 2024.

The 10-year Treasury yield rose its greatest amount after the first rate cut of the cycle and since 1989. This was a rebuking of the September 2024 rate cut by the bond market, and a rarity it at that. With the Fed cutting rates again and during a seemingly cemented reflation period, it is difficult to “pin down” what the bond market reaction would prove to be under those conditions and going forward. Already since this past Wednesday’s delivered rate cut, the 10-Year Treasury yield has risen nearly +10bps. Even with that rise in yields, however, the equity markets like this lower-bound level of the 3-year regime that had kept 10-Year Treasury yield in the 4% -5% range. The mid-October inflation reports may have a lot to say about the probability of another rate cut in 2025, as well as the path for the 10-Year Treasury yield.
I’ve been of the opinion that the Fed cutting rates while its dual mandate is in tension would be a unique occurrence. The Fed has only cut rates when Core CPI was above 3%….1 time, just once and that one time Core CPI was declining in 1989… 1 time! ~Sonu Vargheese. My concern, since the rate cut occurred, is that Core CPI is not declining but rising and rising steadily. While I firmly believe that the former Fed Fund Rate was too tight, further reduction to the Fed Fund Rate may demand a plateau in the Core CPI, unless the labor market data worsens. As such, we maintain a vigilant state of monitoring the incoming weekly and monthly economic data.
Direct quote from Finom Group’s “At 6,600+ There Are Too Many Wallflowers At The Stock Market Dance″ Report (September 21st, 2025)
Moreover, investors would be wise to prefer a slow rate cutting cycle like the present one has been and seeing as how the prior rate cut was 9 months ago. Slower rate cutting cycles and those which have protracted pauses are a byproduct of expansion cycles not needing the Fed’s supportive monetary policy measures (See chart below from Ned Davis Research). Again, like the ongoing expansion cycle has proven.

From a practical, active portfolio manager’s standpoint what we want to know is where to allocate capital in such slow rate cutting cycles. What has leadership looked like after easing pauses and rate cuts come back into the picture? It has largely depended on the resiliency of the economy. When the economy has been strong enough to need only 1 or 2 cuts after a pause, cyclicals have outperformed. When 4 or more were needed, defensives have led.
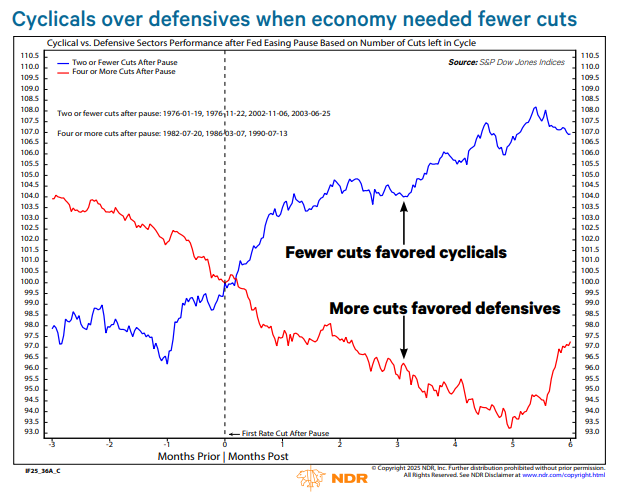
For example, Industrials outperformed the S&P 500 in the six months after easing pauses when the Fed needed to cut rates only one or two additional times in the cycle. When four or more cuts were needed, the sector underperformed, on average.

The top sector performers after a rate cut are usually associated with housing or consumerism. Naturally, if borrowing rates move lower, housing affordability can improve and thus benefit housing stocks and/or the Real Estate sector (XLRE). Like housing, if consumer borrowing costs are reduced when the Fed cuts rates, increased consumer spending is likely and thus Consumer Discretionary (XLY) stocks and the sector usually outperform.
The bottom line: If the economic conditions warrant few rate cuts, investors should be encouraged, and find pullbacks and dips as opportunities to scoop up cyclicals, Technology, and housing related stocks and/or sectors. How will you know if the economic conditions warrant few rate cuts? That’s what the following segment aims to provide investors/traders.
Direct quote from Finom Group’s “At 6,600+ There Are Too Many Wallflowers At The Stock Market Dance″ Report (September 21st, 2025)
Overextended, Close September Already
It’s safe and repetitious to state that the markets are overextended and found without even a 3% pullback since May 23rd. Despite this seemingly unstoppable melt-up, a pullback is an inevitability and one we continue to suggest would be bought quickly.

The strength of this bull market reminds of 1995 and 2017. Both found FOMO, but only one found the following year a major correction (2018). The main difference is the former years mentioned did not have a technical bear market like 2025. The mean amount of days without a -3% pullback in a secular bull market is just 26 days (table above). The longest period ever was through 2017 into February of 2018. The current period without a -3% pullback is now nearly 3x longer than the mean average without pullback. If something is going to inevitably happen… now may be as good a time as any and it doesn’t demand hedging, but rather cash to buy the dip.
As noted atop this weekend’s macro-market Research Report, there’s a reasonably high probability for the S&P 500 to deliver a positive September return; not a guarantee, but a reasonably high probability.
For the time being, we simply look to take advantage of modest pullbacks that would help to alleviate overextended conditions, which are outlined by Bespoke Investment Group below for both the S&P 500 and Nasdaq:
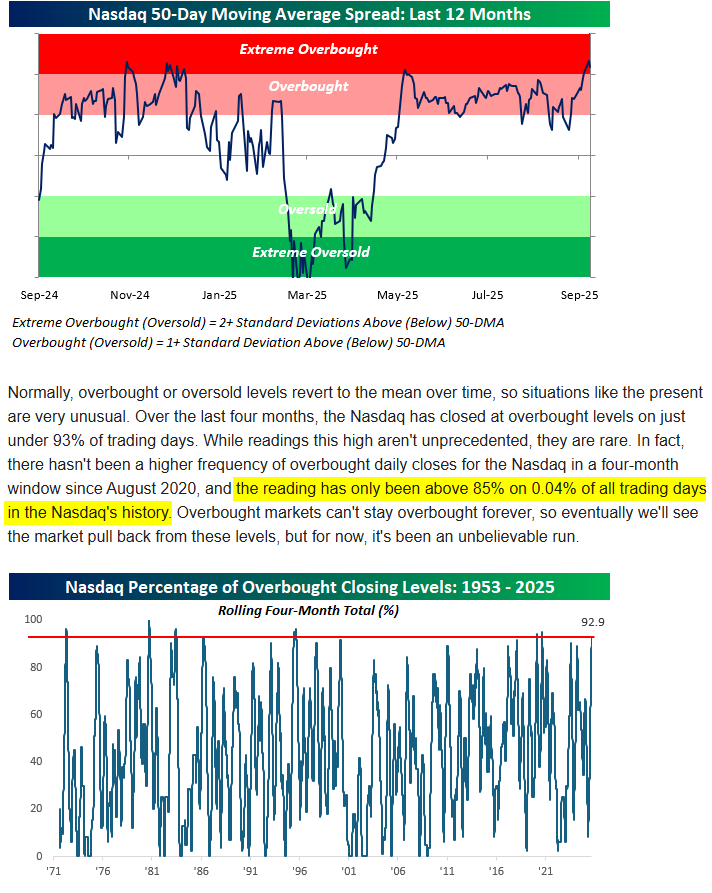
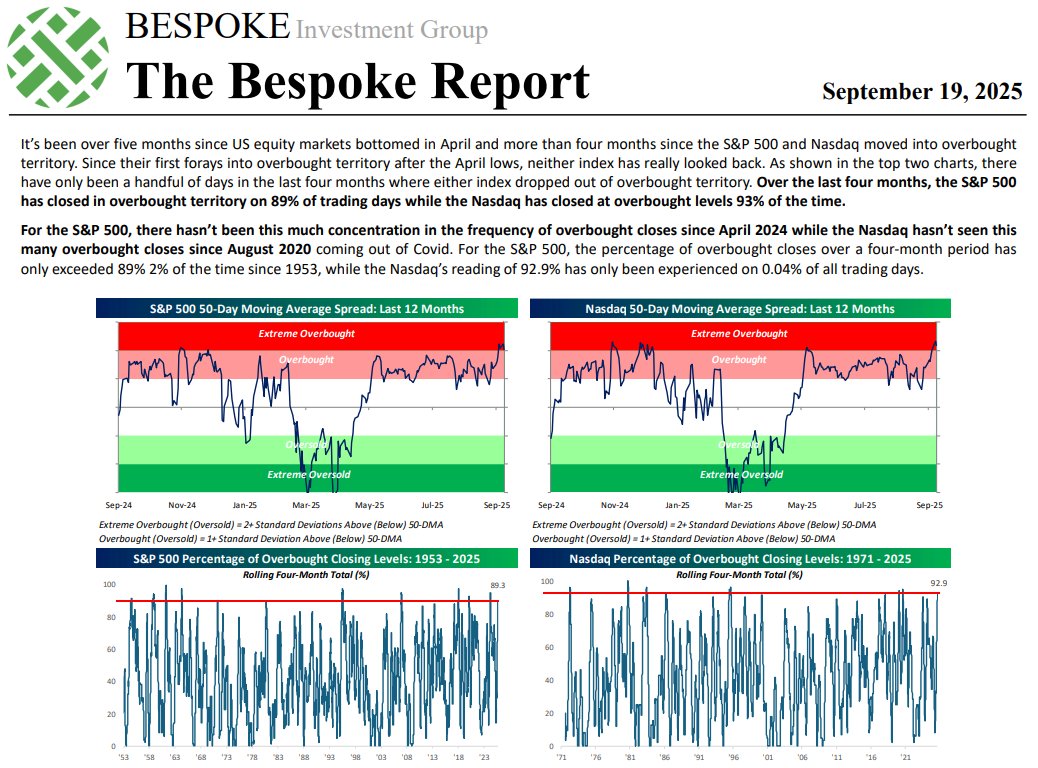
Direct quote from Finom Group’s “At 6,600+ There Are Too Many Wallflowers At The Stock Market Dance″ Report (September 21st, 2025)
…This is not the time to chase speculative areas of the market, but rather stick to your game plan and disciplines that got you here. Else, Warren Buffett reminds us all in the following passage:
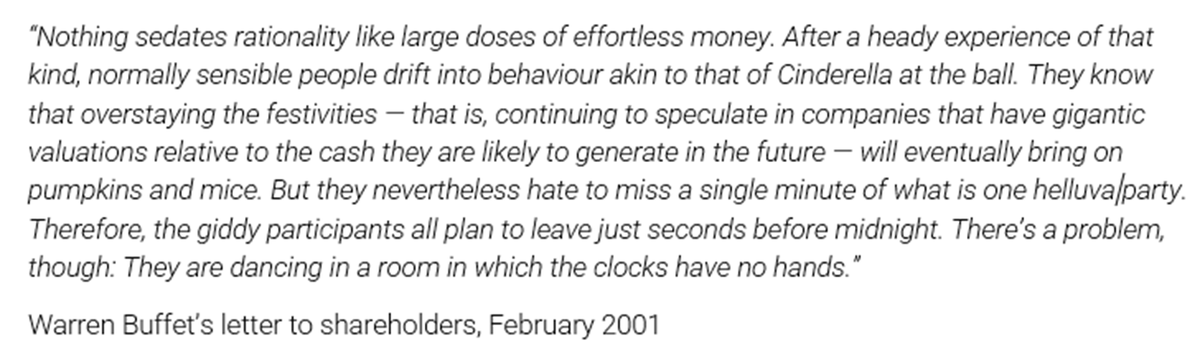
We don’t know when the music will stop playing, but until it does you have to dance. The exuberance in markets today is a longer-term bullish signal without the benefit of foreseeing exogeny, but supported by forward earnings growth. Even so…
The Put/Call Ratio fell to its lowest level since May, this past Friday (.45). After such a protracted melt-up, one may not have thought to see such a low Put/Call Ratio, but that’s how exuberant price action has been. Either way, this level has also proven a leading indicator of a future market pullback (chart below). To what degree the market pulls back is always different, but a pullback indeed has been the message from such a low level.
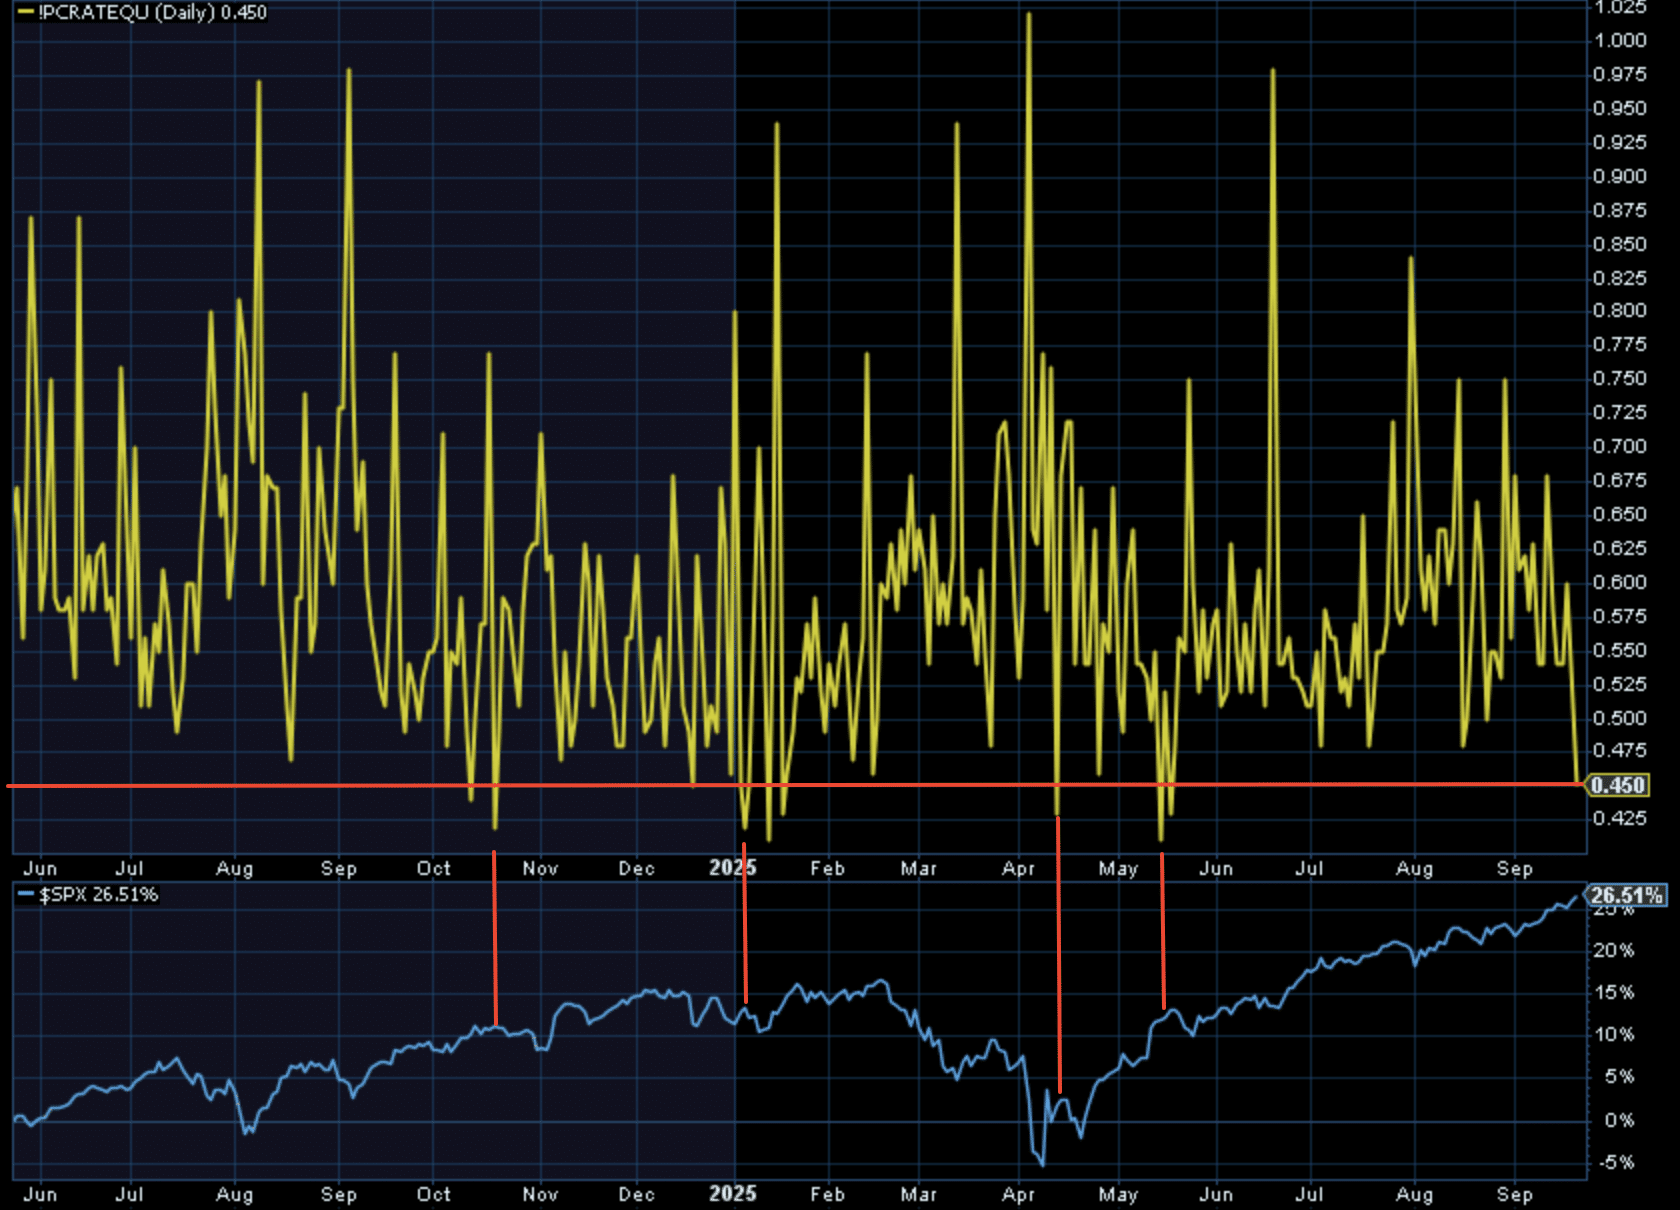
This is not to suggest the Put/Call Ratio is “causal”, but conditional for markets that have in the past consolidated price near-term. Remember, the S&P 500’s RSI has stayed above the 45 level for 102 straight days now, one of the longest streaks in history. In the past 60 years (Subu Trade), the S&P 500 was lower EVERY time 2 weeks later. As we can see in the chart above, the vertical red lines depict this probability over even the last 18 months.
Direct quote from Finom Group’s “Stepping On Bullish Toes (Hooves)″ Report (September 28th, 2025)
Even Fed Chairman Jerome Powell recently commented about stock market valuations looking expensive. “By many measures, for example, equity prices are fairly highly valued.” Isn’t Jerome Powell of all people, qualified; to give a qualified opinion on valuations? Let’s see what the data suggests, shall we?
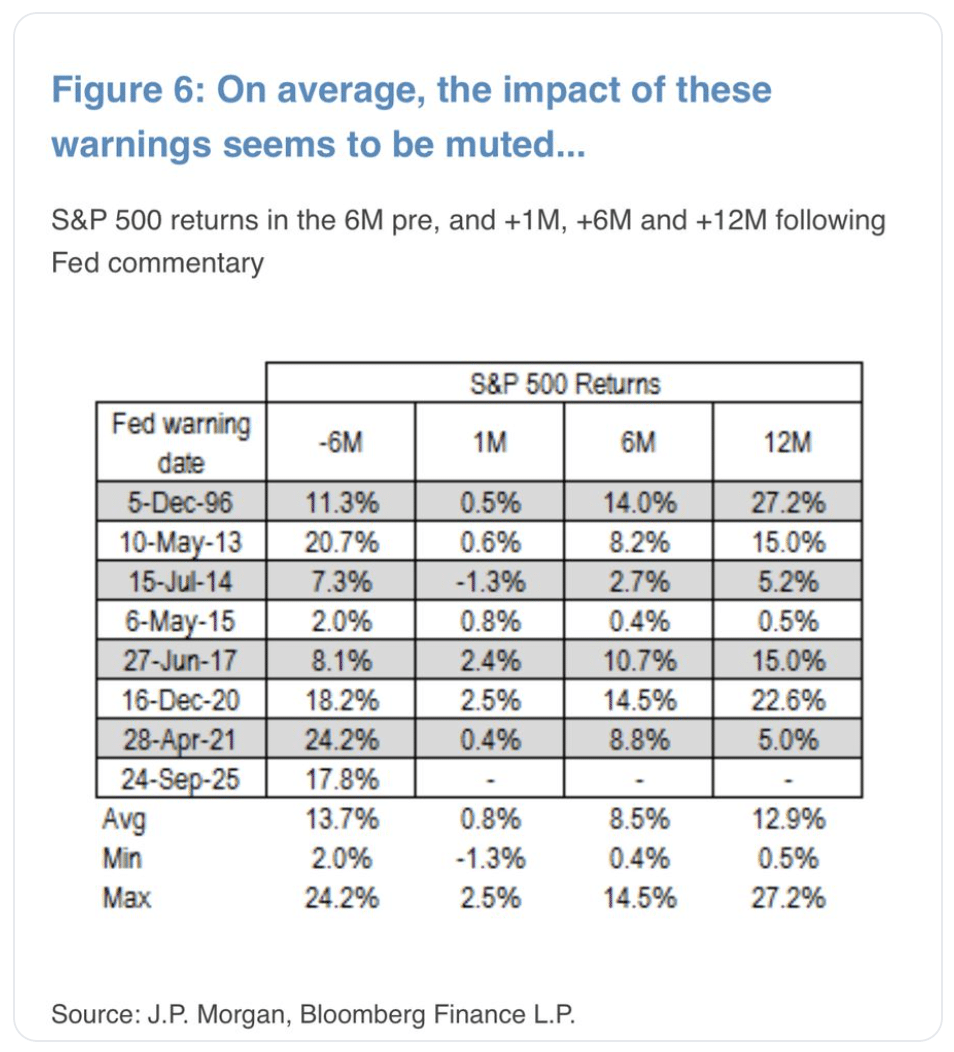
As evidenced and outlined in the data above from J.P. Morgan, “.. the immediate impact of these warnings appears to be quite muted on average with modestly positive/flat returns in the following 1M.. but still strong performance in 6M-12M. at +8% and +12%”
It would appear as thought Fed chairman Powell is perfectly entitled to offer his thoughts on market valuations, but the efficacy of any chairman commentary on market valuations proves inconsequential. Again,, welcome back to this weekend’s macro-market Research Reports, where the data proves a guide!
Direct quote from Finom Group’s “Stepping On Bullish Toes (Hooves)″ Report (September 28th, 2025)
…Even with a government shutdown more probable on September 30th, the S&P 500 falling that much will take a goodly amount of selling pressure that would prove inconsistent with every other known risk that has NOT proven a headwind for markets since April.
In speaking to a government shutdown and the S&P 500’s performance during such events:
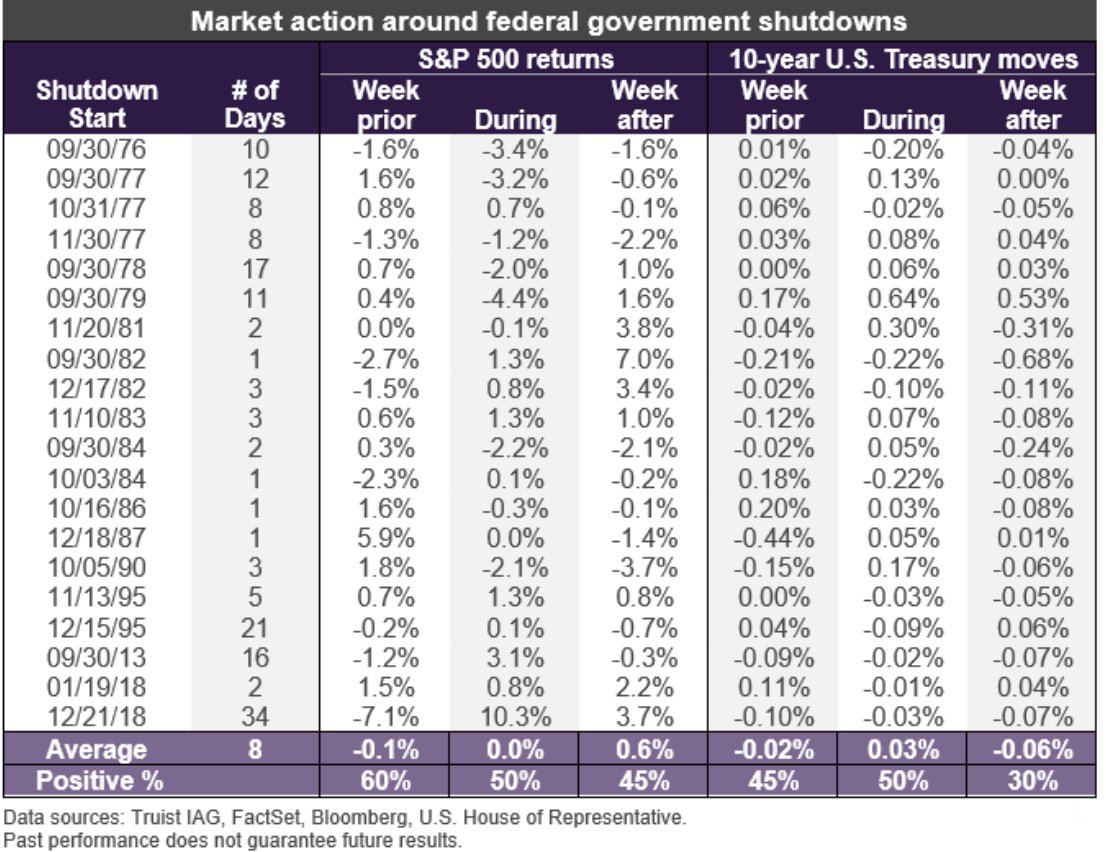
The good news, nobody has an edge, with the S&P 500 positivity rate being 50/50 during the shutdown. As such, I would look for the biggest drawdown to better understand worst-case scenarios and for game planning purposes. The biggest drawdown was -3.4% during the 1976 government shutdown. Government shutdowns were almost an annual event from the late 1970s to 1990s, when the government was running a surplus 🤣. Moving onward…
If indeed, which seems highly probable but not counting our 🐓, the S&P 500 finish September positive, that would prove a 5-month winning streak. As mentioned inside last weekend’s macro-market Research Report, while that may find price pressure near-term, looking out 12 months it proves a highly positive outcome.
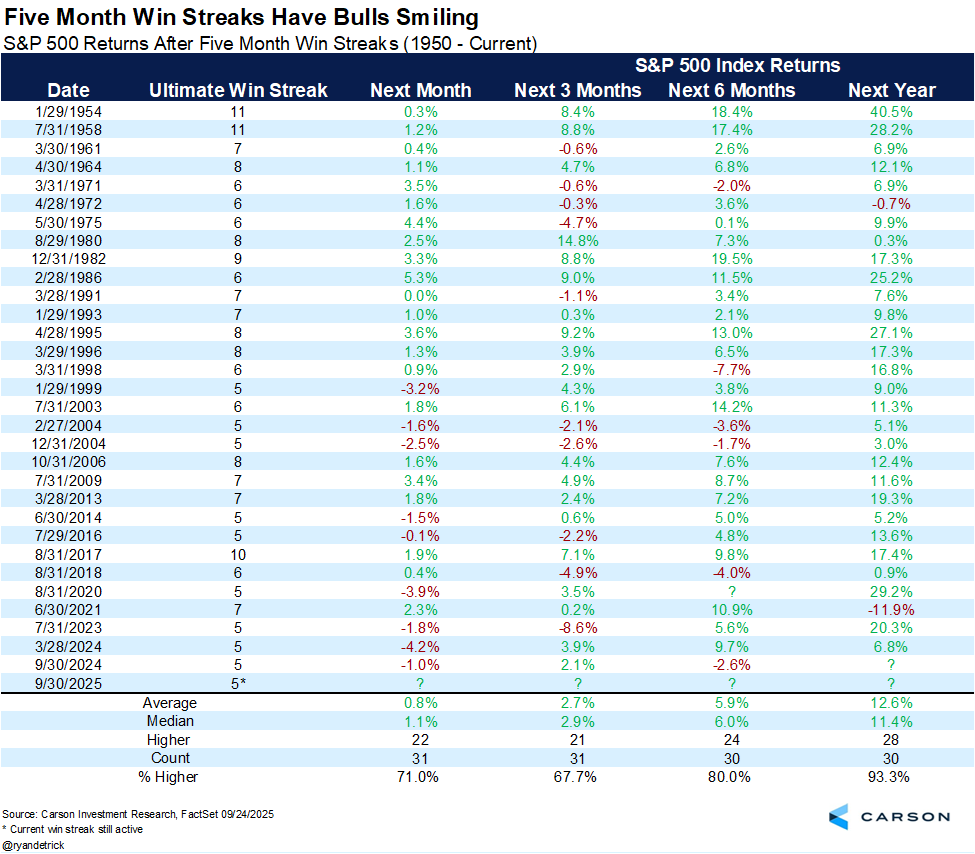
Remember something you may have learned from our Quant Webinar/PDF last year (for those who purchased PDF): “Whenever engaging a quant study for the first time, don’t read the headline of the quant study.” First look at the sample size and then scroll to the positivity rates and average/median returns. If dates… if dates included as the sample size identifier, look at the dates. Some of you have already performed this exercise and have already recognized what I’m about to outline: “There has only been a 5-month winning streak ending in September 1 other time.” So what does this mean? Well, this time is clearly different does seem fitting for one thing. But, here’s another…
I can appreciate that this is a price trend/fund flow quant, which is a most favorable of quant studies, without denial. But look at the 3-month forward positivity rate of only 67.7%. My rule of thumb with quant studies is that if the positivity rate isn’t in the 70% or better range, it proves less effective or useful. We might decide to disregard the quant for the 3-month period or through year-end, but still be reminded of the 12-month forward positivity rate of 93%. Another way of saying this is that we will likely need to rely on OTHER 3-month forward quant data to determine the positivity rate for the S&P 500. And of course we have OTHER data…
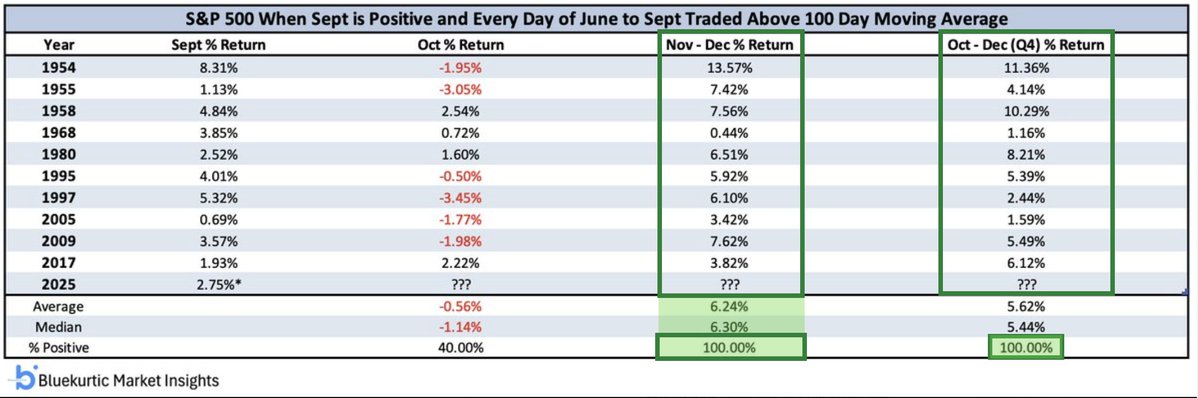
The above quant from Bluekurtic informs of the potential 5-month winning streak, if only due to the fact the S&P 500 may finish positive in the month of September while remaining above the 100-DMA since June, at least. Staying above the 100-DMA for this long, speaks to something more cemented in the fundamental landscape such that investors are not willing to wait for bigger pullbacks. We know what that fundamental something is and has been, the strength of earnings growth. As such, if we use this quant study we come to discern a more concrete and absolute understanding of the coming 3-month period. The S&P 500 has never delivered a negative return over the stated time period, with a focus on both the September achievement and price trend strength. The lesser returns, on average, outlined in the Oct-Nov period relative to the Nov-Dec period is respective of the October positivity and average returns outlined in the 3rd column.

With the threat of a government shutdown approaching, we thought it relevant to also provide the MAX Drawdown potential for the coming 3-month period, and October has had some scary moments indeed, even with this price trend quant. I’m not of the opinion last week’s pullback of -.3% is the end of price consolidation, but will be pleasantly surprised should it prove to have been.
Direct quote from Finom Group’s “Stepping On Bullish Toes (Hooves)″ Report (September 28th, 2025)
Regardless of the near-term pullback potential, which the data informs would prove a buying opportunity that still delivers positive returns by year-end, if that doesn’t prove to be the case, we consider other studies that confirm this potential reward and help us to think longer-term.

The S&P 500 has never, EVER made 28 calendar year all-time highs and stopped on number 28. It has always gone on to achieve at least 2 more all-time highs in the calendar year (1983), informing that there remains a 93.8% probability that 2 more all-time highs are achieved by year-end. We like those probabilities, and the fact that the market has only topped in the month of September 2 times since 1980 improves these odds.

Last, but certainly not least, the S&P 500 all-time highs have been consistently confirmed by the NYSE’s Advance/Decline Line achieving all-time highs throughout the year. It’s not impossible, but it would be rare for the S&P 500 to express a top when the NYSE A/D Line just made an all-time high on September 18, 2025. The median lead time to the S&P 500 top is roughly 7 months or 30 weeks, and the index has only topped the same month as the NYSE A/D Line’s all-time high 2 times in 68 years, for which the S&P 500 has already made an additional new high on September 22, 2025. For THE top to have occurred 2 weeks prior would demand exogeny/endogeny.
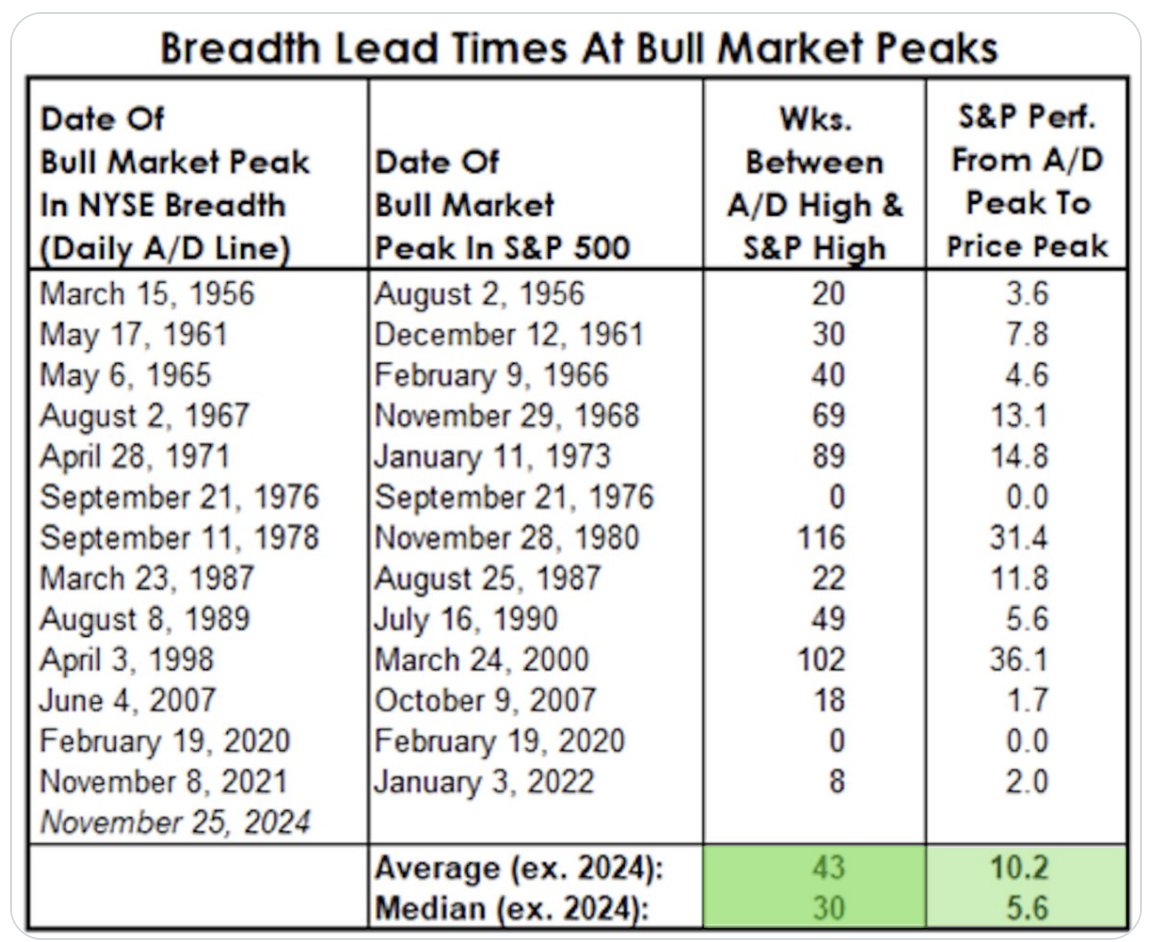
Moreover, the average return (after A/D Line High) to the S&P 500 ultimate top is +10.2%. Keep in mind the new quant date price for the NYSE A/D Line all-time high is now 6,631 on September 18, 2025 folks!
Direct quote from Finom Group’s “Stepping On Bullish Toes (Hooves)″ Report (September 28th, 2025)
Bottom Line: The majority of the quant data is supporting of higher prices by year-end, but also recognize a reasonably high probability that last week’s modest pullback could prove the precursor to a greater pullback. The catalyst for such a pullback could range from scheduled fund flows to that of a government shutdown. We have viewed ANY pullbacks as buyable, even if those pullbacks prove greater in the coming weeks and unless a macro-event of consequence occurs. As such, we believe higher-highs are in store by year end and remind of our price target objective and time period:
“…the newly cemented S&P 500 price target objective of 6,800 satisfies the year-end time period and the Q1-end of 2026 time period. Within these time parameters, we believe the weight of the evidence which includes the current 22.5X forward 12-month EPS valuation, inform that the S&P 500 should achieve at least 6,800 and absent exogeny/endogeny; if not by year-end then by Q1-end of 2026. One could categorize this outlook by simply recognizing it is a 6-month price target objective.”

Dr. Ed Yardeni: We are raising our year-end S&P 500 target from 6600 to 6800. Base-case scenario w/subjective probability of 55%. Currently assign 25% probability to melt-up that lifts SPX to 7000 by year-end 2025 and 20% odds to a correction in SPX by end of this year. If Fed lowers the rates on Sept 17 and signals more rate cuts ahead, we will increase our odds of melt up, decrease our odds of correction.
Direct quote from Finom Group’s “Stepping On Bullish Toes (Hooves)″ Report (September 28th, 2025)
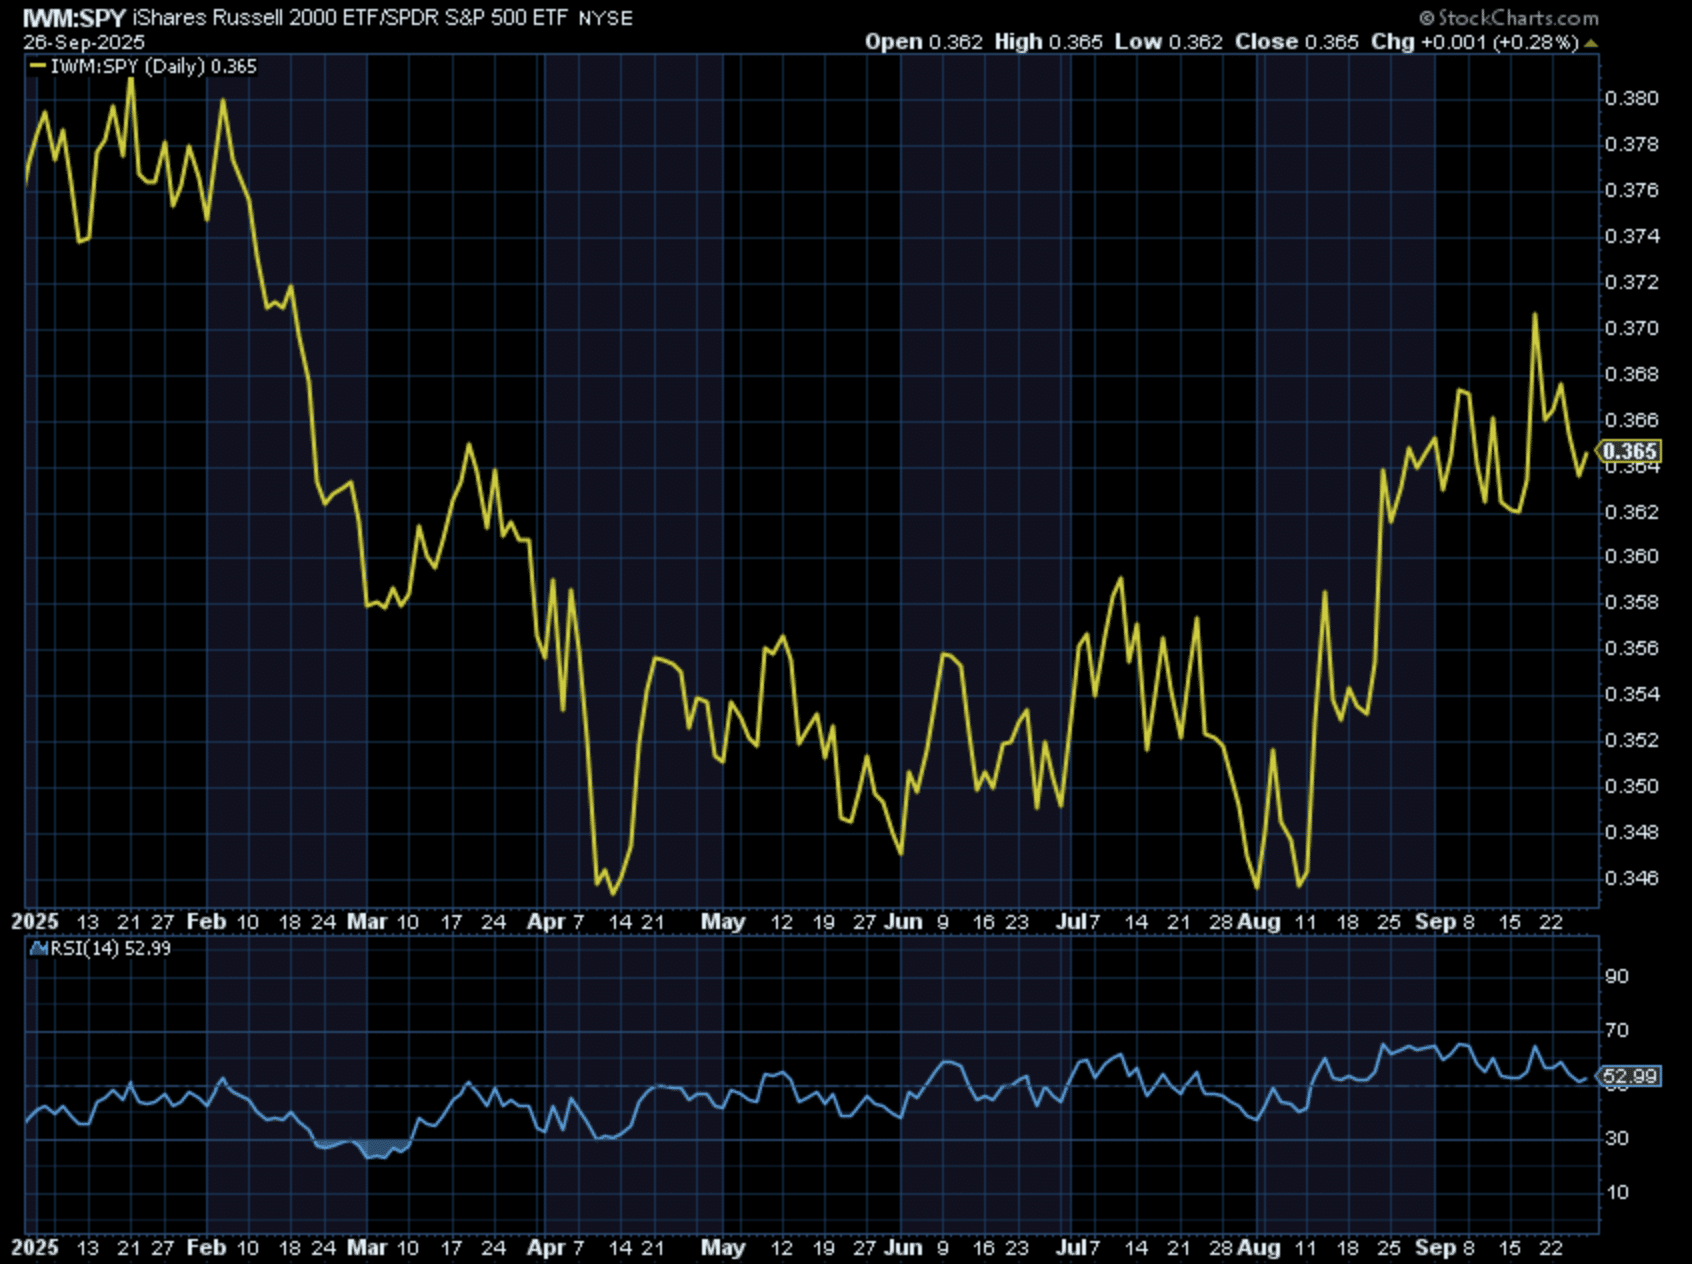
Recognizing that the small-cap Russell 2000 had also made a new all-time high 2 weeks ago is just further recognition of the strength and broad-based participation in the bull market. We think, however, that the participation or breadth of the market has both slowed in momentum terms and softened with respect to participation.
We can visualize the reduced contribution to the index return gains on a YTD basis with the dip in companies producing positive Y/Y price gains via the Yardeni Research chart below:
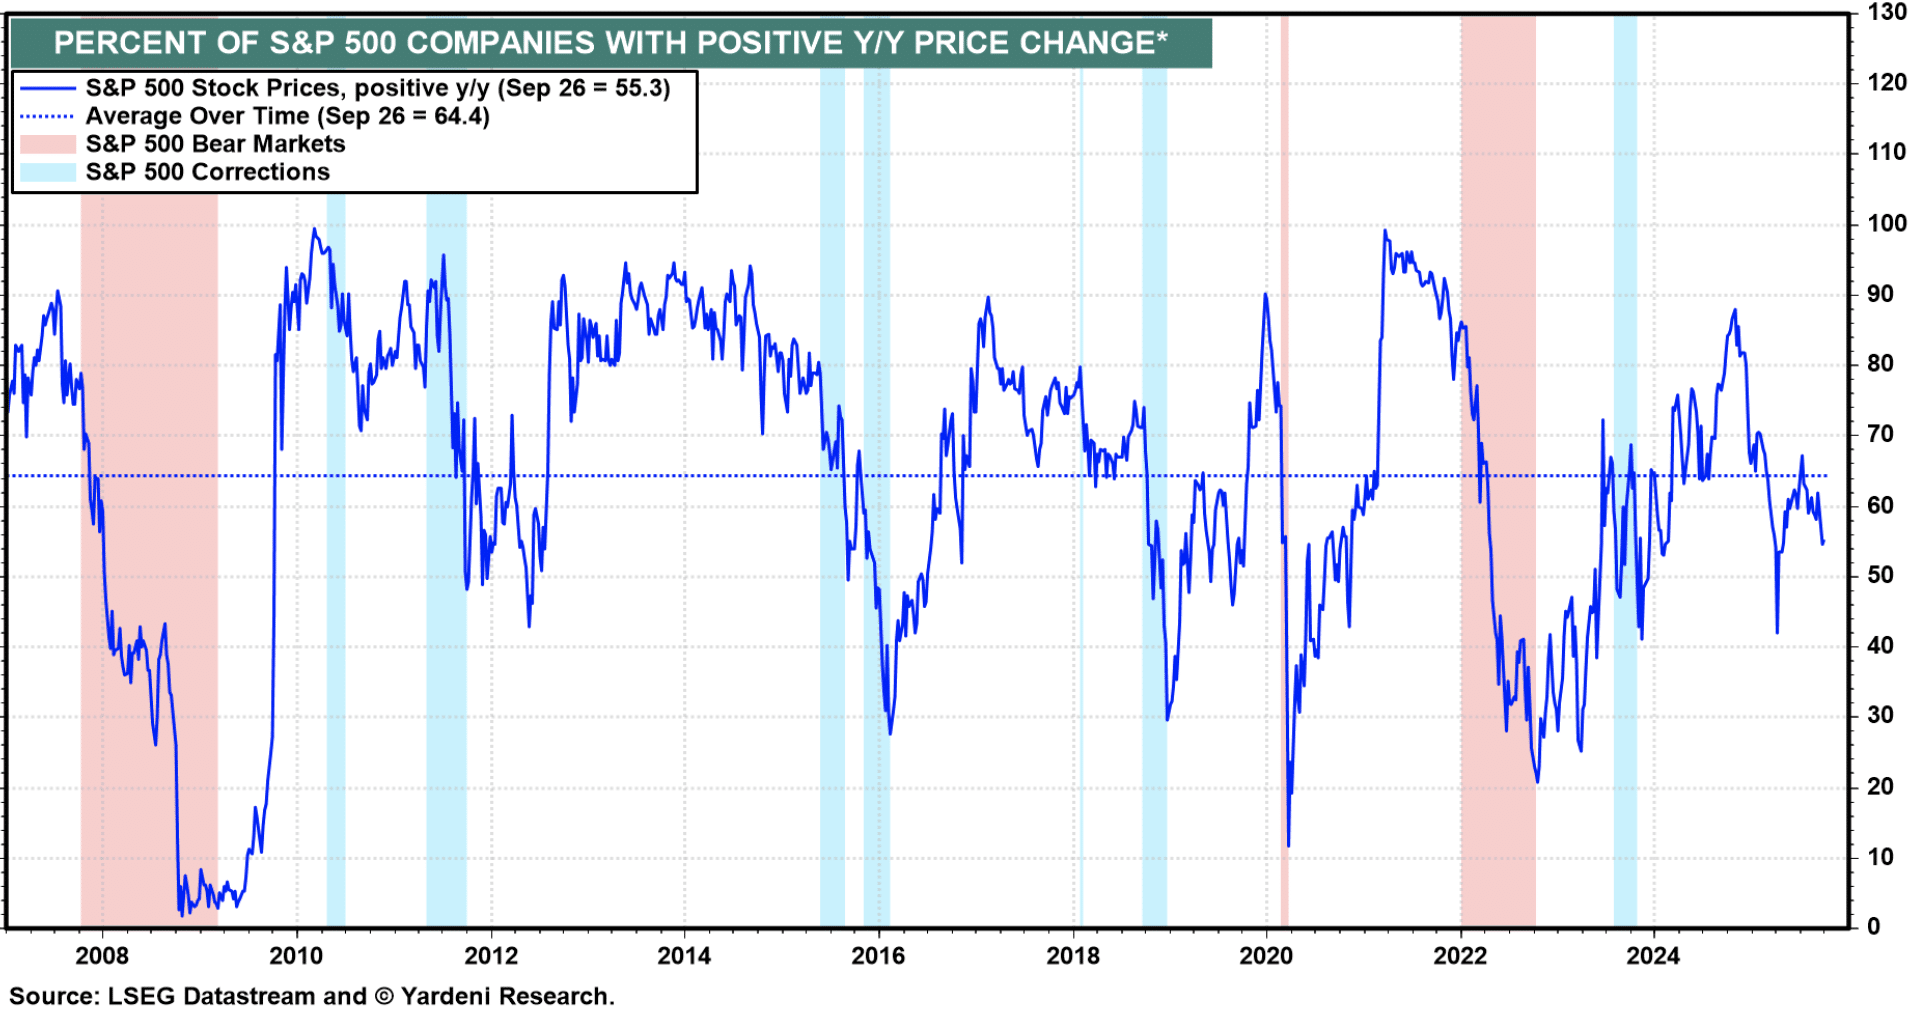
After getting above 65%, the percentage of S&P 500 stocks with positive Y/Y price change has fallen back to nearly 55%. In and of itself, we don’t care other than to recognize that breadth is softening and the greatest of the rally from the April lows is likely in the rear-view market mirror. As such, we are likely viewing this softening of breadth and the extension from the April lows as recognition that leadership stocks/sectors should play a greater role within investor portfolios. Also, less stock-picking and more ETF participation at this stage of the bull market nearing year-end.
The NYSE Summation Index is a key reading on breadth momentum, not just breadth or momentum but the momentum of breadth. This chart had peaked above 900 (triggering our quant signal previously disseminated and depicted below) back in July of 2025.

Since that period, however and despite broadening of the market breadth, the momentum of that breadth hasn’t been as strong, which has resulted in the current technical consolidation trend for the Summation Index. Unfortunately, a recent head-n-shoulder pattern easily identifiable in the following Summation Index chart has also broken below a recent support level, but that may simply indicate future opportunity for savvy investors/traders:
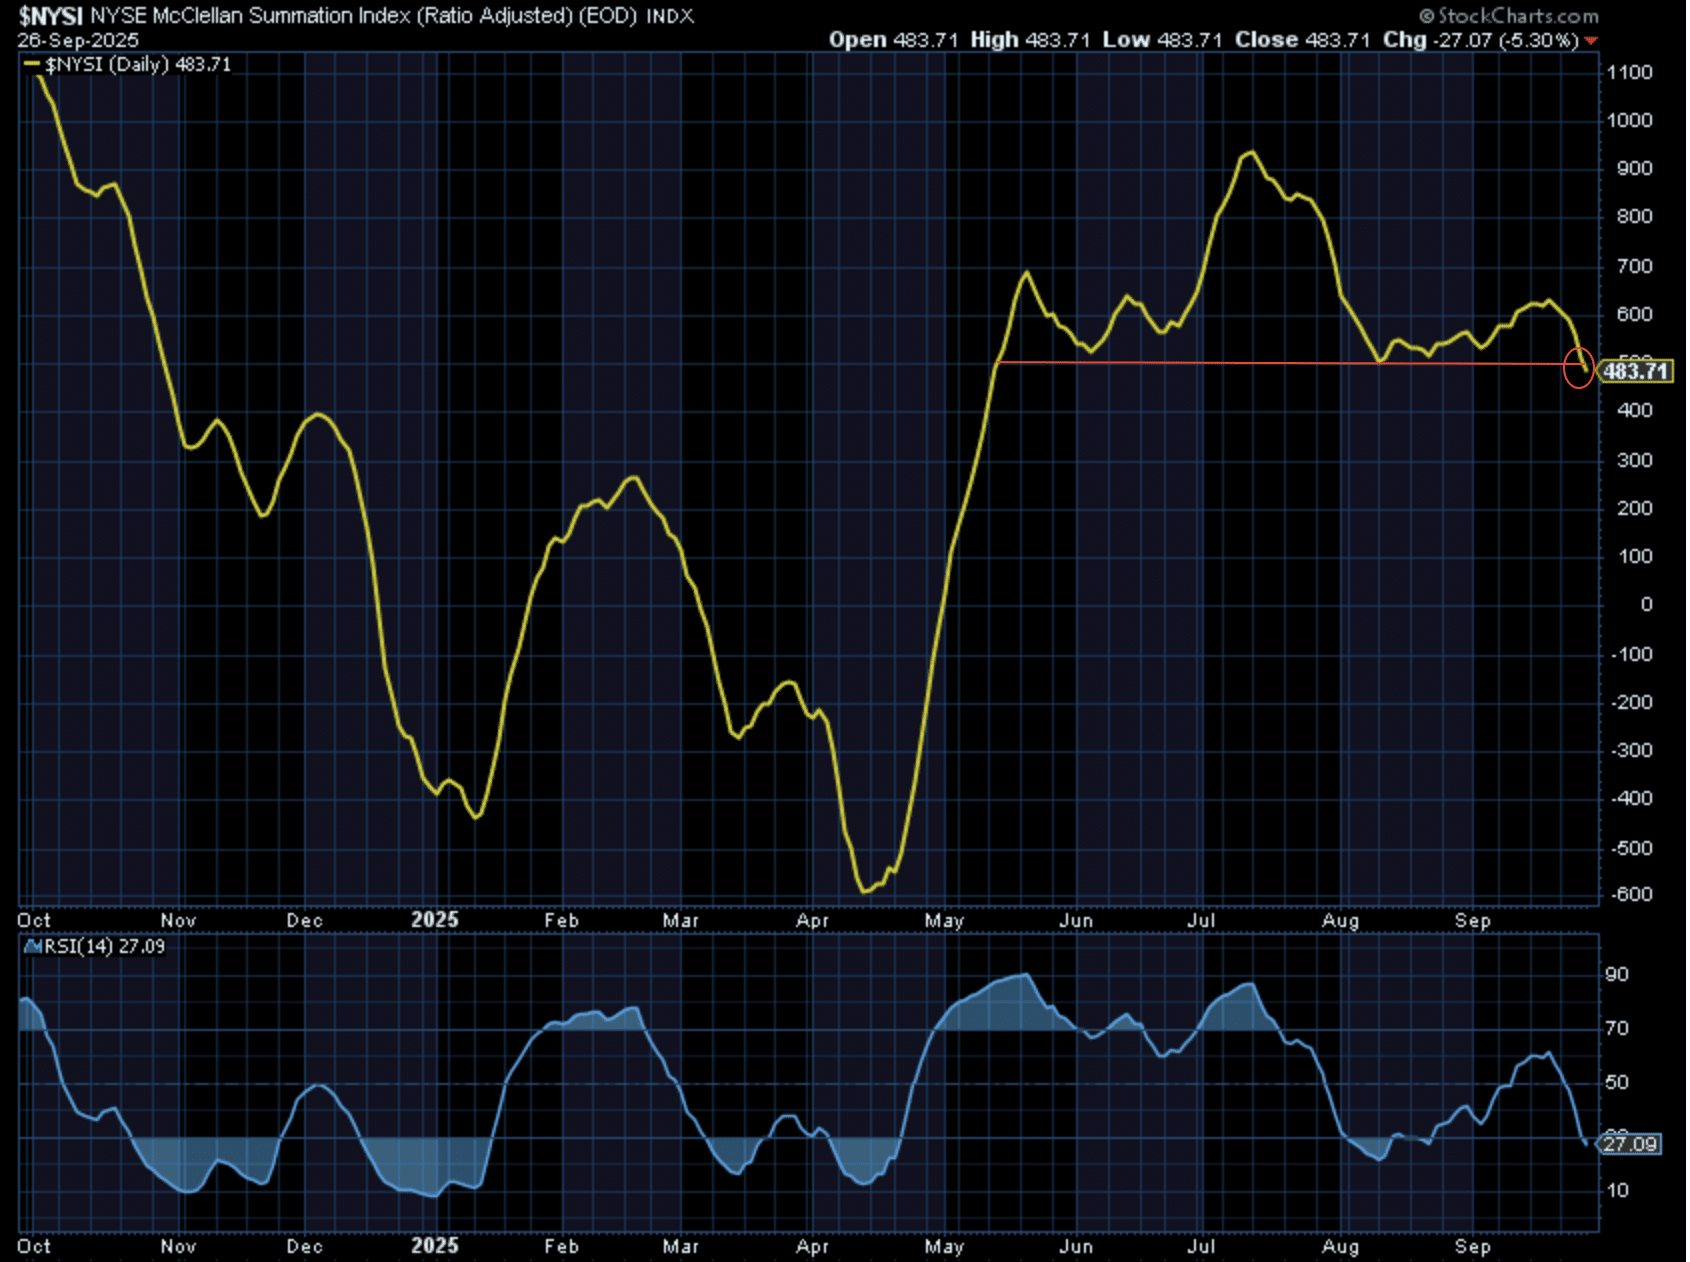
Maybe this will prove a false breakdown in broad-based market breadth momentum? But this is happening even before a government shutdown, which suggests investor exhaustion of sorts. Investors may need to see markets pullback further and with the Summation Index moving lower before valuations prove more attractive and renew the uptrend during the Q4 2025 period. Additionally, that is what certain of the quant data also informs, an exhaustive market move without a meaningful pullback since April.
The so-called oversold conditions or “Savvy Oversold BUY” signals as I like to refer to them haven’t materialized but once during the uptrend. Would I wait for them to materialize? NO!! As stated in past macro-market Research Reports, have a game plan that allows to buy any pullback, including the one that found the S&P 500 down -2% from it’s peak during the week and before rallying Friday. The Summation Index having formerly peaked in July also informs that with it breaking down further, what you buy matters heading into year-end. ETFs over individual stocks that don’t reside in the Large-Cap Growth arena. As previously stated, I’m a seller of small-caps in this rally phase, and will be using that capital to rotate into other areas of the market where I find greater conviction.
It’s important to recognize that the aforementioned game plan to sell the small-cap exposure within the Golden Capital Portfolio is a due to small-cap consistent underperformance since 2000. In other words, it’s a distinction about where I think the capital will be treated better/best. Since I disseminated this game plan, indeed, small-caps have peaked and begun to underperform large-caps.
Bottom line: Leadership is still leadership and at/near all-time highs like the major averages, market participation remains positive, and relative strength is still reasonably strong. With a 5-month win streak afoot, if leadership actually strengthens and disallows a greater pullback, long investors will benefit even if not able to re-leverage for greater market exposure. That’s not something worthy of FOMO feelings, but rather congratulations for riding the bull. Unfortunately, there are pockets of market history where pullbacks of even greater than -3% are avoided for extended periods, but this is why investors should always maintain market exposure and execute a time-tested game plan. Those pockets of relentless upside always end with a significant pullback, after all, but also require investors to express discipline until then… and always. For now, we are broadly allocating for every -1% pullback in the market, as a designated game plan. If the market, as it did recently, pulls back -1% but rips higher thereafter, we are comfortable taking a short term gain and remaining with average exposure since August. That’s how, after a +30% rally from the April lows, “buy any dip” still works for compounding returns, even with lesser leverage.
Direct quote from Finom Group’s “Stepping On Bullish Toes (Hooves)″ Report (September 28th, 2025)
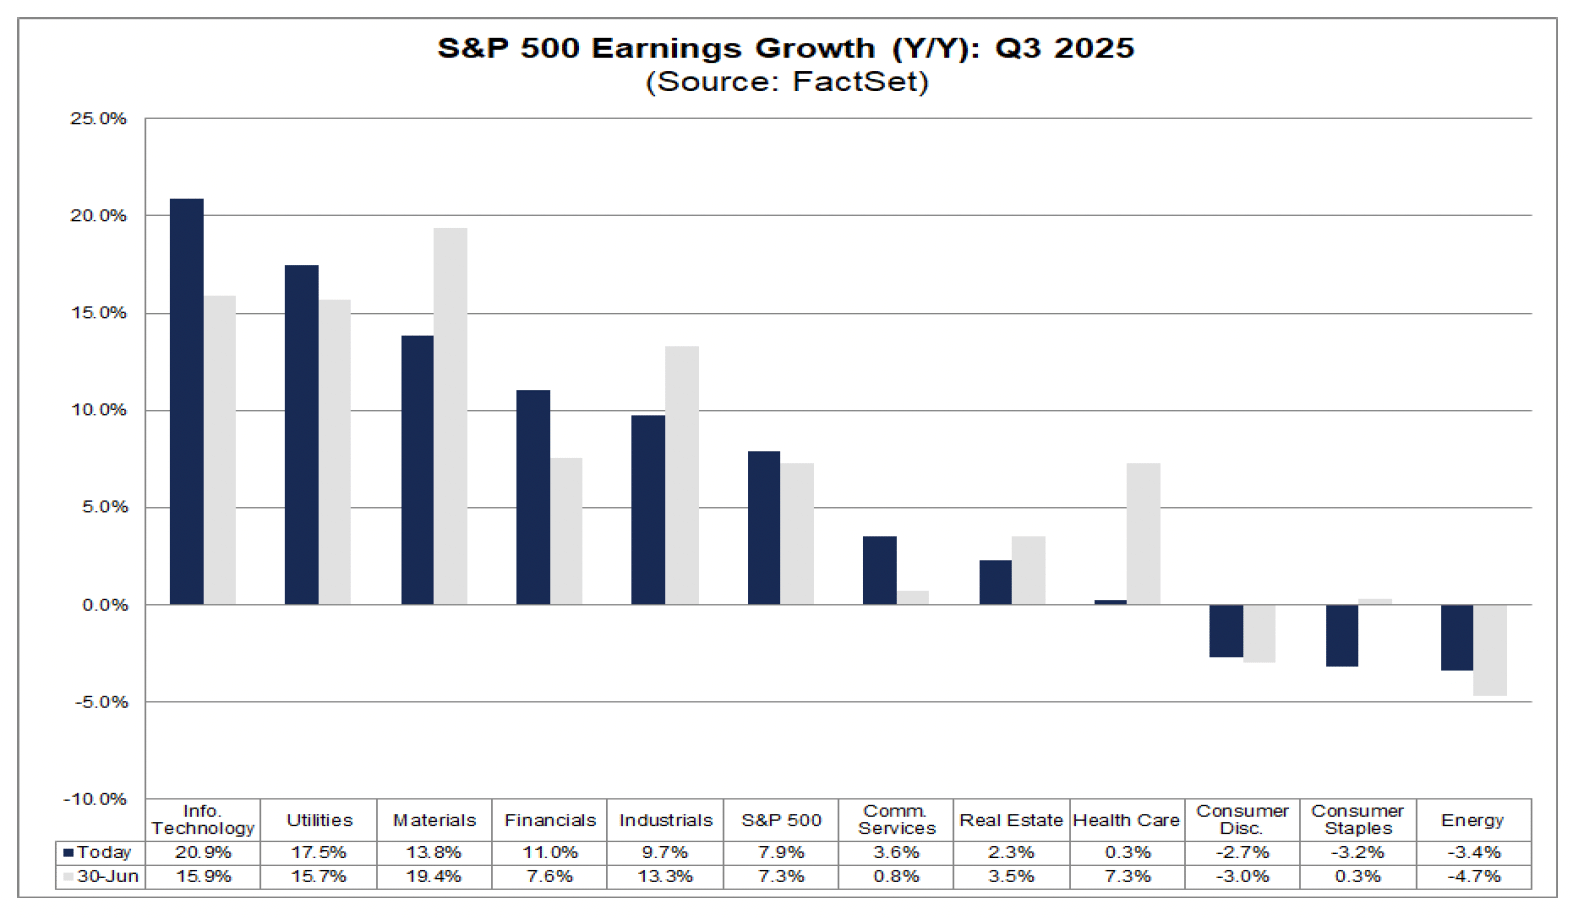
While Technology, Utilities, and Financials sectors have witnessed upwardly revised Q3 earnings estimates, analysts have cut Health Care earnings estimates the most, from 7.3% on June 30th down to just .3% today. With the Health Care sector ETF (XLV) formerly falling to $127s/share in August and on volume not seen since the April technical bear market, we believe this plunge was pricing in such a negative revision to earnings estimates for the sector. Since August, shares had risen all the way to $140 (intraday), and found a ceiling.
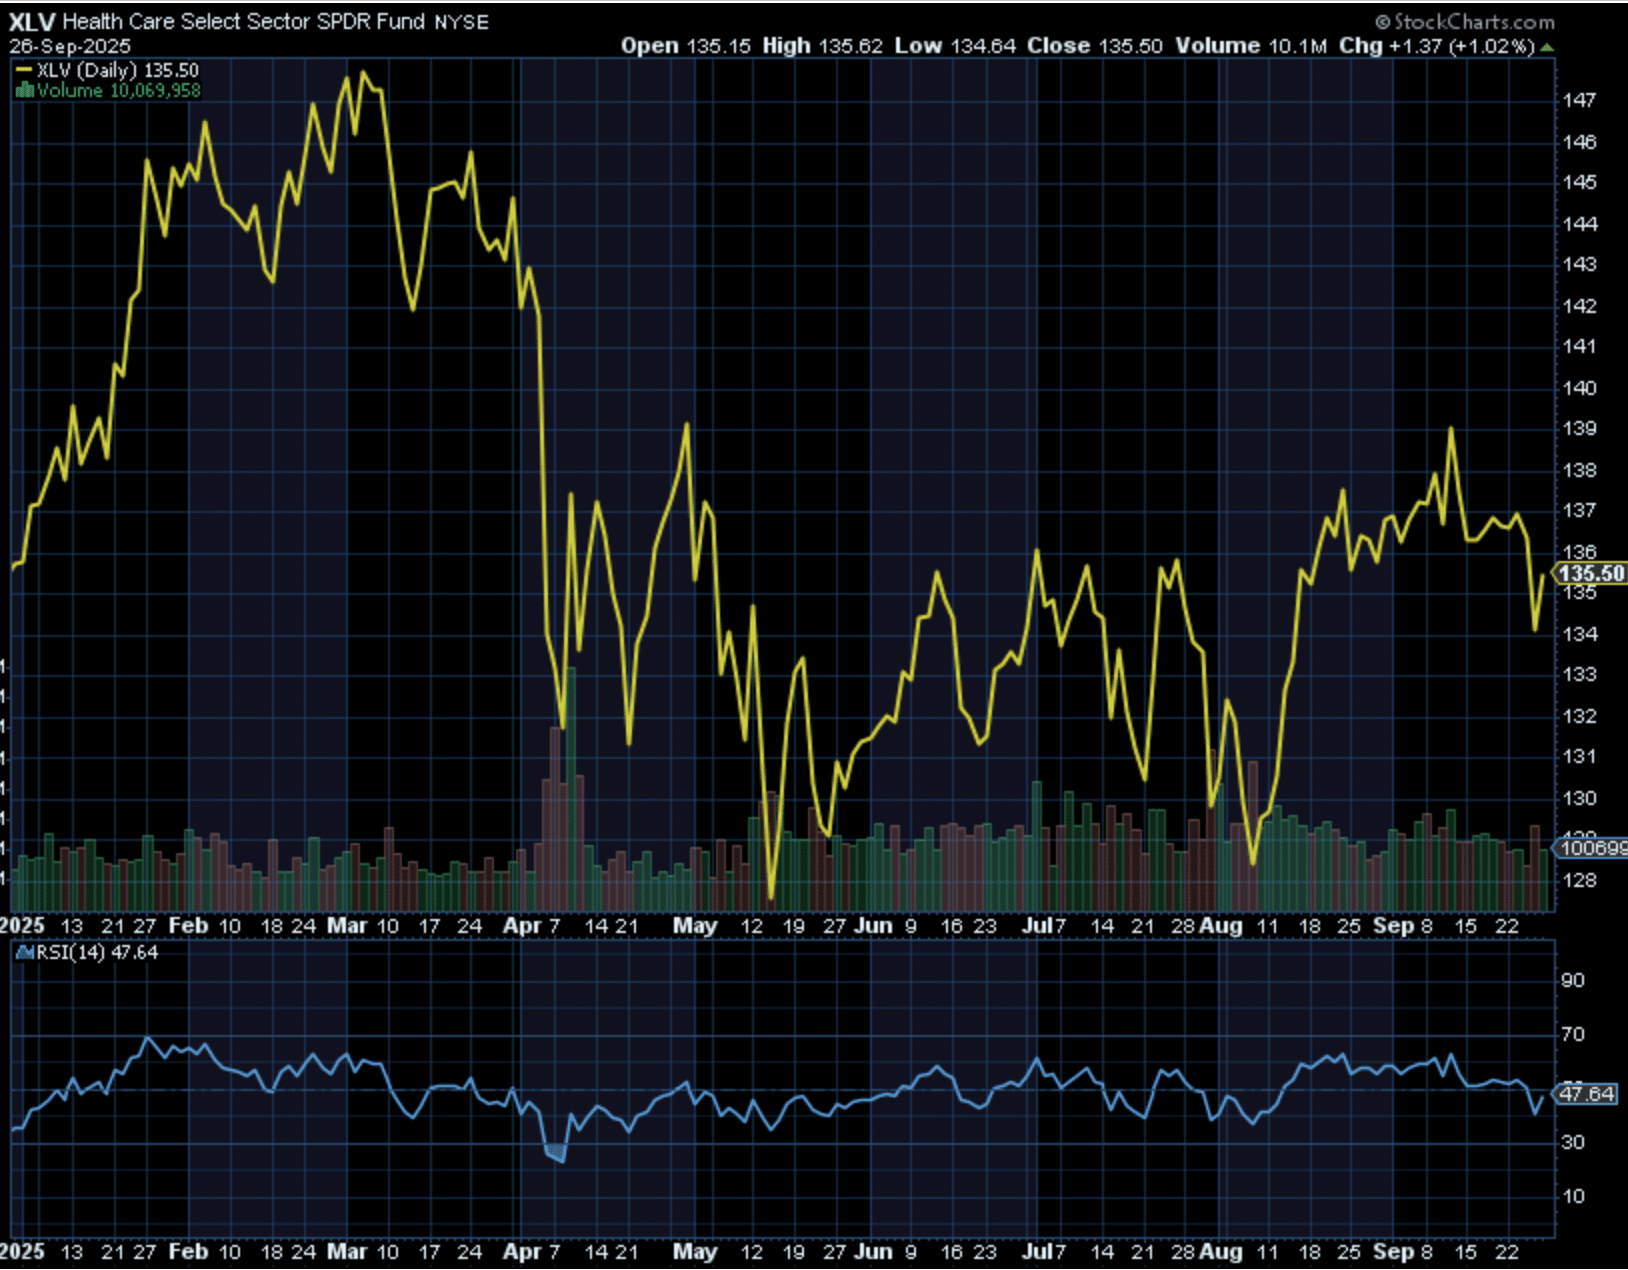
We remain long XLV and believe this area of the market is still an attractive long-term opportunity for investors/traders. Apparently we are not alone in this belief, and haven’t been through much of 2025. Not that it has meant much to the sector to-date, but Insiders have been buying the sector at a hellacious pace in 2025, according to the SentimenTrader Health Care Insider Buy/Sell Ratio chart below.


… This has proven the worst 3-year stretch on record for Health Care continuing through September; Now lagging the S&P 500 by 69% over the period and with its weight in the index dropping from 16% to 9%. The sector was formerly the 2nd most heavily weighted behind the Information Technology sector, and has since moved down to the 5th most heavily weighted sector in the S&P 500. Quite the fall from grace and from fiscal policy impacts.
With the likes of Warren Buffett and David Tepper jumping into the Health Care space via United Healthcare (UNH) equity holdings, the double bottom pattern evidenced in the chart, and briefly breaking above the 200-DMA before price consolidation, the fundamental bar has been dramatically reset lower in XLV. The sector underperformance in 2025 may be setting itself a relative and absolute bottom for which 2026 delivers outperformance. In fact, this is presently the base-case consensus amongst the analyst community.
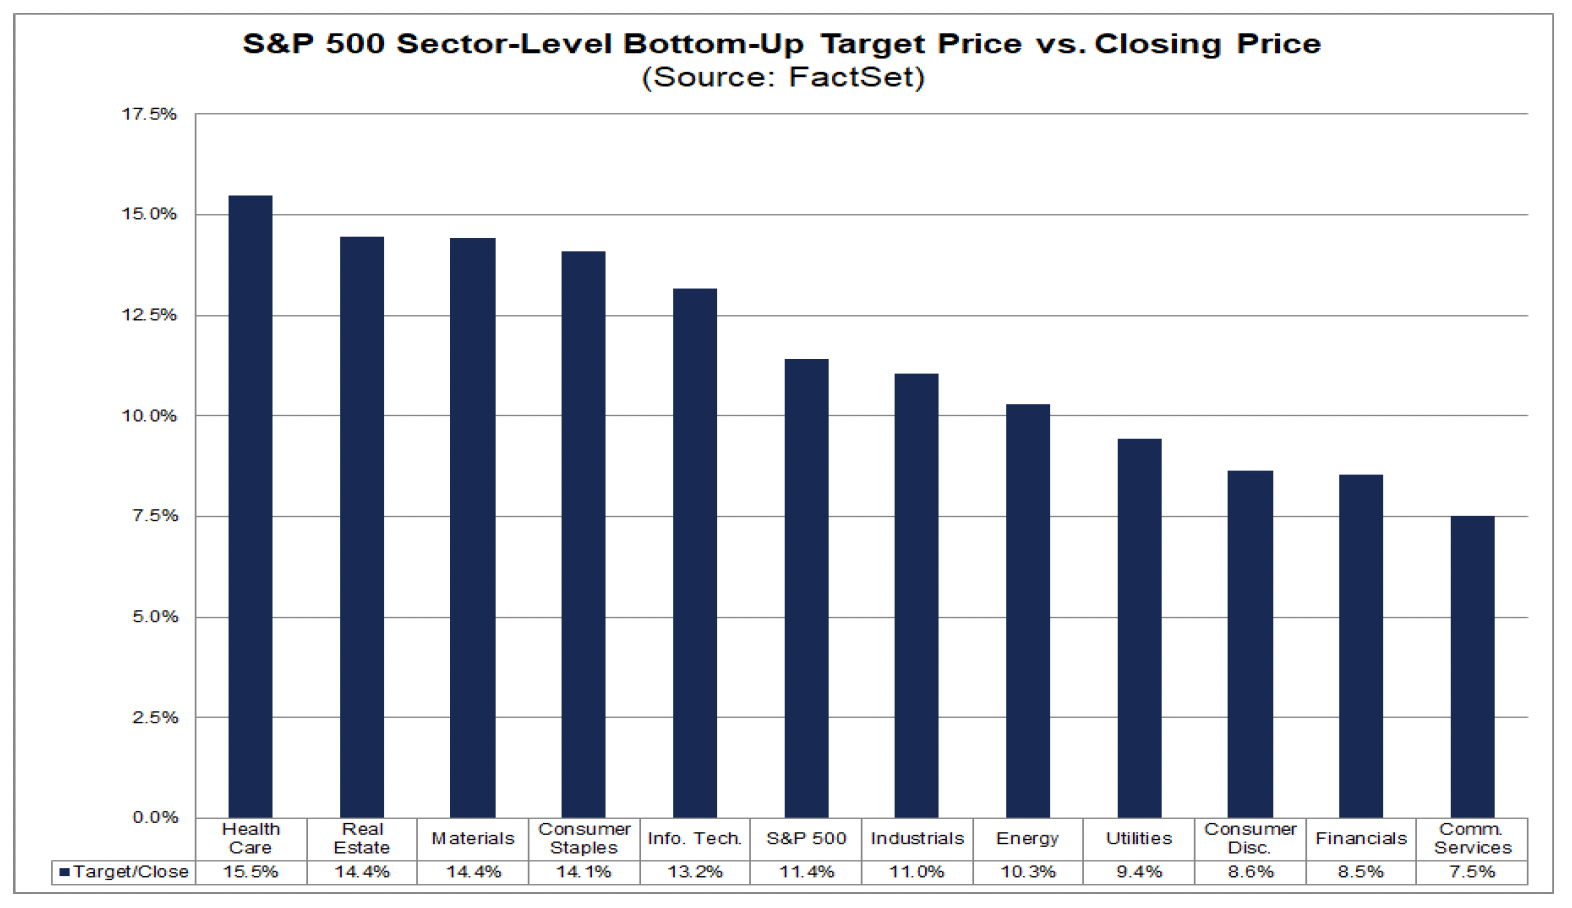
Industry analysts in aggregate predict the S&P 500 will see a price increase of 11.4% over the next twelve months. This percentage is based on the difference between the bottom-up target price and the closing price for the index as of yesterday (September 25). The bottom-up target price is calculated by aggregating the median target price estimates (based on company-level estimates submitted by industry analysts) for all the companies in the index. On September 25, the bottom-up target price for the S&P 500 was 7,358.64, which was 11.4% above the closing price of 6,604.72.
At the sector level, the Health Care (+15.5%) sector is expected to see the largest price increase, as this sector had the largest upside difference between the bottom-up target price and the closing price on September 25. On the other hand, the Communications Services (+7.5%) sector is expected to see the smallest price increase, as this sector had the smallest upside difference between the bottom-up target price and the closing price on September 25.
Regardless of the optimism surrounding the sector’s woeful 3-year performance, we do not believe the sector will outperform through year-end 2025. Savvy investors will likely need to express patience for such performance, while collecting their dividend income. During the current consolidation phase of the cycle, Golden Capital Portfolio is overweight XLV and looking for opportunities to build further the position while dollar cost averaging lower.
Structurally and lastly, we also like the fact that there seems to be great demand for the Health Care sector that isn’t being fully reflected in the share price, while fewer and fewer shares are available. Structurally, this is a net positive trend, whereby the number of shares outstanding are approaching the lowest levels since 2018. This is a widely overlooked characteristic of analysis, which offers investors a different perspective on investing, but one we have highlighted in the past and as recently as February 2025:

Direct quote from Finom Group’s “Stepping On Bullish Toes (Hooves)″ Report (September 28th, 2025)
Wrapping things up, the latest Wayne Whaley quant proves another educational exercise in quantitative analysis. We’ll label this one another strong price trend quant that proves “superfluous”.

“A +10% FIRST 3 QUARTERS OF THE YEAR WITH A POSITIVE SEPTEMBER Since 1950, the first three Quarters of the year are 54-22 for an avg gain of 5.18% on their journey to what is historically an eventual 9.5% year on avg. With two trading days remaining in September, the first three Qtrs of 2025 are up 12.96%. Similar, to 2025, thirty of the previous 75, post 1950, yrs managed to post +10% gains in the first 3 Qtrs of the year. Also worthy of consideration is the fact that with two trading days remaining in September, the S&P is up 2.84% for the month and barring a two-day collapse next week, will finish the month positive. This also falls on the impressive side as September is, on avg, the weakest S&P month of the year, going 35-41 since 1950 for an avg loss of 0.64%. Subsequent 4th Quarter performance in the aforementioned setup tends to validate this observation. Of those thirty, prior +10%, first 3 Qtr starts to the year, twenty also ended up with a positive September. Below is a S&P performance summary for the following Fourth Qtrs in those 20 cases. The two month November-December time frame was 18-2 for an avg gain of 4.81% with two fractional losses leaving the 1% moves 16-0.” ~Wayne Whaley
So with an 80% positivity rate for the whole of the November through December period outlined, why do we label this quant superfluous you might be asking? Do you recall from last week’s macro-market Research Report what the Q4 probabilities are, as a whole, after a positive return in the month of September???

“The S&P 500 is up 3.1% in September so far. When the SPX has a positive September return (Optuma study above), the rest of the year has an 82% positivity rate with an average return of +5.3%. And if that positive September return comes to pass, it will trigger another quant.”
With an 82% positivity rate, simply looking at a positive September return lends a greater positivity rate than the whole price trend quant from Wayne Whaley. Too many quants = too much of a good thing. Let’s just look for the final 2 days of September not to decline -2.84% and if a government shutdown arrives it doesn’t last the whole of Q4 2025. We can then stick with an outlook for the whole of Q4 having an 82% positivity rate for the S&P 500.


