
It was another uneventful day in the markets, with the Dow Jones Industrial Average (DJIA) completely flat on the day, the Nasdaq (NDX) falling nearly .3% and the S&P 500 (SPX) rising just 2 points. The VIX, which had been rising since Monday with hedging activity increasing, anticipating a near term pullback to bring about an uptick in volatility, fell nearly .50 on the day. We can also review the hedging activity via the Volatility of Volatility Index (VVIX).
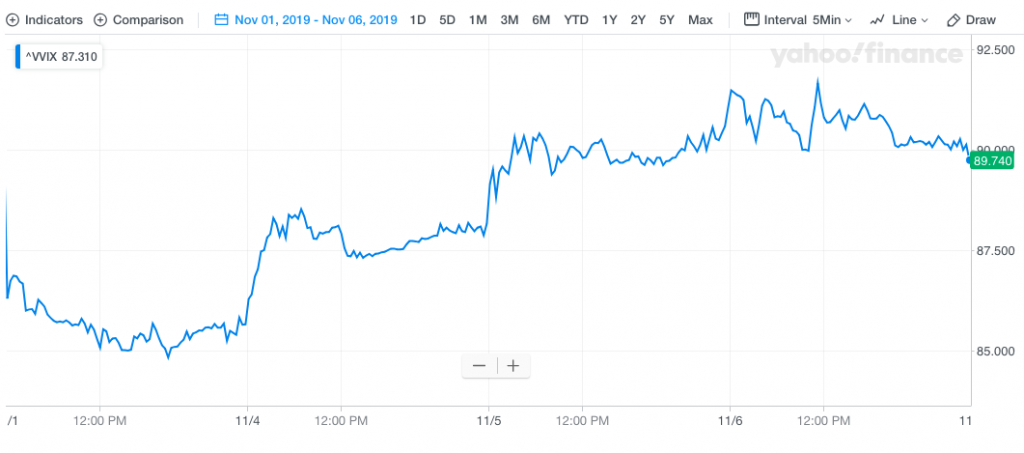
VVIX had been rising, like the VIX, up until Wednesday. VVIX allows for investors and traders to buy and sell VIX options for which it would appear traders were buyers of upside call options for much of the week to-date, as it rose from 85.60 to a peak of 91.74 this week. On Wednesday, however, it seems as if the decline in VVIX was foreshadowing something less than a significant market pullback, like the VIX itself and as both went into retreat on Wednesday.
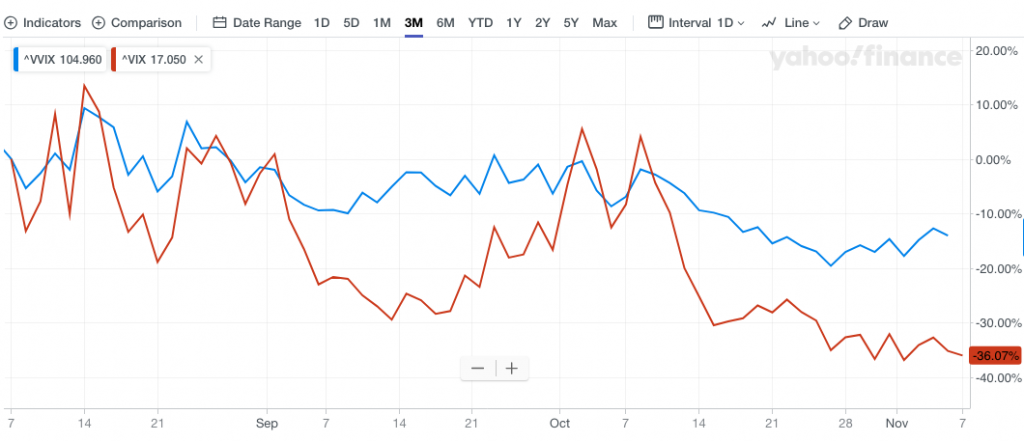
When suggesting that VVIX may have been foreshadowing something to come we can never be too sure. VVIX tends to be a “leading indicator” of sorts for the VIX itself; it tends to front run the VIX’s coming directional move, as depicted in the chart of both volatility indices below:
A good many folks will lay claim to the forecasting ability of the VIX using charts and technical analysis. We strongly suggest this is a faulty claim given the very derivative nature of the VIX and the totality of the VIX complex of trading structures/instruments. Derivatives all have a primer, something for which the derivative reacts or “derives” it’s motility/processing in the case of financial market instruments. In other words, the VIX and its various trading instruments aren’t independent. The VIX is a stochastic oscillating process that calculates the buying and selling of .SPX options to formulate a 30-day implied volatility value.
- The CBOE Volatility Index, or VIX, is a real-time market index representing the market’s expectations for volatility over the coming 30 days.
- Investors use the VIX to measure the level of risk, fear, or stress in the market when making investment decisions.
Based on everything mentioned and not mentioned (mainly historical data), the VIX defies the typical efficacy one would expect to achieve through technical analysis on stocks. These investment vehicles are not derivatives, they are independent. Nonetheless, many traders still find themselves of the belief that they can chart the VIX for predictive outcomes. But to what end…? Seeing how one can’t even trade the VIX, but rather it’s many derivative instruments further down the derivative chain from .SPX options, how does this even help a trader? And based on what we know from the calculus of the derivative chain rule/s.
- The chain rule states that the derivative of f(g(x)) is f'(g(x))⋅g'(x). In other words, it helps us differentiate *composite functions*. For example, sin(x²) is a composite function because it can be constructed as f(g(x)) for f(x)=sin(x) and g(x)=x².
In other words, the further out on the derivative chain we go, the less effect the primer has on that particular derivative. Some of the VIX derivatives are VIX Futures and VIX-Exchange Traded Products (VIX-ETPs). The VIX-ETPs are constructed from a blend of short-term VIX Futures, largely 30 and 60 day VIX Futures (m1/m2). We might offer the VIX derivative chain to follow the order:
- SPX>.SPX options >VIX>VIX Options>VIX Futures>VIX-ETPs
Given the outline of the derivative chain, a VIX-ETP such as UVXY or TVIX would be 6th degree derivatives. Recall what we offered with regards to technical analysis. The further out on the derivative chain we go, the less effect the primer has on that derivative. Moreover, the derivative characteristics simply don’t lend efficacy for technical analysis given they have little independence. Because VIX-ETP’s are derivatives comprised of short-term VIX futures, a chart of the VIX-ETP can’t help one define the current relationship between the 30-60 day VIX futures. Additionally, a chart of the VIX-ETP can’t define the contango or backwardation status of the VIX Futures Term Structure at any given moment. And lastly, a chart can’t identify any potential imbalances that reside within the VIX-ETP from time to time that may affect the share price, which can also be affected by after-market rebalancing of the VIX-ETP. But again, and with all that being said and defined, many will attempt to perform certain degrees of technical analysis on the VIX and its many derivatives.
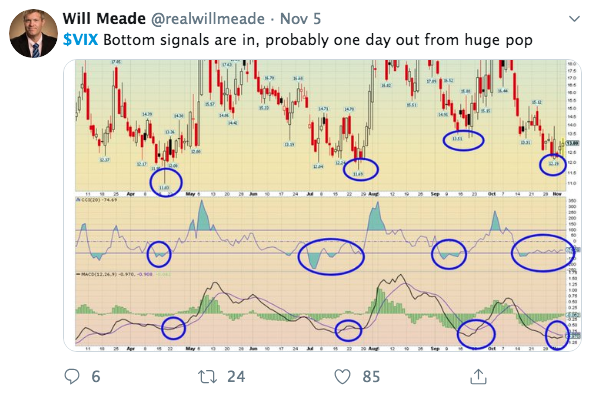
The best way to use technical analysis on the VIX is to simply identify peaks and troughs within a VIX regime/trend. The VIX tends to move from one regime to the next. Most regimes last anywhere from 6-12 months. For much of 2019, each time the VIX has fallen in to the 12% range, it has bounced higher. If using this VIX regime analysis for hedging probabilities, there remain the issue of extrapolating the regime analysis and correlating it to a VIX derivative for trading purposes. The chosen trading derivative won’t express the same move as the VIX itself. The VIX can move rather quickly, as it is the closest to the aforementioned .SPX Options, primer. But VVIX moves slower and VIX futures that much slower than the VIX. For all the aforementioned reasons and definitions, most traders lose money on their hedges, even if the underlying for which the hedge is executed loses value. Entry, exit and premiums for hedges make it extremely difficult to profit from a hedge or for that hedge to do what it was intended to do. Moving on…
In speaking of the VIX and market volatility, the VIX and technical analysis of the VIX can’t tell one when the U.S. and China will complete a phase 1 deal. The VIX can’t predict the next positive or negative trade headlines such as that which was released overnight.
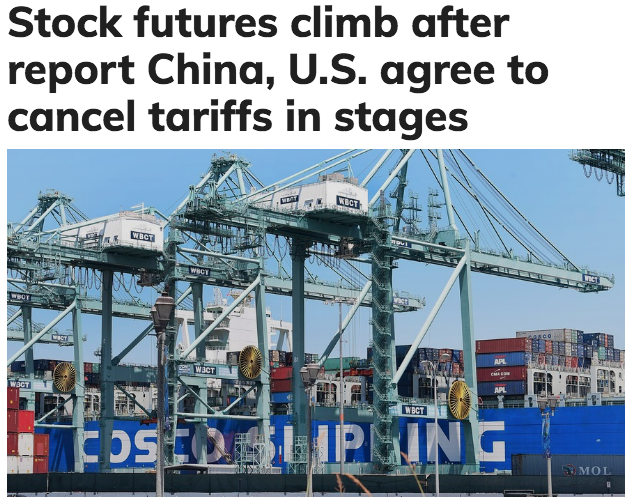
It appears as though the phase 1 deal has indeed taken longer, as the rolling back of tariffs is in play. Finom Group’s Seth Golden had hinted at this probability in the Finom Group Trading Room recently, suggesting that Trump’s re-election is front of mind in trade talks going forward.
“I don’t think Lighthizer, Navarro or Mnuchin are running the show on trade anymore. They’re present and performing the negotiations, but I think President Trump is taking his advice from Larry Kudlow. The global economy has weakened enough to affect U.S. economic growth going forward and due to the protracted trade war. The President needs a strong economy to win reelection and Larry Kudlow is keenly aware of this fact. He knows what has plagued global and domestic economic growth and he knows what can remedy it; retracting trade barriers initiated through the tariffs and sanctions that created the 18-month trade war. Kudlow has the President’s ear, because he’s probably connecting the trade war dots to the U.S. economy in order to sum up the probabilities of reelection for President Trump. I wouldn’t be of the opinion anything is more important to President Trump than reelection as his loyalties to any one policy have often been proven fleeting.
The best way to stoke the global and domestic economy would be to repeal some of the tariffs, at least the September tariffs and progressively repeal others based on whether or not the 2 parties abide by the phase 1 deal.”
An incumbent president has historically suffered in election years when the economy is struggling, though there have been only two formal recessions during election years since World War II. Harry Truman and Jimmy Carter ran for reelection in the same year as a recession. Truman won; Carter lost.
By other economic measures, a weak economy does hurt an incumbent president’s chances. The University of Michigan Consumer Sentiment Index helps track consumer views on, and expectations for, the economy. Over that survey’s history back to the mid-20th century, it has “largely” found that “if the index is low, the incumbent doesn’t get reelected,” said Richard Curtin, director of surveys of consumers at the University of Michigan.
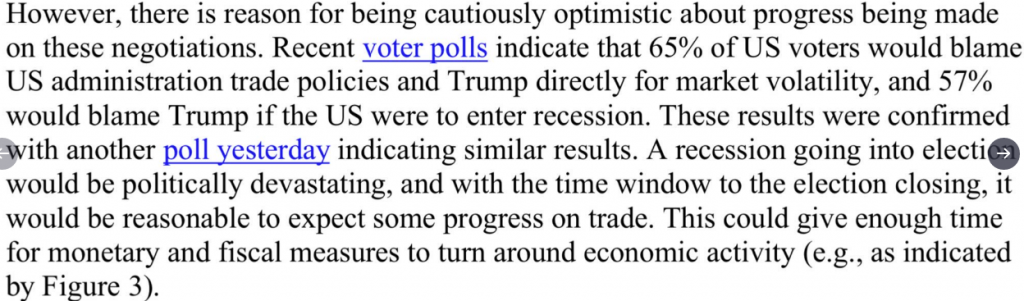
Back in September, a J.P. Morgan survey poll showed Trump is under pressure on trade, adds that a recession would be “politically devastating” and says, as a result, we could see “real progress” with China and “a more sustained rally.”
The latest positive trade headlines seems to come on the heels of progress being made on a key White House initiative aligned with trade. President Trump has long since held China responsible for the U.S. fentanyl crisis. But now we see China making headway on this key trade issue. A Chinese court sentenced nine fentanyl traffickers Thursday in a case that was a culmination of a rare collaboration between Chinese and U.S. law enforcement to crack down on global networks that manufacture and distribute lethal synthetic opioids.
Working off a 2017 tip from the U.S. Department of Homeland Security about an online drug vendor who went by the name Diana, Chinese police busted a drug ring based in the northern Chinese city of Xingtai that shipped synthetic drugs to the U.S. and other countries from a gritty clandestine laboratory. They arrested more than 20 criminal suspects and seized 11.9 kilograms (26.23 pounds) of fentanyl as well as 19.1 kilograms (42.11 pounds) of other drugs.
With the overnight trade headlines identifying the probability of a phase 1 deal to include repealing certain tariffs, equity futures are on the move higher once again. This, even as the EU slashes its growth forecasts for the Eurozone economy Thursday, citing global trade tensions are set to weigh on the region and limit economic expansion. Woops!
The warning from the European Commission comes at a time when the European Central Bank (ECB) has started a new round of stimulus to spur economic growth in the region.
“The fact that growth is no longer expected to rebound meaningfully in the next two years is a major shift compared to previous forecasts and is based on the assessment that many features of the global slowdown will be persistent.
Most importantly, the surge in trade tensions and record-high uncertainty about trade policies is likely to have inflicted lasting damage to world trade.”
The Commission slashed its economic forecasts for the euro zone in 2019 and 2020, as reported by CNBC. The 19-member region is now set to grow at a pace of 1.1% this year and 1.2% in 2020. In its previous forecasts, out in May, the European Commission had estimated a 1.2% growth rate for the euro zone in 2019 and 1.5% for 2020.
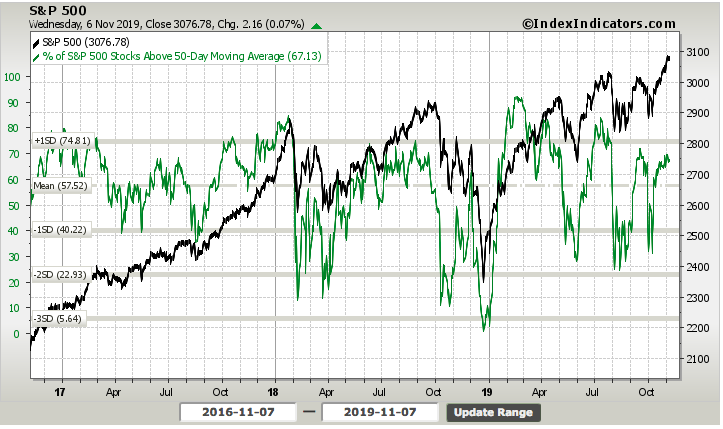
Coming into Thursday’s trading session in the U.S., markets look to once again set record highs. it remains to be seen when a pullback presents itself, as market breadth/internals have weakened a bit week-to-date. When we review the percent of stocks trading above their 50-DMA, the percentage has fallen from 69% at the start of the week to 67% through Wednesday’s close.
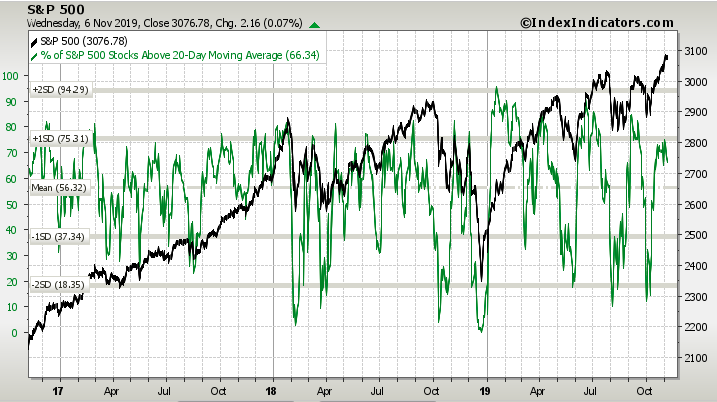
Akin to the weakened breadth identified in the study above, the percentage of stocks trading above their 20-DMA has also weakened. Coming into the trading week, the percentage of stocks trading above their 20-DMA within the S&P 500 was roughly 74.5 percent. As of Wednesday’s closing bell, the percentage of stocks trading above their 20-DMA resides at roughly 66 percent.
The economic data calendar is a bit light this week and that is probably a good thing, as investors focus their sights on a market pullback. Even so, the latest reading of the ISM non-manufacturing index proved better than expected when it was reported on Tuesday this week. The Institute for Supply Management’s said its non-manufacturing index rose to 54.7% last month from a 52.6% reading in September that was the weakest in three years.
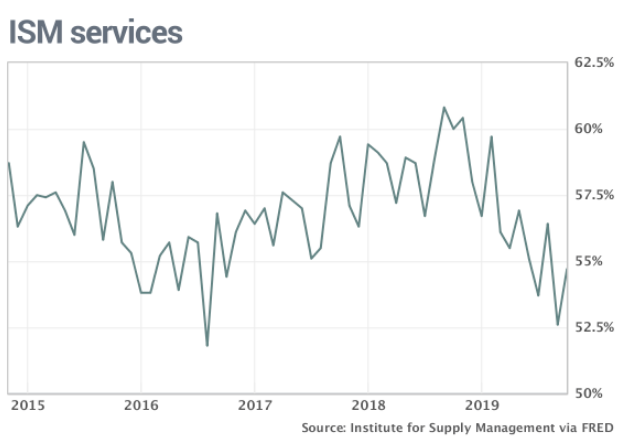
New orders and employment levels both improved. The index for new orders climbed 1.9 points to 53.7 percent. The employment gauge rose 3.3 points to 53.7% from a five-year low in September. Altogether, 13 of the 17 industries tracked by ISM said their businesses were expanding, the same as in the prior month.
Outside of the ISM data, the remainder of the week will not likely find significant economic data that proves market-moving.
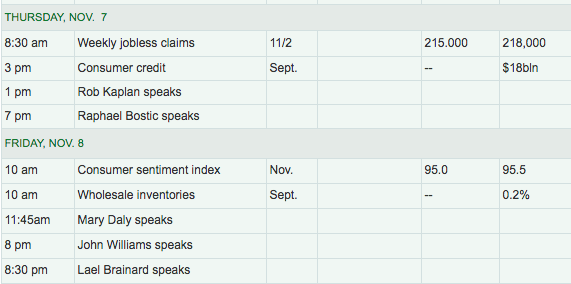
Fed speakers are clearly out and in force this week. After the recent rate cut and the FOMC signaling a pause in future rate activity, Fed speakers are found in the headlines once again, as investors and economists desire to better understand what could or would force the Fed to once again adjust rates higher or lower. With many focused on the Fed’s longstanding support of economic growth and now a rate pausing cycle afoot, Lisa Shalett Chief Investment Officer, Wealth Management at Morgan Stanley had offered the following notes to clients:
I think the recent Fed decision matters. Below are three reasons investors should pay attention to the likely pause in rate cuts:
- Treasury futures markets have priced in additional rate cuts, indicating that investors expect more than one additional cut through next year. If the Fed doesn’t reduce interest rates further, the yield curve, an important economic indicator based on government bond market prices, could flatten. That, in turn, could make some stock investors rethink positions they took based on expectations for more rate cuts and faster economic growth ahead.
- Stock valuations could be too high. One reason stocks have risen this year is that equities are often valued based on their ability to earn more than the benchmark Treasury yield. If rates don’t fall as low as investors have anticipated, stocks may need to be repriced. Earnings growth is now slightly negative year over year and positive earnings gains rely on economic growth, which may not materialize. At the recent all-time high, S&P 500 stocks were priced at 18.5 times forward earnings, a historically high level. I expect markets to remain directionless for at least the next couple of months.
- The dollar may be stuck in a range against a basket of foreign currencies. Prospects for additional rate cuts have contributed to a weaker dollar, a positive for U.S. exporters, commodity prices and the many emerging market nations that issue dollar-denominated debt. With the Fed pause, the dollar is likely to stay in the current range.
“It’s not just the dollar. I expect U.S. stock and bond markets to remain directionless for at least the next couple of months, now that the Fed monetary policy lever is apparently halted for now. Investors must rely on economic and earnings improvements to drive further gains. Until those improvements materialize, actively-managed funds, not index funds, are likely to be the stronger performers.”


