
Welcome to this week’s State of the Markets with Wayne Nelson and Seth Golden. Please click the following link to review the SOTM video. In this week’s episode we discuss the the 5-week long S&P 500 rally to record highs. Analysts and strategists have revised higher their year-end and 12-month price targets. Other analysts are revising their global economic output with favor as trend tensions ease and a trough in global PMIs is foreseen. Recession fears were only heralded a few short months ago and now appear to be fading. With positive sentiment and market breadth improving, the risk to the market are now outside of the fundamental arena and are more concentrated on sentiment and breadth. Please review the supporting graphics and bullet points that accompany our State of the Markets video!
- J.P. Morgan remains overweight equities, underweight bonds.
- Unwinding its gold hedges, “based on signs of a cyclical recovery, easing geopolitical tensions, synchronized monetary easing, and defensive investor positioning across asset classes.”

- Fundstrat Tom Lee: “Raising S&P 500 YE Target to 3,185.
- Santa Claus rally + ISM inflection + positioning.
- Don’t sell this rally.
- Stocks are cheap. And arguably EPS could be $188-$190 if industrial cycle accelerates as we expect.”
- Chetan Ahya, chief economist at Morgan Stanley has been raising the warning flags over trade issues and a weakening global economy for the last couple of months. He recently suggested a “Lehman moment” is awaiting equity markets.
- “We view risks of further escalation as meaningful. If the U.S. raises tariffs on all imports from China to 25% and China makes a matching response, with those measures staying in place for four to six months, we believe that the global economy will be in recession in six to nine months.”
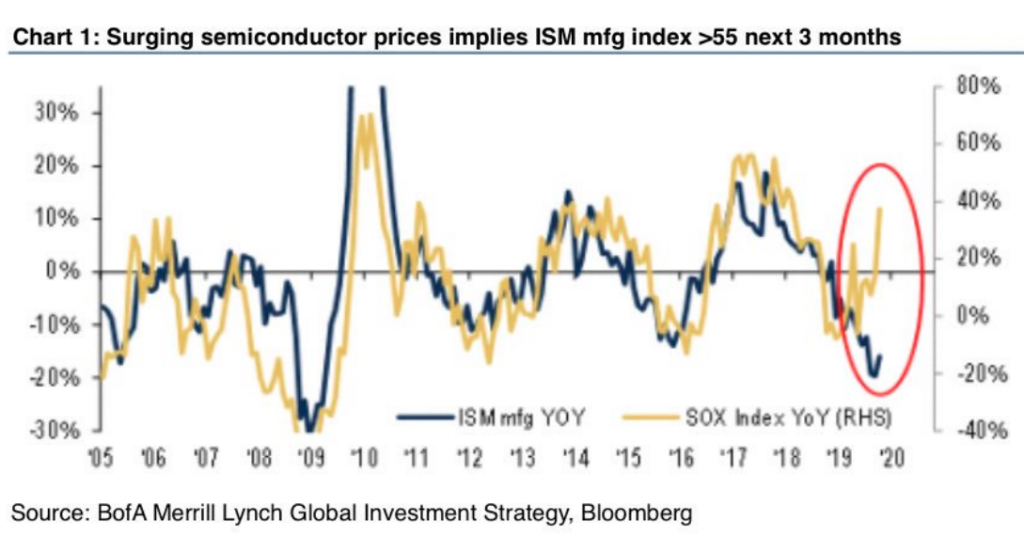
- BAML: “We are bullish macro…surging semiconductor prices implies ISM mfg index >55 next 3-months.”
- BAML: “We are bullish markets…but credit + rising yields = Q1 2020 top in markets.”
- null
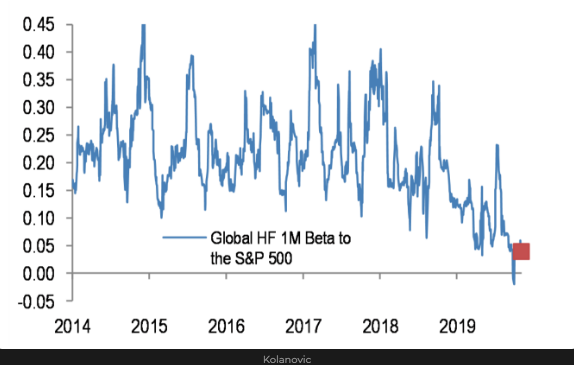
- Positioning: Hedge Fund beta equity beta close to record low.
- Hedge Funds’ equity exposure remains near record lows, despite the market at record highs.
- Different vs latest net exposure data from other banks – and of course a mega bullish datapoint / observation.
- Andrew Thrasher: Top down analysis starts with STRUCTURE. This is comprised of breadth measurements, which provide analysts the opportunity to evaluate the level of participation by individual stocks, sectors, industries, etc. Stock market is a market of individual stocks and what those pieces are doing dictates the long-term trend of the whole market. When we have good breadth (growing participation) of stocks moving in the same direction as the overall market then its often safe to assume that trend will continue. This goes for both rising and declining trends.
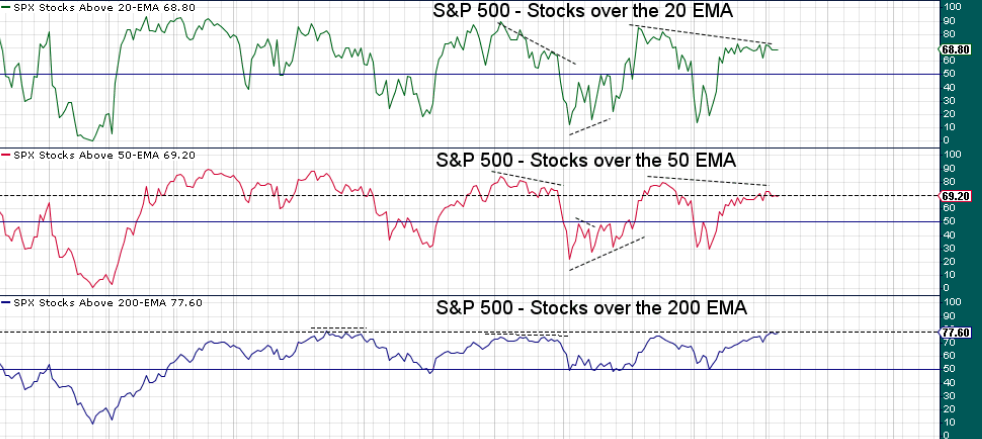
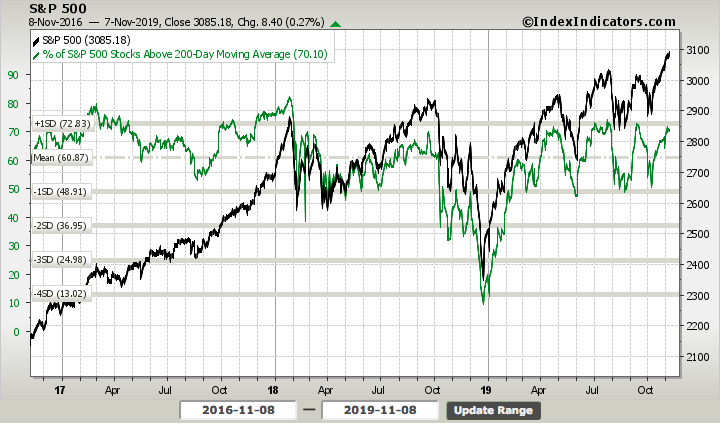
- When the individual components of the market begin to breakdown, the structure becomes threatened.
- The timeframe for the resulting impact can varying greatly, it’s like playing a game of Jenga. As more pieces are pulled from the base and placed on top, the tower grows but becomes more and more unstable. You can’t know for sure which piece pulled will result in it coming crashing back down to earth, but a casual observer can recognize the instability being forced upon the tower. With each decline in breadth causing a wider spread or divergence relative to the market, the trend becomes threatened just as the Jenga tower becomes less stable.
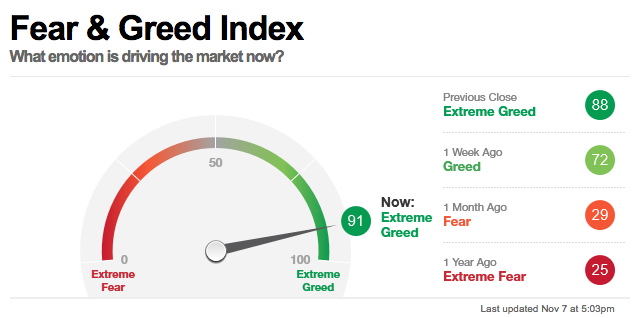
- SENTIMENT ANALYSIS: There are many different pieces of data that attempt to shine a light on the sentiment of the investing public.
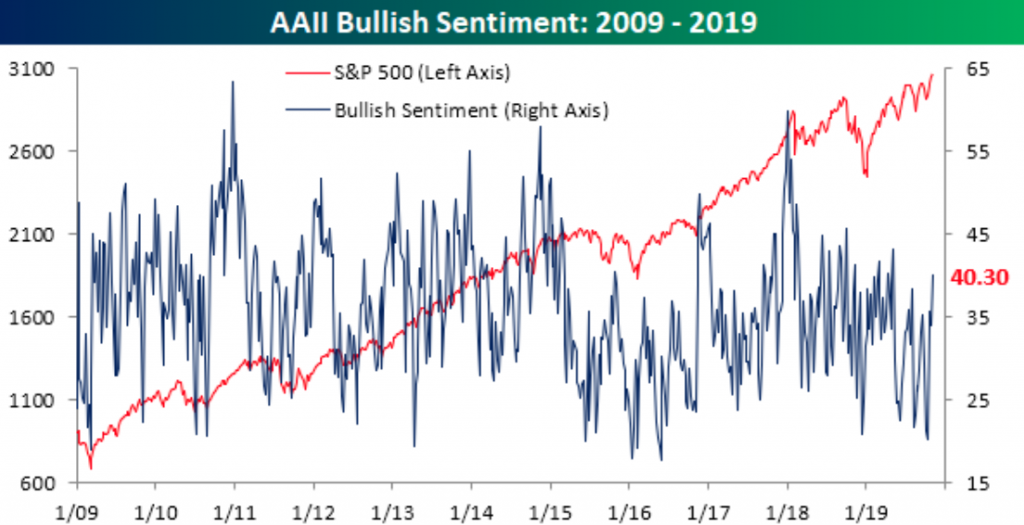
- In the past four weeks, bullish sentiment has surged nearly 20 percentage points. That is the largest increase in a four-week span since a 22.9 percentage point increase from December 2017 to January 2018: (Bespoke Investment Group)
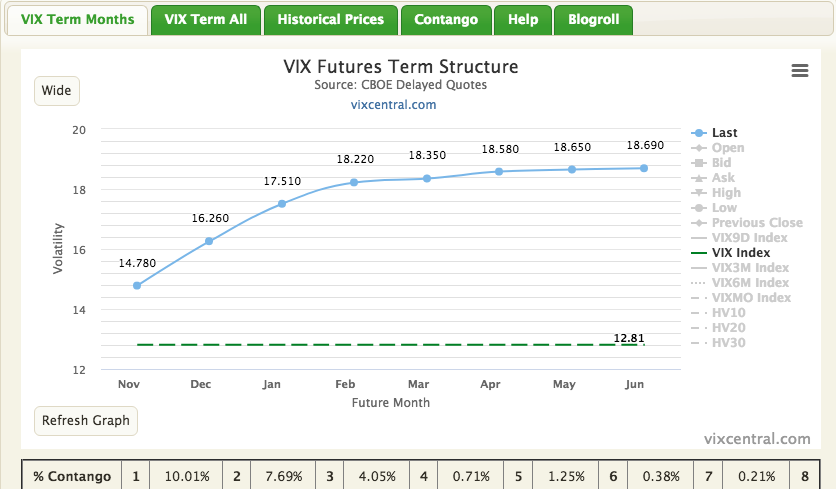
- “In a normal market environment volatility futures contracts 3-months out will trade at a premium to the current contract as the curve is upward sloping. The range of that premium can vary widely, and that spread can lift the veil on investor sentiment. When the spread is high then the market is either over-pricing long-dated volatility or under-pricing short-dated volatility.”
- We’ve seen the release-value of excessive sentiment move the markets lower often from 5 to 10 percent. A recent example was January 2018 when the S&P 500 DSI score got north of 90% and the spread between the 1-month and 3-month volatility breached 3 points. The S&P eventually declined by 10% over just a few trading days, bounced, tested the initial low and then moved back to new highs.
- CHANCE OF RECESSION IN NEXT 12 MONTHS AT 40%, VS 75% A FEW MONTHS AGO – DOUBLELINE CAPITAL’S HSU
- Ray Dalio: “The U.S. economy is taking a turn for the worse and there’s a 40% chance America could experience a recession before the 2020 presidential election. I think that in the next two years, let’s say prior to the next election, there’s probably a 40% chance of a recession.”
- Nordea: Missed this last week. NFIB labour data. Job openings have started to drop in a way historically only seen in recessions. But long live FOMO.
Seth Golden: Can’t count the number of times you’ve offered such analysis with “only seen in recessions” over the course of the year. $STUDY
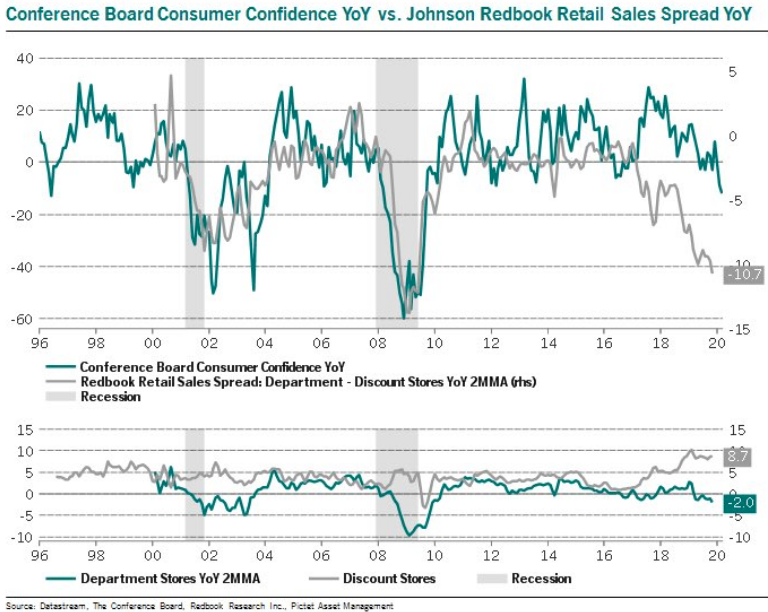
- This is truly remarkable. U.S. department store retail sales are down -2% YoY, lowest since Sep ‘08. At the same time, discount store retail sales are absolutely booming, up 8.7% YoY! The divergence started to build in Q1 ’17. The current -10.7% spread is the widest since Nov ‘08.
- Thanksgiving, the traditional kick-off of the U.S. holiday shopping period, falls on Nov. 28 this year, a week later than last year’s Nov. 22, leaving retailers with six fewer days to drive sales between Thanksgiving and Christmas day.
- The last shortened shopping season was in 2013.
- Mastercard, which measures consumer spending across all payment types including cash and checks, expects U.S. retail sales, excluding automobiles, to grow 3.1% from a year ago between Nov. 1 and Dec. 24.
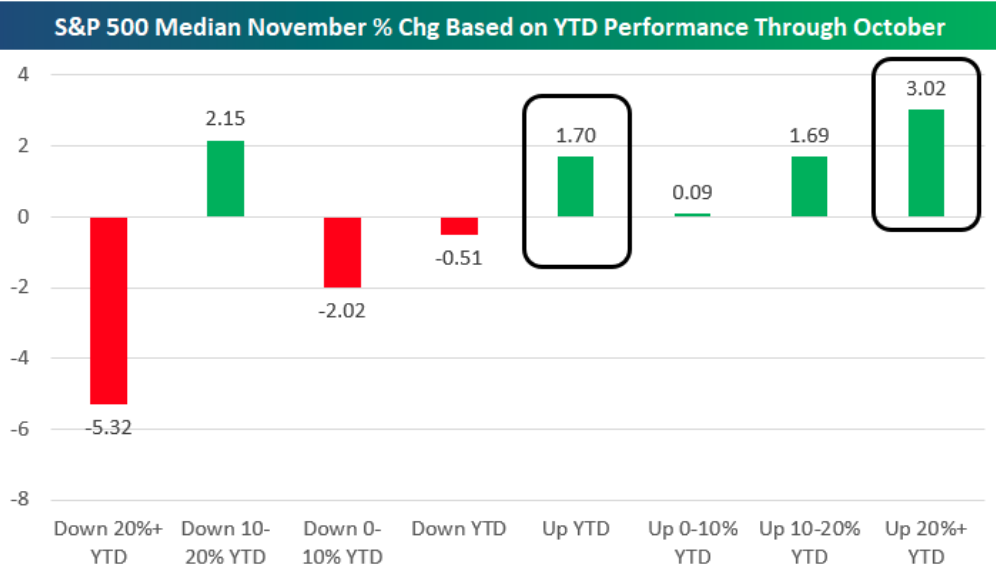
- Gains beget gains when it comes to end-of-year performance.
- Novembers have been the most positive when the S&P is already up 20%+ YTD coming into the month.


