Equity markets are responding as one might expect given the flight to safety as perceived by the recent bid in treasury markets around the globe. On Tuesday, bonds took a significant leg higher, pushing yields lower and with the U.S. 10-yr. Treasury yield breaking below 2.27% on the day. Additionally, the 3-mnth./10-yr. Treasury inversion spread peaked on the day at roughly -.08 bps., the greatest inversion of the current cycle. Given the aforementioned we aim to review the occurrence through a historical lens so as to determine the probabilities going forward. In short, is the inversion bullish or bearish and over the next 12-month period?
Here’s what happens next to the S&P 500 (SPX) when the 10 year – 3 month yield inverts -0.08% for the first time in each economic expansion.
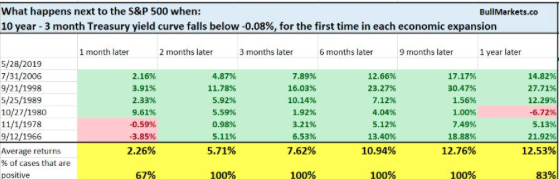
Based on the study by Bullmarkets.co, the occurrence tends to be more bullish than bearish. Even so, history does not always repeat and with market evolution we are often finding market liquidity paradigms shifting probabilities of market performance.
Recent yield curve inversions have been quick and shallow, and these occurrences are common later in economic cycles, according to LPL Financials’ research and positioned chart below:
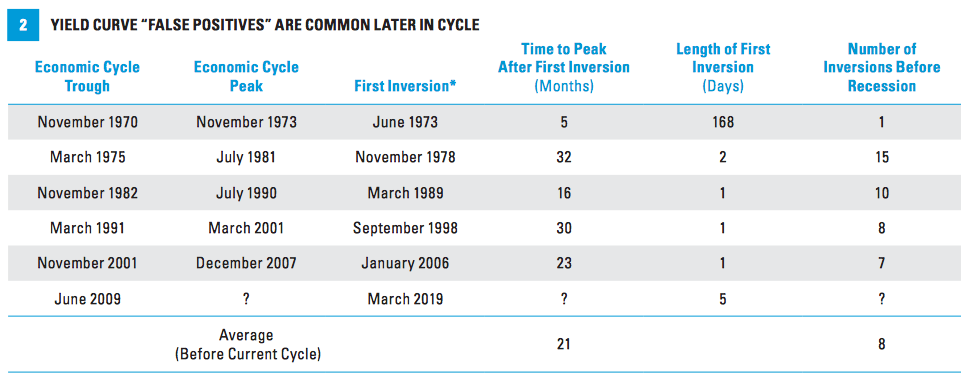
The 3-month and 10-year yield spread typically flickers between positive and negative several times before the U.S. economy peaks, which has happened an average of 21 months after the first inversion. We’ve seen three “false positives” so far in this cycle, the latest being two one-day inversions on May 13 and May 15.
Historically, the spread between the 3-month and 10-year
yields
has become much more predictive of a recession at -50 basis points (-.50%). In
the 10-year-long 1990s expansion, the economy peaked seven months after the
3-month and 10-year yield spread fell to -50 basis points in August 2000. In
the most recent expansion, the economy peaked 13 months after the 3-month and
10-year yield spread fell to -50 basis points in November 2006.
Equity markets finished sharply lower and at their lows of the day on Tuesday. This is a rarity for 2019 and something demanding attention given the probability of the S&P 500 to break below 2,800 for the Wednesday trading session. Tuesday was the first time this year that the S&P 500 was up at least 0.5% intraday but finished the day down at least 0.5 percent. The downturn has been stimulated from a continuation of the trade feud between the U.S. and China. The temperature on trade elevated in recent weeks and on Tuesday with China evaluating the rare earth minerals industry as a means to retaliate against the United States imposition of tariffs on China’s exports.
Chinese officials recently cautioned that products made from rare earth minerals should not be used against the country’s development. The comment, reported by CCTV, was taken as a thinly veiled threat aimed at the U.S. and its technology companies that are dependent on the materials. Chinese President Xi Jinping recently visited rare earth mining and processing facilities, adding to speculation that China could make the minerals more expensive or unavailable if the trade war continues to expand. At present, China is the world’s largest producer of rare earths, a critical component in the manufacturing of products ranging from smartphones to electric vehicles. https://www.cnbc.com/2019/05/29/rare-earth-miners-shares-rise-after-china-threatens-to-cut-off-supply.html
So how deep with the market correction become? A crystal ball for which to see into the future is beyond any investor’s reach, but make no mistake about it, during a market drawdown the bears will ring the loudest bell and make for sensationalistic headlines. In reviewing the Q4 2018 drawdown, one must rationalize the causation for possible resolution of that or any drawdown. In Q4, we recall the drawdown was largely “manmade”. The finger could be squarely pointed at the FOMC’s rate hike and messaging delivered to the market, insinuating an autopilot path for future rate hikes and balance sheet runoff activities. The market took the measures and messaging as a signal that the FOMC would drive the economy straight into a recession by tightening too quickly and withdrawing market liquidity; a manmade crisis developed.
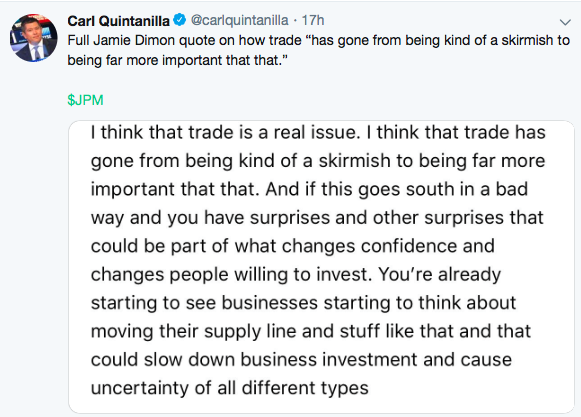
As it was in Q4 2018, the same manmade crisis has presented itself to investors, markets and the economy. It’s for this reason that the market is attempting to price in the worst-case scenario: “Selling now and asking questions later.” The manmade crisis of today is the escalation of the trade war between the U.S. and China, for which the potential for additional tariffs is looming over the economy and pervading business sentiment.
Sentiment is a driver, not the driver, for the economy and when businesses perceive economic and financial conditions to be favorable, they spend more. When economic conditions are perceived to be poor and financial conditions tighten, business spending is curtailed. It becomes a self-fulfilling prophecy in the sense that an economic downturn can be brought to life based on human psychology and not something more fundamental to the economy itself. In the present situation, market and economic fundamentals are captured by the manmade threat of trade feuds, not consumer demand. By all accounts, consumer demand and even consumer sentiment has remained resilient and strong in the face of elevated trade tensions.
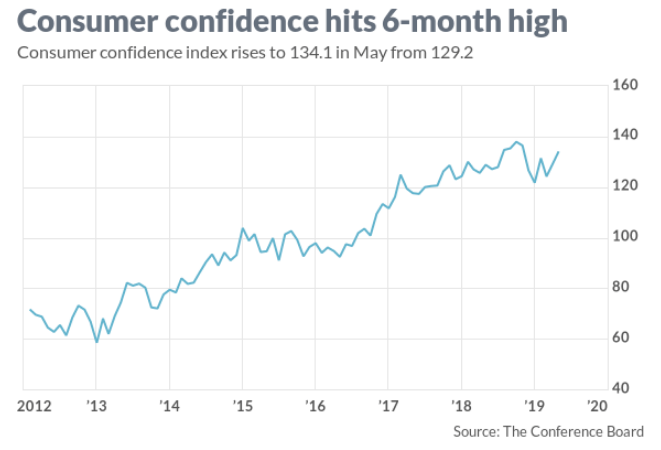
The consumer confidence index climbed to 134.1 from 129.2 in April, the Conference Board said Tuesday. One caveat: The survey results were mostly compiled before trade talks between the U.S. and China suffered a big setback. Nonetheless, the elevated levels of consumer confidence provide a base of support for any near-term economic downturn or slowing of economic growth, which is expected.
A separate survey that asks Americans how they view the economy in the present rose to an 18-and-a-half-year high of 175.2. The last time the index was higher was in December 2000. Another index that tracks how consumers expect the economy to behave six months from now rose to 106.6 from 102.7. The post-recession peak is 115.1, which was set last October.
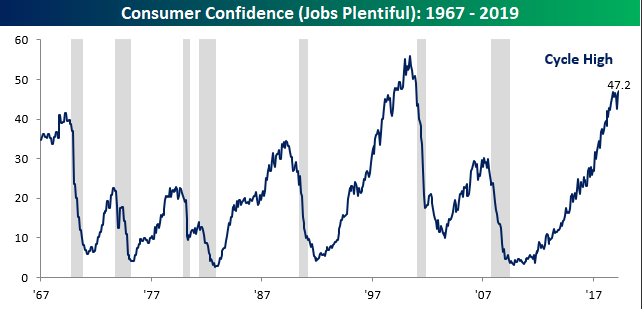
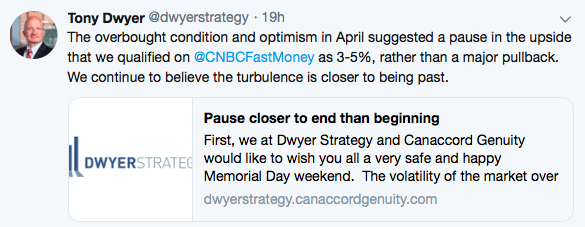
Consumers haven’t been this positive about their job prospects since 2001. A robust jobs market can fuel more consumer spending and keep the economy expanding at a steady clip, but lingering trade tensions will continue to act as a restraint on growth. When the facts change, the market takes to changing valuations according to a risk premium paradigm. Presently, the facts have changed from the prospectus of a trade deal to the possibility of a protracted trade feud. And to reference our former question: How deep with the market drawdown become, here is what Canaccord Genuity’s Tony Dwyer had to offer on Tuesday.
For Wednesday, equity markets are lower in Europe and U.S. equity futures are pointing toward additional selling pressure, with bond yields also lower on the day. There is no economic data of consequence on tap in the U.S. this Wednesday and as such we evaluate the current state of economic conditions within the expansion paradigm. Growth is undoubtedly slowing on a YoY basis, as expected. When we review the Leading Economic indicators (LEI), calculated from 10 individual indicators, including weekly jobless claims, manufacturers’ new orders, building permits, and stock prices, facts determine that a recession is not imminent. Nonetheless, we also find that manufacturing continues to be the greatest drag on LEI.
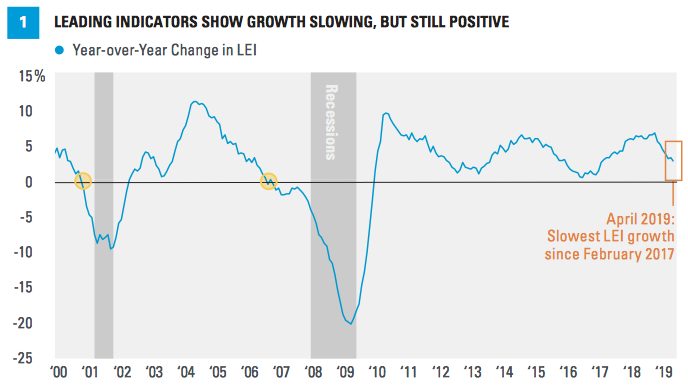
The LEI rose 2.7% year over year in April, its 113th straight increase. Because of this, we see the LEI as a “green light” for economic growth. April’s reading was its slowest pace of year-over-year growth since February 2017. In the past two LEI readings, only 2 of 10 components were net drags on the index: the Institute for Supply Management’s New Orders Index and new orders of nondefense capital goods. At the end of each of the past four economic cycles, more than half of the LEI components were in decline. Trade uncertainty has weighed on business and consumer demand over the past several months, so weakness in manufacturing-related indicators isn’t surprising.
As mentioned previously, when market drawdowns are at-hand, the bearish voices reign supreme, serving to provide the panic needed to create larger drawdowns. It’s not surprising that with the market set to break below 2,800 we recently heard from Morgan Stanley’s Mike Wilson, who formerly warned investors to “get off the bull” back in January. The S&P 500 ran another 10% and achieved record highs post the warnings. Nonetheless, Wilson was recently issuing warnings once again on Tuesday.
Renewed trade tensions and a slump in economic data — ranging from falling durable goods and capital spending to a downshift in the services sector — has put U.S. profits and economic growth at risk, Morgan Stanley warned Tuesday.
“Recent data points suggest US earnings and economic risk is greater than most investors may think,” wrote Michael Wilson, the firm’s chief U.S. equity strategist.
Wilson highlighted a recent survey from financial data firm IHS Markit that showed manufacturing activity fell to a nine-year low in May. That report also revealed a “notable slowdown” in the U.S. services sector, a key area for an American economy characterized by huge job gains in health care and business services.
“In addition, numerous leading companies may be starting to throw in the towel on the second half rebound–something we have been expecting but we believe many investors are not.”
It remains to be seen if Wilson’s latest warnings on the economy will come to fruition. What we can probably agree on is that the outcome is dependent on the future path of global trade. Will the self-fulfilling prophecy develop further or not?
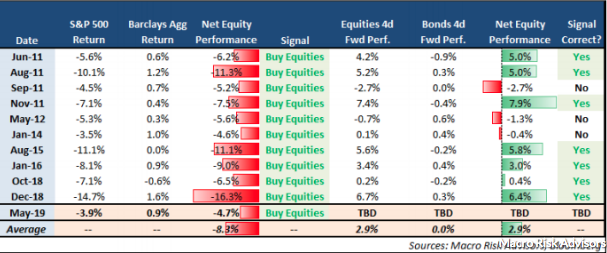
With the May drawdown in equities and bond yields, a near-term bounce for equities may present itself, especially if the White House Administration strikes a more “dovish” and conciliatory tone on trade. But even without such a stimulant for equities, a bounce may come as soon as Friday, according to Vinay Viswanathan and Max Grinacoff, strategists at Macro Risk Advisors. Historically, since 1989, when bonds outperformed the stock market by more than 4%, equities rallied by 2.1%, on average, heading into month-end.
They noted the spread between equity and bond returns is the fifth most negative of the last five years and that the average month-end rise for equities rises to 2.9% when measured over the last 10 occurrences (See table below).
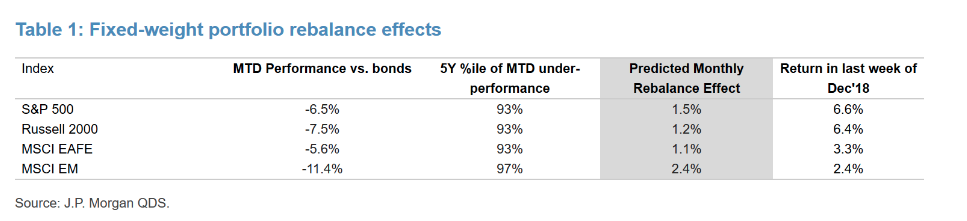
Quantitative analysts Bram Kaplan and Marko Kolanovic of J.P. Morgan, in a note last week, recalled how the stock market’s large underperformance in December, which culminated in a Christmas Eve rout that marked the S&P 500’s closing low for the fourth-quarter selloff, led to a sharp equity rebound from Christmas to New Year’s Eve.
Also, like in December, the final week of May is holiday-shorted, making for a “somewhat condensed” rebalance trade. Kaplan and Kolanovic said they expect rebalances by fixed-weight asset allocation portfolios to offer a tailwind to stocks this week. They offered the table below for the potential price impact based on their model.
It is usually the case that we can’t predict the future and as such we use history as a guide to offer the probabilities for the market moving forward. Presently, Finom Group is of the opinion that the market will look to achieve 2,750 on the downside and with a heightened level of market volatility. Nonetheless, we also aim to trade whatever the market delivers and as we view the market drawdown as an opportunity. In past weeks we had offered to subscribers the benefit of raising cash and developing a shopping list of stocks/ETFs to acquire in layered fashion should a pullback occur. It’s with this preparedness that we continue to trade the markets as we did within the context of rising volatility on Tuesday and as demonstrated in the following trade alert:
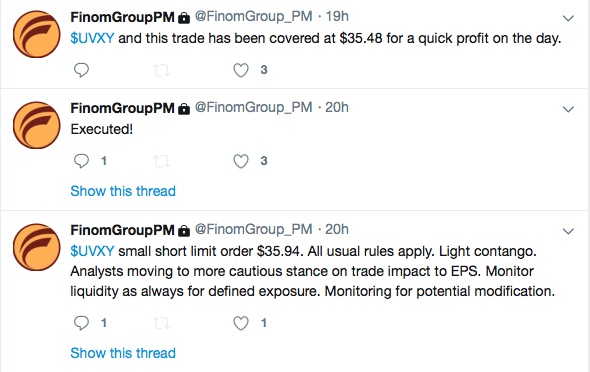
We will likely continue to define and exact like trades in the coming days and/or weeks should our expectation of increased volatility come into focus. With that in mind we look to continue to trade the Volatility complex. Recall the more recent bout of volatility earlier in May found VIX-ETPs rising quickly and alongside the VIX. On May 13th SPX was at 2,811 and UVXY was at $44.25 Now 15 days later on May 28th SPX is at 2,802 and UVXY is at $37.82. Intrinsic, long-term decay can be to your advantage as a trader who defines risk across a macro-economic model.
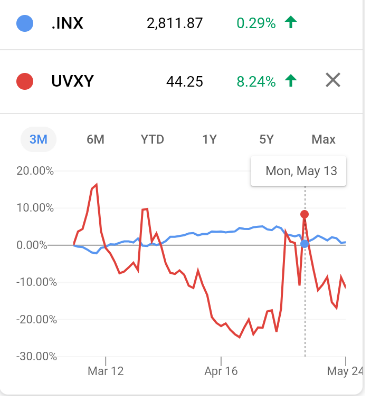
The S&P has fallen over the past 10 days while the VIX has made lower highs. Keep in mind this is a short period of time and the VIX can play catch-up rather quickly if hedging activity accelerates. Our base case near-term suggests SPX achieving 2,750 with VIX rising above 21.
You’ll often hear people suggest that the VIX is broken when it doesn’t respond with a 1:1 correlation to the SPX. The VIX is never broken, it simply responds and/or derives its value from the level of SPX OTM options activity. When the SPX falls it tends to fall in 2 waves, characterized by slow deterioration that finds support and bounces off support. The VIX tends to spike higher in the first wave. Recall the VIX surged above 23 during the first bout of the May pullback, which brought the SPX down to 2,802 before bouncing higher. As such, it should be no surprise that the VIX is currently below 19 even with the SPX back to 2,802. The second wave of selling pressure on the SPX will need to continue in order to find the VIX achieving 23 once again.
In terms of market liquidity we are forced to rationalize and realize that market liquidity has been quite fragile in recent years and through the implementation and advent of index ETFs and programmed trading. The new paradigm presents its challenges for modeling. Having said that we remind ourselves that drawdowns and uptrends can be elongated and more dramatic than most can predict or model. It’s with that backdrop that we remind ourselves of the S&P 500 volatility box that we charted back in Q4 2018.
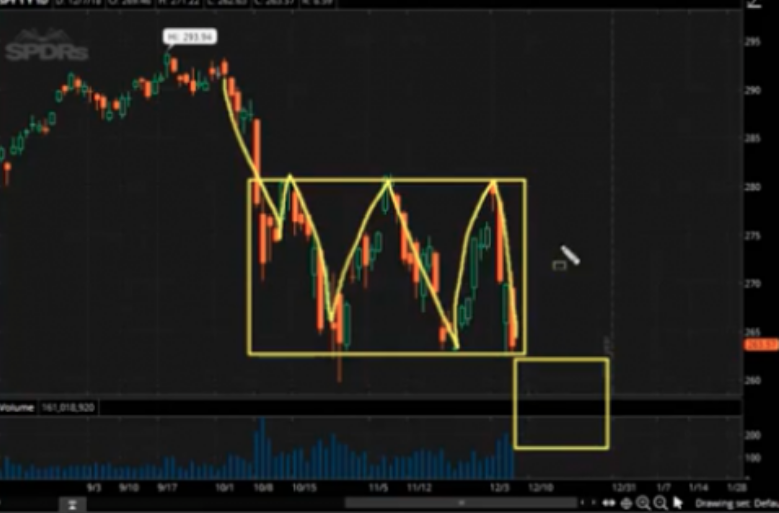
Atop the volatility box is the S&P 500 level of 2,800. The bottom of the larger volatility box is the 2,540 level. Should the S&P 500 fall back into the volatility box, we would expect heightened market volatility underpinned by curtailed market liquidity. This would represent a reasonable opportunity for investors to rotate their risk exposure and potentially build hedges if limited to a near-term risk/reward modeled portfolio.


