
Bit of a rough trading session for investors on Wednesday, as the hope of some relief hangs in the wings with U.S. equity futures pointing to a modestly higher open on Thursday, should they hold. Equities tumbled at the open of trading on Wednesday with the S&P 500 slipping below 2,800 and eventually to an intraday low of 2,766.06. The cause for the decline: Bonds continued to find strong bids through much of the day on Wednesday, at least until the final hour of trading on Wall Street. (See chart below).
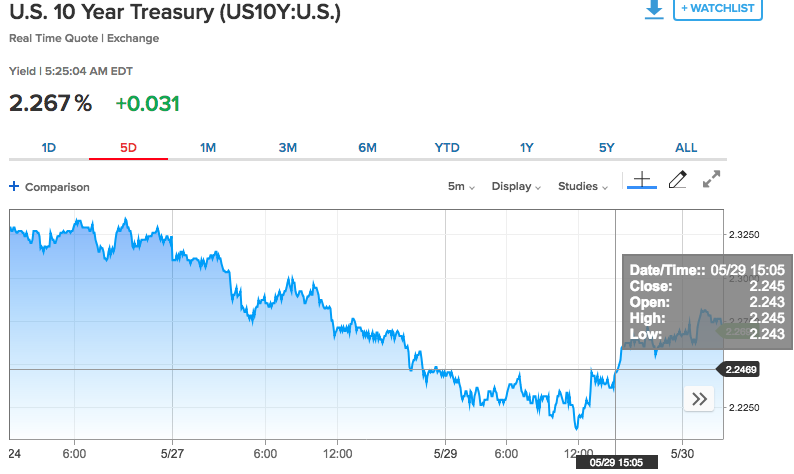
While the 10-year Treasury note bottomed around 12:00 p.m. EST, it wasn’t until 3:00 p.m. EST that yields spiked and rose to their high of the trading day with bond prices at the lows of the trading day.
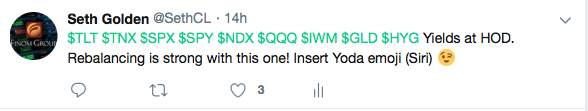
Finom Group is of the opinion the activity was merely the typical rebalancing exercise of institutional funds that takes place at the end of the month.
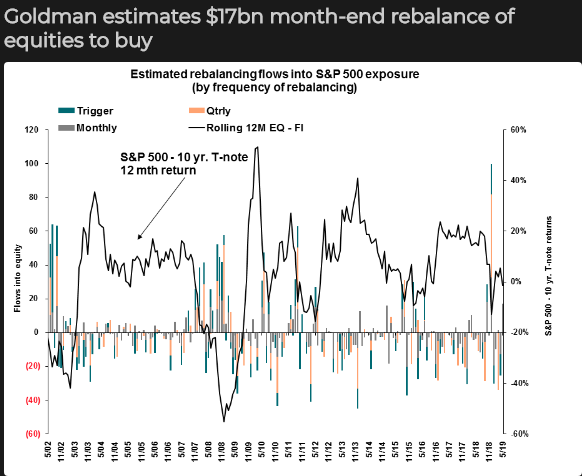
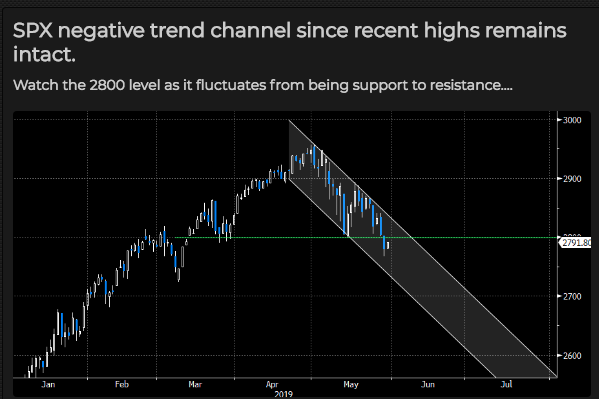
Essentially funds flowed from the bond market into equities and investors would be wise to recognize the current risk off market sentiment as sustainable near-term. As shown in the chart below, technically speaking, the S&P 500 downtrend channel since early May remains in tact, until it doesn’t!
Moreover, it’s not just U.S. bond yields that have been under pressure since the turn in of the calendar year. The German bund has been in negative yielding territory for the better part of 2019.
Ten-year bond yields dropped below those of the Asian nation’s for the first time since 2016 after European Central Bank President Mario Draghi said risks for the euro area remain tilted to the downside. A wave of risk-off sentiment is spreading through global markets, adding to a rally in German bonds this year amid a deteriorating outlook for the euro area.
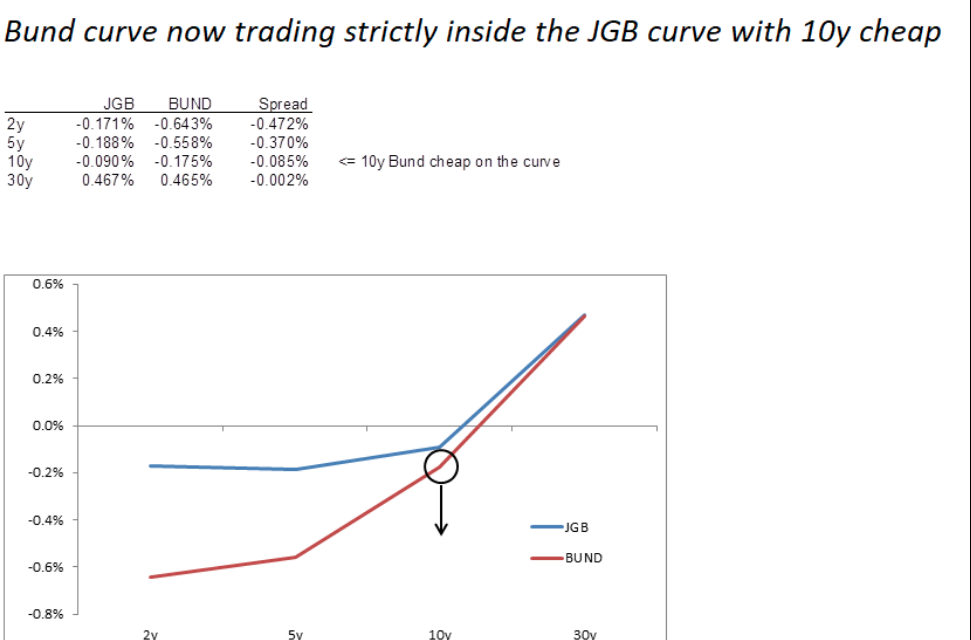
The slide in bund yields has led to fears of a so-called Japanification of the euro area, where inflation, growth and yields remain permanently low. The last time they were this low, in 2016, the ECB was pumping money into the region’s economy via bond purchases.
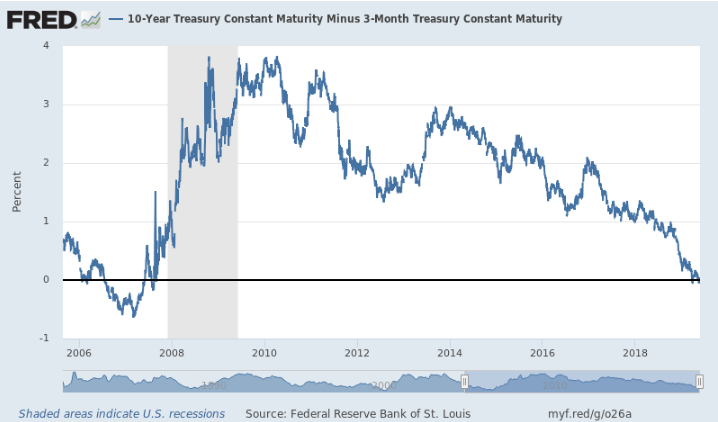
In the U.S., it’s not just that bond yields have been under constant pressure of late, but that certain parts of the yield curve have inverted, which has historically heralded recessions. The 10-year Treasury note yield fell below its 3-month counterpart, deepening an inversion of the yield curve, which measures the difference between the yield on the longer-dated Treasury and its shorter-dated counterpart. Inversions of the 10-year/3-month curve have preceded the past seven recessions, while throwing out two false positives with an inversion in late 1966 and a very flat curve in late 1998, according to the Federal Reserve Bank of Cleveland.
Thomas Lee, head of Fundstrat Global Advisors, suggests that not all inversions are created equal and compared the current inversion cycle with the occurrence in 1998. He said that when the yield curve inverts because demand for the 10-year Treasury is driving rates lower, it tends to reflect growing worries about risk rather than presaging a slowdown in the business cycle.
Back in 1998, the bond market saw an inversion due to the Russian debt crisis, which also led to the collapse of hedge fund Long-Term Capital Management. But the Fundstrat analysts said that that period represented a major buying opportunity.
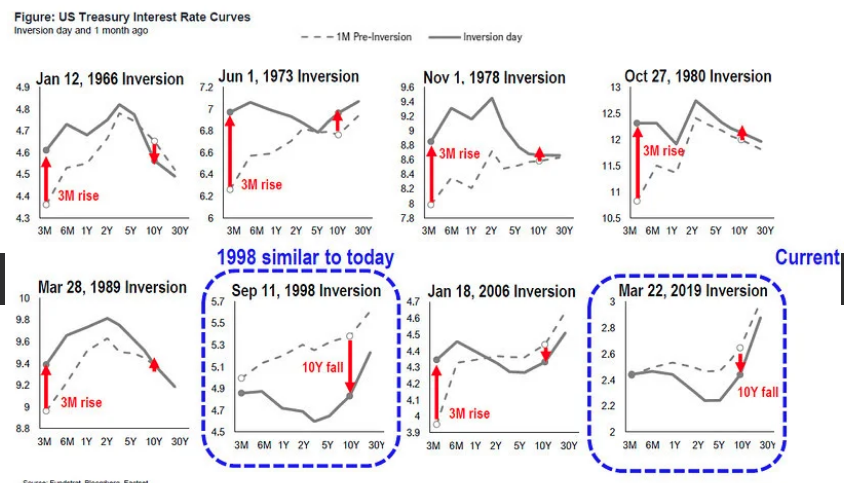
“We think investors are “overreacting” to this inversion. In 1998, it was a huge tactical buy signal, as it marked “peak risk off”–that inversion was seen ~1.5% before equity markets bottomed and then embarked on a 48% rise over the next 10 months. Hmmm. as much as chop makes sense for markets right now, this inversion is being view too negatively.”
While bonds set the tone for markets on Tuesday and Wednesday, the late day rally in yields yesterday led to some relief in the equity market selling pressure and with yields continuing to rally on Thursday. It’s an oddity that investors are welcoming rising yields, but typically that infers a flight from bonds into equities or risky assets. Jonathan Golub, chief equity strategist at Credit Suisse, found that since Dec. 24, the S&P 500 had fallen a total of 7.7% when adding up its performance from the days in which the 10-year yield ended lower. On the flip side, the S&P rose a total of 30.3% when the 10-year yield finished higher.
With 2 trading days left in the month, investors should be prepared for more realized market volatility at the very least and as the fund rebalancing continues. All this while the trade fight carries forward.
The U.S. Commerce Department said on Wednesday it had determined that Chinese-made mattresses and stainless steel beer kegs were being dumped in the U.S. market at less than fair value, and that it would impose preliminary anti-dumping duties. German and Mexican-made stainless steel kegs are also being hit with new duties. The U.S. government is imposing duties of up to 79.7% on Chinese-made kegs and up to 1,731% on mattresses.
Major U.S. mattress firms had petitioned for relief, including Serta Simmons Bedding, Leggett & Platt and Tempur Sealy International. American Keg had also sought relief. The duties are 8.6% for German kegs and 18.5% for Mexican kegs. In 2017, imports of refillable stainless steel kegs from China, Germany and Mexico were valued at an $18.1 million, $11.8 million, and $5.7 million respectively, the department said.
With additional tariffs, although miniscule in the grand scheme of things, China has been responding to the U.S. verbally and with dismay and scrutiny. Provoking trade disputes is “naked economic terrorism”, a senior Chinese diplomat said on Thursday, ramping up the rhetoric against the United States amid a bitter trade war that is showing no signs of ending soon.

Speaking to reporters in Beijing, Chinese Vice Foreign Minister Zhang Hanhui said China opposed the use of “big sticks” like trade sanctions, tariffs and protectionism.
“We oppose a trade war but are not afraid of a trade war. This kind of deliberately provoking trade disputes is naked economic terrorism, economic homicide, economic bullying. We will definitely properly deal with all external challenges, do our own thing well, develop our economy, and continue to raise the living standards of our two peoples. At the same time, we have the confidence, resolve and ability to safeguard our country’s sovereignty, security, respect and security and development interests.”
If it seems as though tensions between the two nations is rising, we would think that’s the most superficial and obvious takeaway. Nonetheless, we’d expect tensions to rise ahead of the next meeting, which lingers in the background and proposes to be imminent given the threat looming for another $300+ bn. in tariff implementation near-term.
David Kostin, chief U.S. equity strategist for Goldman Sachs, said in a Wednesday research note that the Trump administration’s decision to raise tariffs on $200 billion in annual imports from China from 10% to 25% will reduce S&P 500 earnings in 2019 to $165 per share, down from $168.
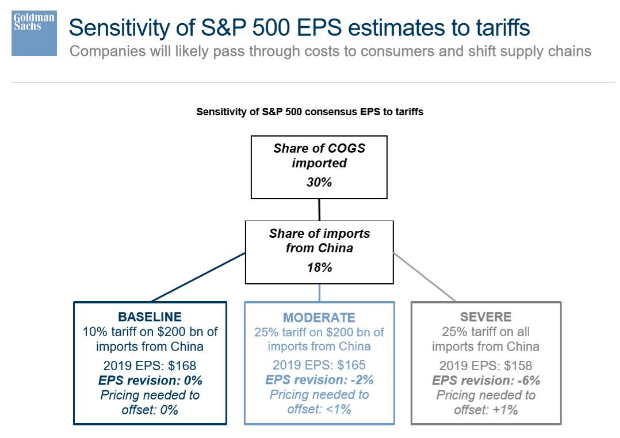
Amanda Agati, co-chief investment strategist at PNC Financial Services Group, told MarketWatch that “trade tensions have already been top of mind for more than a year, so we believe that companies should be better positioned” in terms of adjusting their supply chains to minimize the impact of tariffs on profits.
Moreover, new tariffs and the threat of further escalation does appear to be weighing on business confidence, with the latest reading of the Conference Board’s Measure of CEO Confidence showing that executives are, on balance, pessimistic about current economic conditions.
“CEOs’ assessment of current global conditions remains pessimistic. Sentiment declined moderately for the US and is now in slightly negative territory. Sentiment regarding China and Europe eroded further and remains quite downbeat. Sentiment for India and Japan was unchanged, though remains moderately pessimistic in Japan. CEOs viewed conditions in Brazil considerably more favorable, with confidence rebounding to year-ago levels.
Looking ahead, CEOs are moderately less pessimistic about global growth prospects. Europe, however, remains an exception with short-term expectations declining further. Growth expectations for the US and China improved, while Japan held steady, but sentiment remains somewhat negative. CEOs’ expectations for growth in India and Brazil was slightly positive.”
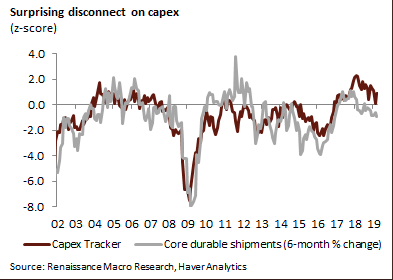
The pessimism amongst CEOs could be contributing to recent weakness in business investment, which could reduce profit growth in the coming years. The latest quarterly capital expenditures for the S&P 500 came in at the lowest since the fourth quarter of 2017. Having said that, the Renaissance Macro capex tracker, which averages all of the regional PMIs, managed to pick-up to best level since January as capital spending has held up.
With all the geopolitical tensions at play, inclusive of U.S./Iran, and the clear-cut bond-equity relationship signaling an economic slowdown, the S&P 500 has fallen nearly 6.5% from its highs. CNBC’s Jim Cramer believes that such a pullback warrants buying activity.
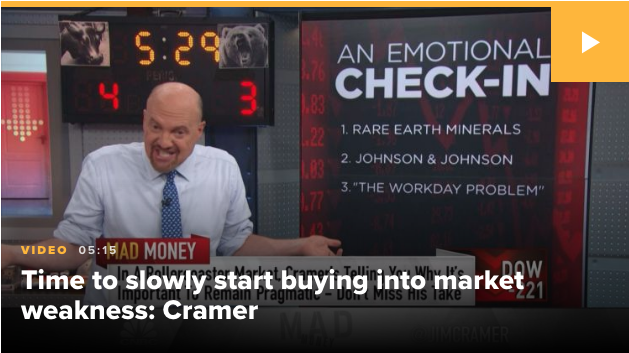
“Now that people are really freaking out … I think it’s time to start picking up stocks into weakness. That’s not cheerleading, it’s discipline. So if you’ve got some cash on the sidelines, I think you can possibly begin putting it to work. But slowly and surely, and not with a degree of gusto because it’s not warranted.”
While Cramer suggests investors can start nibbling in the market once again, nibbling may be the most operative word. The technical damage to the market that has already taken place shows signs that the market is now in a distribution phase, marked by a head and shoulders pattern, completed with the S&P 500 dipping below its 200-DMA on Wednesday.
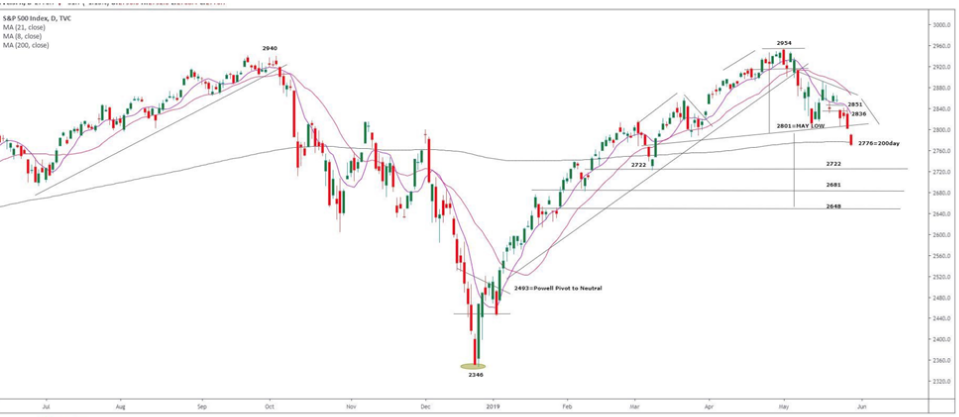
“If the 2800 area breaks, it would confirm a head and shoulders top that suggests deeper downside risk to 2650, which is also the 50% retracement of the December to May rally,” Bank of America Merrill Lynch technical analysts wrote in a note. The top of the pattern would be the top of the head at 2,950, and 2,800 was considered the neckline.”
While the fundamentals of the economy and corporate earnings dictate market outcomes over time, with earnings season basically over the technicals will take to the helm of the ship. As such, investors should carefully choose when and what they choose to nibble on over the next couple of months. Of course this is not withstanding the geopolitical exogenous risk potential to the upside or downside. Here is what Goldman Sachs had to say about the latest S&P 500 technical break down of 2,800:
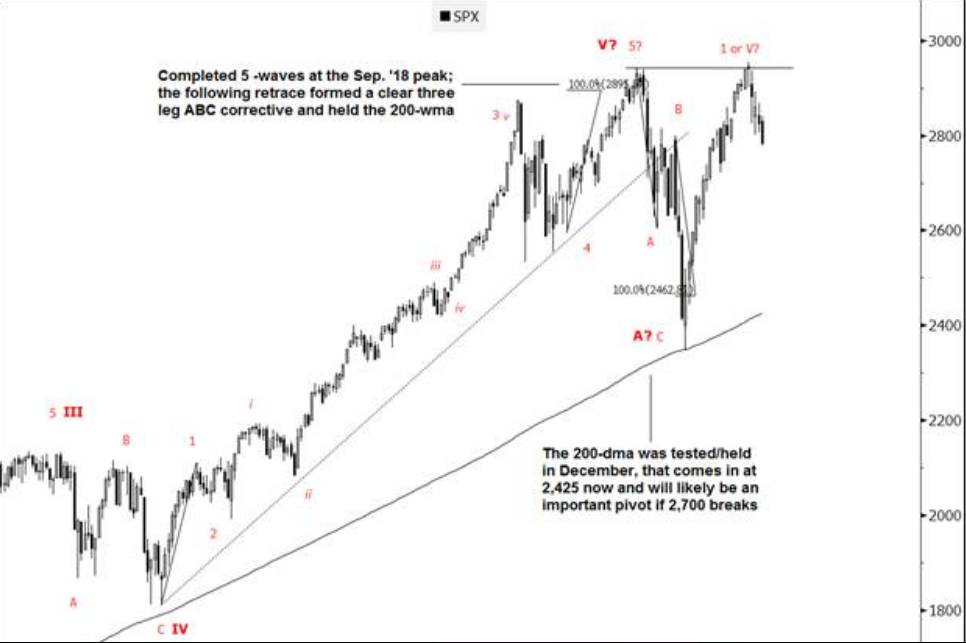
“2808-2,793 was a particularly strong support area, which having now broken signals trend continuation. Sustaining this break opens up a projection target of 2,739-2,722; an ABC equality from April. How price action develops there will likely be trend-defining. Initially biased to watch for a base/reversal. Holding 2,739 support means that the sell-off is corrective/counter-trend in nature. Alternatively, the likelihood of this being a more material topping process increases through 2,700. The next interim level in focus 2,775; 200-dma. While it hasn’t been too relevant in the past, the level itself tends to be well respected by the general technical community. It’s also worth mentioning that if this Friday’s close settles below 2,848 it will have formed a bearish key month reversal and, subsequently, within context of a double top. The last time a bearish key month reversal formed from a new high was in Jul. ’07, which ironically also developed from a double top like structure.”
For Thursday, investors will key off of the latest revision to the Q1 GDP data, which is expected to be revised slightly lower. In addition to GDP data, investors will also receive the following data on housing and employment:
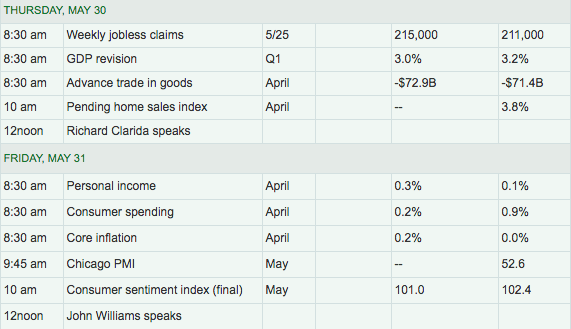
With mortgage applications on the rise in 2019, due in part to lower fixed rate mortgages, Finom Group expects Pending home sales to trend similarly to New home sales over time. The headlines for mortgage applications can prove misleading.
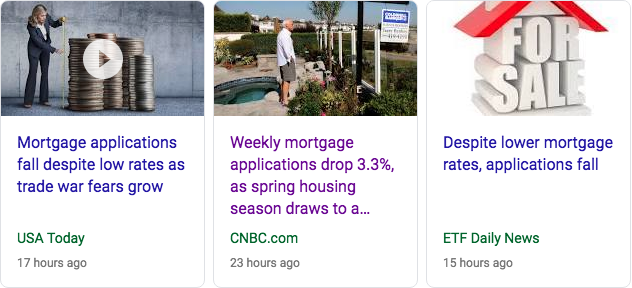
The reality is that the headlines only represent the week-to-week data and not the YoY data.
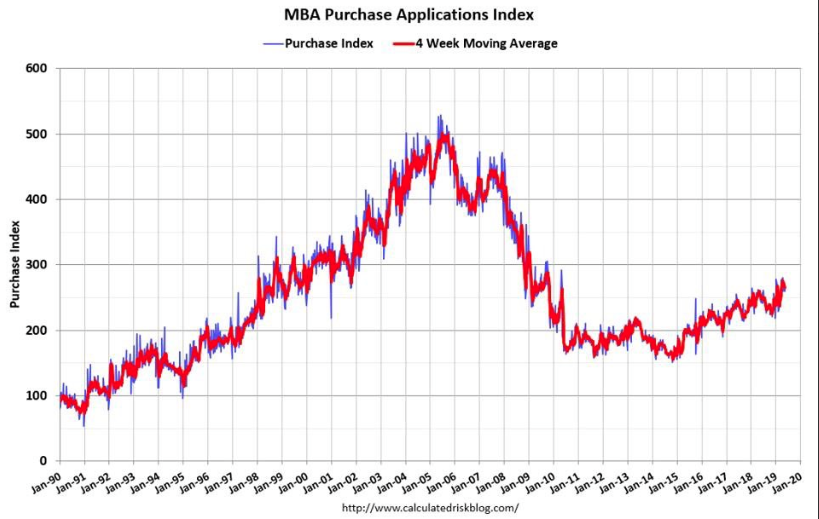
On a YoY basis, mortgage applications have risen through most of 2019 as shown in the chart below.
One of the talking and technical points Finom Group has followed over the last couple of years relates to the financial sector as a means of support for the S&P 500. The financial sector carries a large market cap and as such serves to support and/or drive the S&P 500 over time. A substantial gravity point for the Financial Sector Spiders ETF (XLF) has been $26.50 over the last few years.
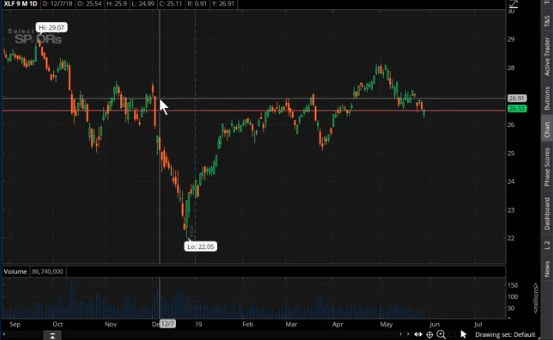
As we’ve outlined and discussed to our Premium members in our Live Trading Room, the $26.50 level needs to be monitored. The gravity point was breached last week, but managed to find XLF closing above the level. On Wednesday, the XLF breached the gravity point once again and closed the trading session smack dab on the long-term gravity point.
Regardless of what the market delivers on any given day, Finom Group will be looking for ideal trading opportunities as realized market volatility presents itself during market pullbacks. Yesterday’s trade of the day is noted in the screenshot below.
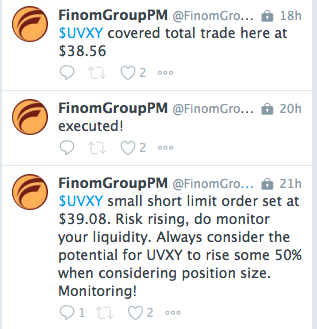
Subscribe today and join our Live Trading Room, receive our daily/weekly and longer-duration trade alerts and our weekly Research Reports!


