
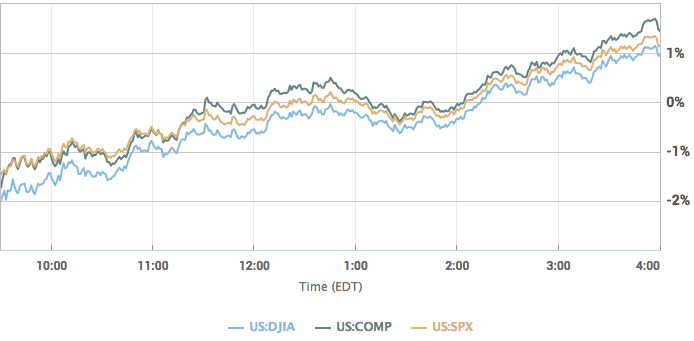
Today’s U.S. equity futures, thus far, look far more promising than did yesterday’s futures. At their trough, Dow Futures were down over 600 points whereas in the 5:00 a.m. EST hour they are up nearly 50 points. But just like yesterday, the futures may not foreshadow what happens when Wall Street opens for trading. The major indices were lower for much of the day yesterday, but were tilting positive by 1:00 p.m. and turned positive in the late afternoon. It was a slow grind higher through much of the day that found the Dow up nearly 250 points by the end of the trading day and telling quite the different story than what was found in the premarket.
Fears surrounding heightening trade war rhetoric between the U.S. and China sparked a meltdown in U.S. equity futures, but that fear was obviously muted by a better than expected longer-term market outlook and ADP payroll report. ADP’s report on private-sector employment showed 241,000 jobs added in March, far more than had been expected. The news is a positive comes ahead of Friday’s government data on nonfarm payrolls. Markit’s March report on services came in at 54, a drop from the previous reading of 55.9, while the Institute for Supply Management was at 58.8. Meanwhile, February factory orders data rose 1.2%, with 1.7% growth expected.
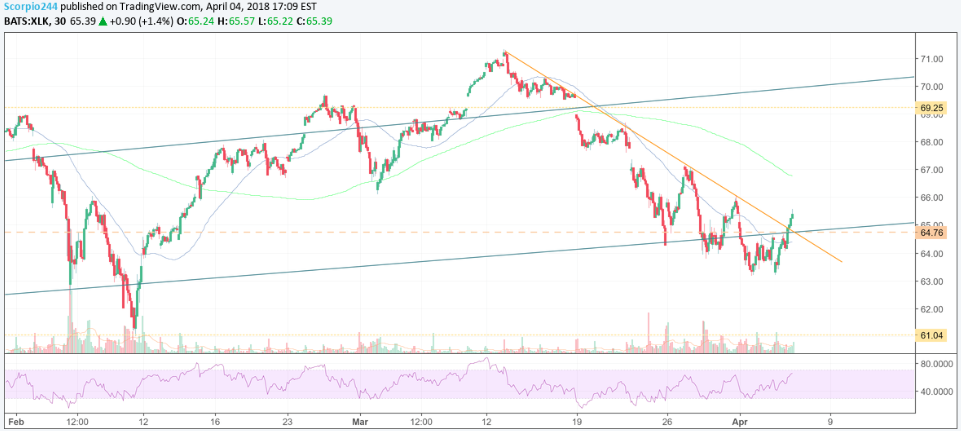
Yesterday, all three major indices closed higher for a second straight session. It was the first time the S&P had risen in back-to-back sessions since a two-day stretch ending March 9, 2018. When it comes to the technicals on the S&P 500, they appear a bit more favorable today as the S&P 500 is reasonably above its 200-day moving average now and has broken above two downtrends as shown in the chart below.
Even with Wednesday’s market rebound, CFRA chief investment strategist Sam Stovall isn’t convinced the selling is over. But when the dust eventually clears, he predicts a comeback will take hold. His S&P 500 year-end price target is 2,800, and his rolling 12-month estimate is even higher: 3,000.
“While we could go further lower in terms of this correction, I don’t think we’re going to be falling into a new bear market. We could head as low as 2,490 on the S&P 500. That would end up being a correction similar to what we experienced from May 21 of 2015 through February 11 of 2016,” he said. “It ends of being a very standard correction.”
A strategist at Goldman Sachs told CNBC Wednesday that it’s unlikely that stocks will enter an interrupted period of falling prices.
“Without interest rates and inflation expectations really rising very much, it is difficult to see the triggers for a recession anytime soon,” Peter Oppenheimer, chief global equity strategist and head of macro research at Goldman Sachs International, said.”
Investors are looking to the start of earnings season next week. For the first-quarter 2018 reporting period, the estimated earnings growth rate for the S&P 500 is 17.3 percent. That would mark the highest growth since the first quarter of 2011, according to FactSet senior earnings analyst John Butters. Thomson Reuters forecasts S&P 500 first-quarter earnings to rise more than 18% year-over-year.
The equity market roller coaster ride that is 2018 isn’t likely over yet. Increased levels of volatility underline equities this year, with the VIX currently reading just over 20 presently. The VIX Futures market has also been defined through the 1st quarter of 2018 as a period of extended backwardation as implied volatility has risen beyond levels seen in 2017. VIX Futures term structure is depicted below via vixcentral.com, exampling Futures prices below that of spot VIX.

Backwardation on M1 is presently above -3%, but sharply below the -6% found in early trading yesterday. Moreover, M1 is not set to expire for another 13 days. It remains to be seen as to whether or not VIX Futures can resume contango prior to expiration as a relatively elongated period of backwardation has presented itself in 2018, similarly to the period exampled in August of 2015. Equity markets don’t typically act well with increased levels of volatility and have validated this thesis for much of the first-quarter in 2018. 2018 thus far has seen more than three times as many sharp gyrations, in both directions, when compared to what was seen last year. Thus far in 2018, the S&P 500 has had 13 days with a 1% rise and 12 with a 1% drop, making for a total of 25. There were just eight such sessions in 2017, meaning a little more than three months into the new year, it has already tripled the number of 1% moves seen over all of last year. The benchmark index matched last year’s total in mid-February. Such volatility might be expected as concerns about rising rates and extended equity valuations are at-hand. Having offered merely two reasons for increased volatility, a laundry list of other reasons can be offered that surround geopolitical issues. One thing is for certain, the roller coaster market ride will not end with the first-quarter.


