
It was a pretty good day on Wall Street after a couple of downbeat days to end the previous week’s trade. All three major averages finished higher on the day as the Turkish lira rebounded from its recent lows and looks to stabilize further on Wednesday. Even as the S&P 500 has edged within 1% of its all-time highs and it seems an inevitability that it will achieve a new record high, headwinds have kept the index from this accomplishment to date. From tariffs and the China yuan devaluation to the most recent Turkish lira plunge, the wall of worry for U.S. equities seems ever elevated/elevating. Regardless of the obstacles confronting U.S. equities, the U.S. seems to be the best place for fund managers to put their capital.
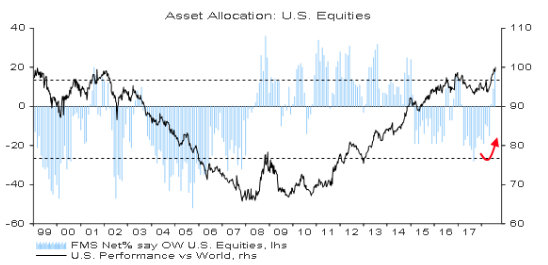
Domestic equities are holding the biggest portfolio weight since January 2015, according to the August Bank of America Merrill Lynch Fund Managers Survey, a look at where 243 pros that manage $735 billion are putting their money.
The rationale is pretty simple; markets tend to follow corporate earnings over time. With second-quarter earnings season almost over, S&P 500 companies collectively are on track to show a 24.6% gain from the same period a year ago as 79% have beaten Wall Street profit estimates, according to FactSet.
Although earnings are quite robust for U.S. companies, investors remain concerned even amid the big overweight for U.S. stocks. Cash has risen to 5% of portfolios, up from 4.7%in the past month and ahead of the 4.5% 10-year average. Managers consider the trade war to be the biggest “tail risk,” while 32% think that the U.S. economy, after a 4.1% GDP gain in the second quarter, faces deceleration ahead. Keep in mind that deceleration does not mean recession or even no growth.
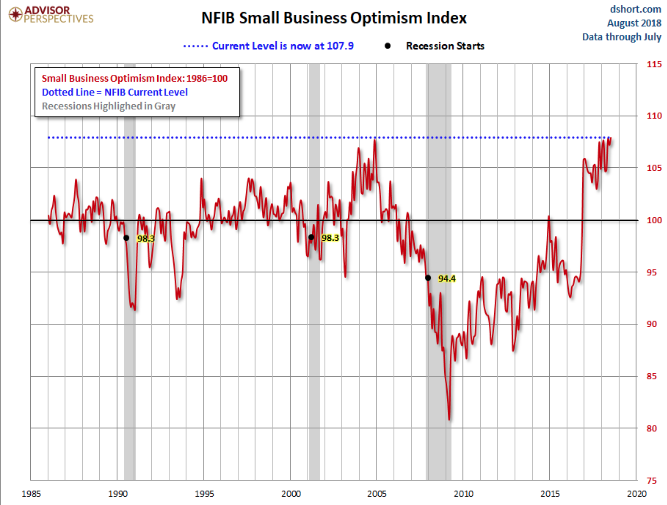
Moreover, as earnings come in for the 2nd quarter and above analysts’ estimates by and large, investors are listening to what business operators have to say about the economy and the state of the consumer. The latest issue of the NFIB Small Business Economic Trends was released yesterday. The headline number for July came in at 107.9, up 0.7 from the previous month and its second highest of all time. The index is at the 100th percentile in this series.
Here is an excerpt from the opening summary of the news release.
“The Small Business Optimism Index marked its second highest level in the survey’s 45-year history at 107.9, rising to within 0.1 point of the July 1983 record-high of 108. The July 2018 report also set new records in terms of owners reporting job creation plans and those with job openings. A seasonally adjusted net 23 percent are planning to create new jobs, up three points from June. Thirty-seven percent of all owners reported job openings they could not fill in the current period, a one-point increase from June.
“Small business owners are leading this economy and expressing optimism rivaling the highest levels in history,” said NFIB President and CEO Juanita Duggan. “Expansion continues to be a priority for small businesses who show no signs of slowing as they anticipate more sales and better business conditions.”
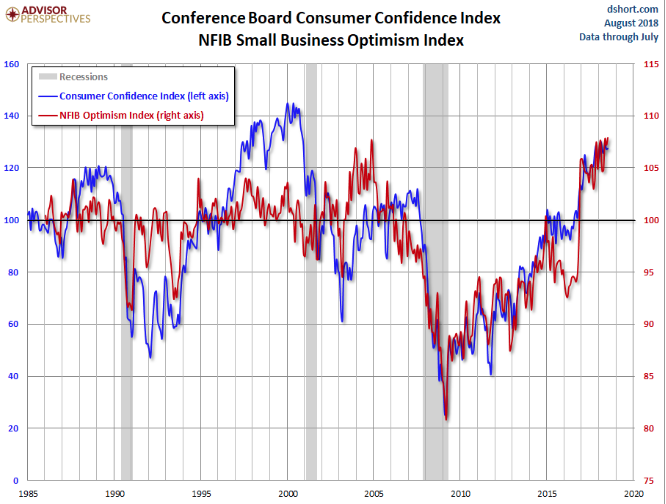
Business owners are taking extrapolating confidence from the consumer and consumer spending. Even as prices are inflating, the consumer seems well positioned to absorb slight reflationary pricing as the Fed tightens and a tariff battle is wagered around the world. The following chart overlays the Business Optimism Index and the Conference Board Consumer Confidence Index. As one can clearly see from the chart, both the Business Optimism Index and Consumer Confidence Index are highly correlated.
Be it consumer confidence or business sentiment, the current readings for both indicate a strong economy in the United States. Additionally, that strength is lending itself to strong YOY corporate earnings growth and investor confidence. One thing to keep in mind with respect to investor confidence, the longevity of the bull market cycle and the present level of the S&P 500 and its called contrarian indicators. Remember fund managers’ cash has risen to 5% of portfolios, up from 4.7% in the past month and ahead of the 4.5% 10-year average. So while confidence is high, so is cash, which indicates heavy-handed hedging programs are put to work and especially as emerging markets have shown signs of cracking or faltering.
Investors are better able to review hedging activity by way of the volatility complex. The VVIX or “volatility of volatility index” identifies that investors are still a bit weary of the recent equity market rally. They have been buying VIX call options, pushing the VVIX to levels above 100. And it’s been a relatively inexpensive source of portfolio protection with the VIX in the 12-13 range over the last month or so. VVIX has been hovering around the 100-level for the last few weeks, indicating fund managers are still leery about the adverse affects of trade wars amongst other variables. The bottom line for the current level of VVIX suggests investors should remain vigilant. Now let’s talk about another index reading that shows how fund managers are protecting and positioning their portfolios for the possibility of a near term market shock.
The CBOE’s SKEW Index measures potential risk for the financial markets over the next 30 days. It has been in existence since 1990. When the SKEW Index spikes, conventional “wisdom” assumes that there’s a greater chance of a major event occurring in the financial markets. The SKEW Index typically ranges from 100 to 150. The higher the value, the greater the chance of a major market event.
Skew is the measure of OTM puts vs. OTM calls, when skew is high (just shy of record amounts recently) there are buyers of puts in SPX who are also sellers of calls, which causes a distortion resulting in the skew metric. The activity drives implied volatility higher in the S&P 500. So why is the SKEW so high (above 150)? It is high due to hedging activity: Record numbers of traders are hedging. So let’s look at just how high SKEW is presently or has risen to recently.
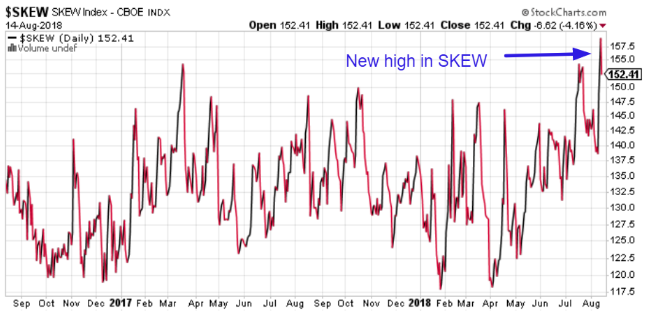
As displayed in the chart above, SKEW just hit a new all-time high. More importantly, SKEW has been above 150, at various points, over the last two-weeks of trading. What we can extrapolate given the various readings above 150 over this period of time is that SKEW is not always a bearish market indicator.
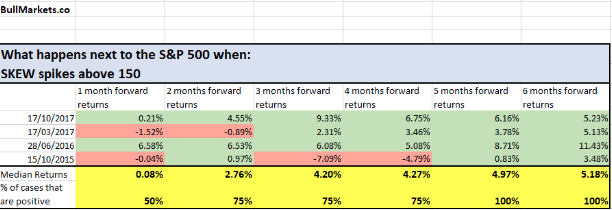
There are actually more times than not that when SKEW spikes, the market does not crash.
As it pertains to the U.S. market, Finom Group is of the viewpoint that in due time the S&P 500 will achieve a new record high level. Consumer spending is strong and remains the greatest driving force of the U.S. economy. Even though household debt is on the rise, the consumer is not in the debt burden position that he/she was in previous decades.
Household debt, including mortgages, credit cards, auto loans, student loans and other credit, grew for the 16th consecutive quarter in the April-to-June period, rising by 0.6%, or $82 billion, to $13.29 trillion, the New York Fed reported Tuesday. While that sounds negative on the surface, when we look at the details we come to realize it’s an improvement in household debt overall.
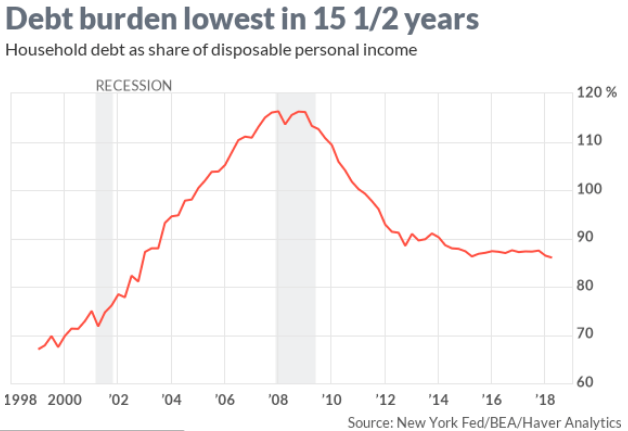
With personal disposable incomes at a $15.46 trillion annual rate in the quarter, the debt-to-income ratio dipped to 86 percent. That’s the lowest since the fourth quarter of 2002. At the height of the credit bubble in 2008, debts topped at 116% of disposable income.
What’s also encouraging is that the flow into seriously delinquent debt stayed at 2.3% in the second quarter. Those numbers reached as high as 7.9% during the recession and have gradually drifted downward.
So while market bears and/or pundits lay claim to the probability of a recession being tied to rising debt levels, investors would be advantaged to review the ability to pay down or manage that debt with respect to income levels. This exercise more appropriately depicts why the consumer has remained healthy in the face of rising debt levels. For this reason we continue to monitor the progress of the consumer and business sentiment trades as we trade the markets at Finom Group. Below are two trades completed just yesterday and as the market bounced back a bit.
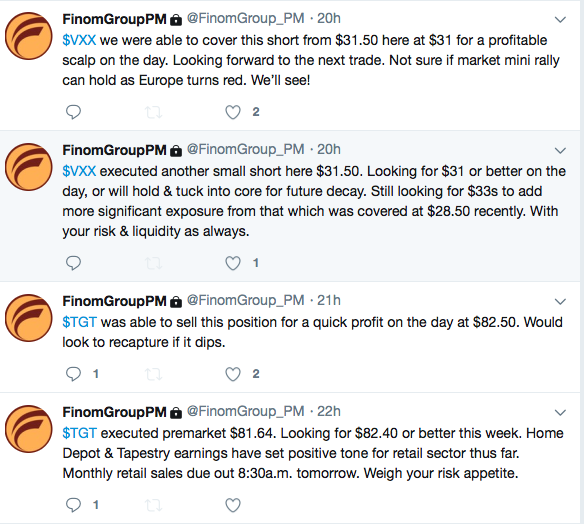
Subscribe to finomgroup.com today to access our market and economic driven research reports as well as trade alerts!


