
And when the markets head lower, the rhetoric surrounding Turkey’s debt and lira exacerbate. That pretty much sums up yesterday’s global equity market trading and media focus with most markets sharply lower, including U.S. indices. The reality surrounding Turkey’s current debt and currency woes is nothing new and seen many a time before. The debt emergencies in Greece, Cyprus, Italy and other euro zone countries, not to mention Argentina and Malaysia have had negligible global spillovers. Several required bailout loans from the International Monetary Fund (IMF). Nonetheless, headlines such as the following, from a CNBC article, littered the media coverage throughout the day yesterday and as equity markets retreated.
‘What happens in Turkey won’t stay in Turkey’: Why this debt crisis could be different
Within the article the author attempts to grab readers’ attention with the “why this time is different”, regarding the potential for Turkish debt concerns to cause contagion. Keep in mind; the entire market cap of Turkish equities traded on the Istanbul Stock exchange is less than the market cap of Netflix. As such, contagion concerns are quite illogical and found with disregard for past precedence whereby the IMF has stepped in and bailed out many a nation. With respect to the headline and article in question, rationale and logic eventually prevail. By the end of the article, the author suggests the following:
“Ultimately, there’s still a prevailing sense that the Turkey situation will be resolved without any great global calamity, once again allowing market to dodge worries about another debt crisis, whether it’s in Italy or anywhere else.”
Even famed columnist and newsletter writer Mark Hulbert rationalized the limited cause for U.S. investor concern with respect to Turkey in his latest article.
“Turkey’s currency crisis is creating the preconditions for a good buying opportunity in the U.S. stock market.
That’s because the world’s central banks will almost certainly make sure that there is plenty of liquidity to keep Turkey’s crisis from spreading too far. And, inevitably, much of that liquidity will make its way into the equity markets.
Investors’ knee-jerk panic therefore gives contrarian-oriented investors the opportunity to purchase equities at cheaper prices.”

The S&P 500 has had a really strong run since the February market correction, one that found “dire market conditions and calamitous” headlines in great circulation of the day. The market has a way of eventually focusing on the fundamental driver of markets, corporate earnings. As corporate earnings have surged through the first half of the year, the S&P 500 has performed in kind. But all good things… need a breather and the Turkish crisis, as minimal in global size as it may be, gave investors and the markets reason enough to take a breadth.
Markets simply don’t go up every day and forever, but when the market trend is unchanged for an extended period of time, traders are lulled into complacency. This causes stretched RSI readings and long periods of complacency in the market as displayed by the VIX. Sometimes you’ll witness oscillators expressing overbought conditions whereby the major indices are stretched further than the moving averages. Volume trends can also provide indication of a near term change in market trend, even if for a brief period. So while a market pullback may be in the cards given the aforementioned indications/indicators, investors should still focus on the market’s fundamental backdrop provided by earnings and over a longer time horizon. Historically speaking, earnings behave as a guide for markets over time. As such, we can conclude that the most important reason to be prepared for a market pullback is the opportunity it may bring with it. In an economic cycle whereby earnings and sales are growing alongside net profit margins, the colloquialism “buy the dip” has been found a consistent and beneficial activity for investors.
On August 22, 2018, the current bull market can usurp the bull market of the 1990s as the longest ever. The current bull market was born on March 9, 2009, and is now just days away from topping the previous longest bull market from the 1990s. While the current bull market might be the longest bull market ever, it could also be said that it isn’t the greatest; that is unless it proves otherwise by 2020. The S&P 500 gained nearly 420% during the 1990s bull market versus the current bull market standing at just over 320% gains.
The following chart from LPL Financial displays the bull market cycle durations since World War II.
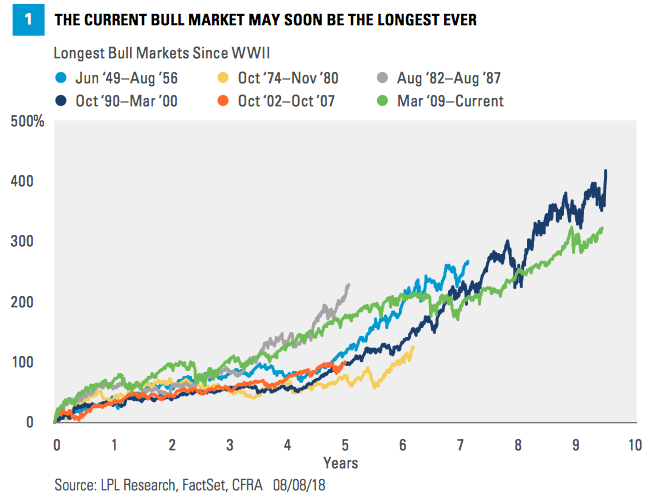
This bull market is probably the least loved of the many bull markets. It continues to “climb the wall of worry”, another colloquialism established during this bull market. In 2018, that wall of worry seems heightened by the following variables:
- Tariffs and trade wars
- Inflation
- Flattening yield curve
- Global economic slowdown
- Currency crisis fears
- Peak earnings
- Household and corporate debt levels, not to mention high-yield debt
While the headlines continue to cast doubt on the sustainability of this economic cycle and bull market, Finom Group believes both have another year to run, assuming all things equal. Although we see several potential hiccups or headwinds, we see them as opportunities until the economic data suggests a trend change.
The February correction was blamed largely on wage inflation, that spike in wages proved to be just that, a spike or blip if you will. In the subsequent Nonfarm Payroll reports since, wage inflation moderated to the mean. Wage inflation should be a consideration for investors, as it has proven an indicator that a bull market and an economic expansion cycle are coming to an end. The past three recessions were preceded by annual wage growth of more than 4 percent. Recent data showed wages growing at 2.7% YOY, suggesting inflation remains tame and far from previous recessionary levels.
Another reason Finom Group believes the economy and market has further room to run is due to Leading Economic Indicators (LEI) continuing to show strength. This indicator turned negative YOY ahead of every recession going back to the 1970s, which makes the 25 consecutive monthly gains and recent 5.8% year- over-year increase all the more impressive.
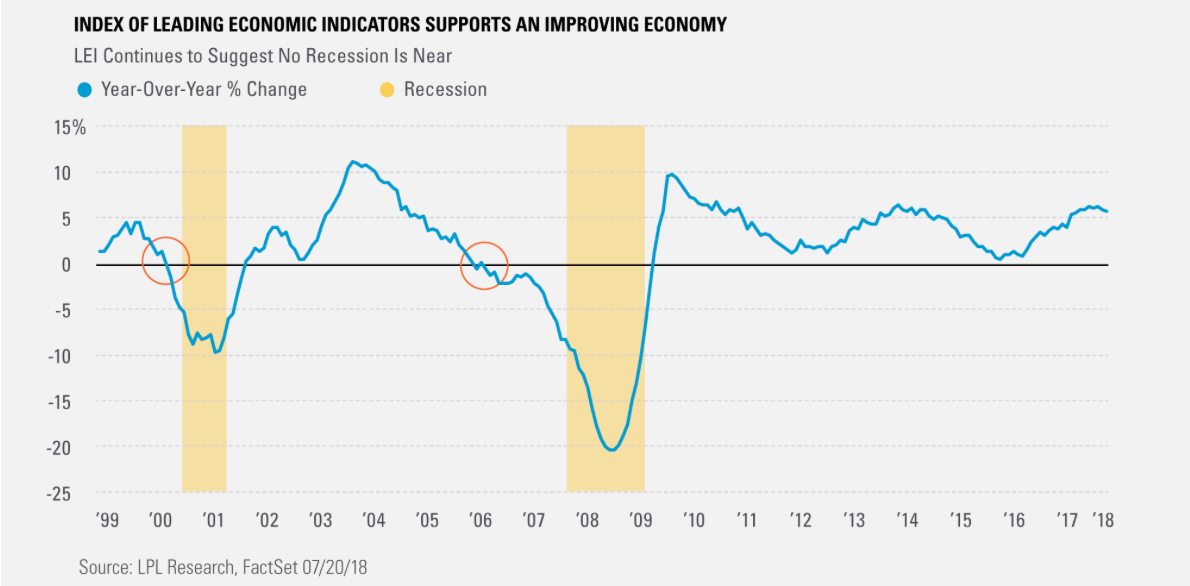
As we outlined in our recent research report, LEI shows the earliest a potential recent could hit is possibly in the 2nd half of 2018.
“The leading indicators peaked in the last report in June, so there are no serious worries about a recession warning being triggered by this index. The leading indicators peak 12 months before recessions, meaning the earliest a recession can occur is the 2nd half of 2019 if the average holds. The stock market has peaked before the leading indicators in 3 of the past 7 business cycles.”
Speaking of Leading Economic Indicators, the latest report from the Conference Board will be due out this coming Friday. But before LEI is released, all eyes will be on the monthly retail sales report on Wednesday and as the quarterly earnings reporting season kicks into high gear this week. Home Depot (HD) is set to report before the opening bell today followed by Macy’s (M), Wal-Mart (WMT) and J.C. Penney (JCP) later this week. While many have drawn the conclusion that the retail apocalypse was more hyperbole than reality, we urge investors to comb through these retail quarterly reports to locate the details on inventories. Many retailers named closed hundreds of stores over the last couple of years and only have limited store closings in 2018. But to the extent they continue to massively reduce store inventories, they equate to store closures. In short, we characterize the 2018 retail climate for the likes of JCP, M, KSS and others as a breathing period. We believe the breathing period will be brief in hindsight and as future results find a need for further store closures in the years to come. There is only so much store inventory that a retailer can cut before the inevitable solution is found, store closures.
While the Turkish issues are now overshadowing the Chinese yuan devaluation that was the headline leader only a week ago, the bull market should be able to find itself a new record for duration soon enough. Bull markets don’t die of old age they tend to die of excess. But we aren’t seeing the excess of former bull markets show up in the data as of yet, not the data that precedes recessions at least. We certainly are in the latter innings of the bull market, but how late remains to be seen. One of the indicators signaling a late inning bull market cycle is elevated volatility. Monday’s trade brought about such elevated volatility.
While the VIX rose sharply over the last 2 trading sessions as the S&P 500 dropped, opportunity may be at-hand. With Monday’s VIX spike, it is now above its 2 standard deviations Bollinger Band. This suggests that the stock market’s short-term downside is limited. Of course this is based on historic precedence as indicated in the chart below.
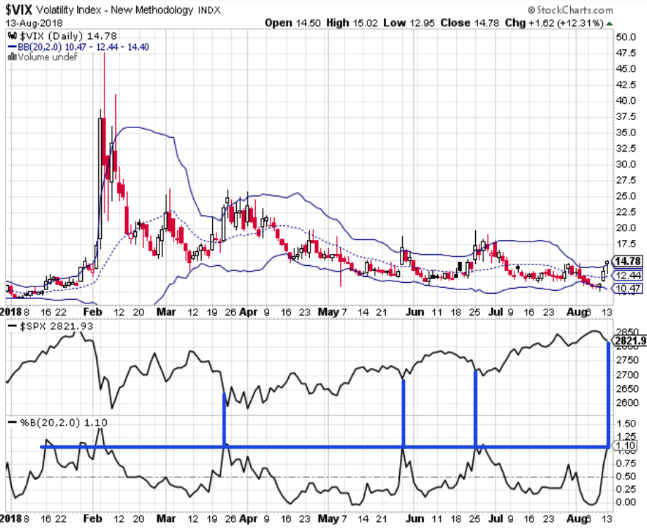
VIX’s upper Bollinger Band represented a short-term bottom for the U.S. stock market from February to present. When the VIX crossed its upper Bollinger Band, the stock market was either at a short-term bottom or close to making a short-term bottom. As such, the pre-market futures showing signs of rebounding are in lock-step with the chart and history, although anything can happen in what is a typically a poor month for equities. We’ll withhold making predictions in favor of active trading as we did yesterday for finomgroup.com subscribers. The screen shot below indicates our volatility trade of the day on Monday.
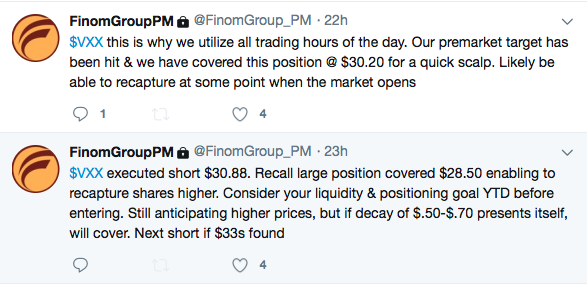
Additionally, we were able to recapture this short position at a higher price than where we covered the short position. We like that opportunity given the VIX complex correlations to the market along with the constructed inverse VIX-ETP correlations. VIX Futures expiration will occur next Wednesday and with term structure in contango (M1 above 5% and M2 above 4.5%), inverse VIX-ETPs may be found with further decay between now and futures expiration. Again, the market has a way of doing what it pleases, but ultimately time decays inverse VIX-ETP share price. So how do you trade instruments such as UVXY, TVIX, VIXY and/or VXX? Look for opportunity traders; there is daily opportunity to be found.


