
It was quite a trading day, yesterday, that found the major averages on a roller coaster ride throughout the day. But in 2018, that’s actually been commonplace, which may be indicative of the greater degree of uncertainty that lay within investor sentiment. With that, the chart below offers a rudimentary look at the performance of the S&P 500 yesterday:
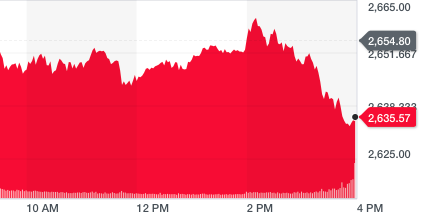
It was a rather choppy market up until the 11:30 a.m. mid-hour before things starting looking rough. But shortly after lunch hour the markets started trending higher up to and through the Fed rate and policy statement at 2:00 p.m. After the announcements, the major averages responded positively with all 3 indexes rising…before the unavoidable sell-off into the closing bell. The major averages finished at or near their daily lows, as fears of heightening inflation were perceived in the Fed’s outlook.
The bank left its benchmark fed funds rate unchanged at the end of its two-day meeting in Washington. The Fed also included more hawkish language in its official statement about inflation. The Fed’s preferred PCE inflation gauge hit the central bank’s 2% target in March, the government reported earlier this week.
“On a 12-month basis, both overall inflation and inflation for items other than food and energy have moved close to 2%. Inflation on a 12-month basis is expected to run near the Committee’s symmetric 2 percent objective over the medium term.”
The Fed did a good job of hedging its more hawkish message, however, by stating that wage inflation remains low as business spending is rising.
“Market-based measures of inflation compensation remain low. Business fixed investment continued to grow strongly.”
Finom Group believes the Fed’s statement was as hawkish as it should be at this stage of the economic cycle and given the underpinnings of the economy that are seeing continued improvements. Inflation/reflation is at-hand, but still at historically low levels and not in danger of impeding the economic expansion through 2018. Input costs are obviously on the rise and mostly appreciating in the energy sector. Oil has risen steadily through the 1st quarter of 2018 and above $65 a barrel. But even with the higher input costs through crude, the price at the pump remains below the $3 a gallon level, a level bearing the average price during the Obama administration. With $3 a gallon and even $3.75 a gallon gasoline prices from 2011-2015, the U.S. economy expressed growth in both consumer spending and retail sales to the consternation of many economists. As such, the fear of rising input costs from the likes of crude oil seem misplaced at this time and with the price of crude and gasoline still at relatively low levels.
At Finom Group we often try to obtain the broadest perspective as to what is impacting the equity markets. In 2018 and with fears of “reflation on the rise”, we are forced to value rising yields against our forecast for the S&P 500 (Target level for 2018 is 2,900-3,000). The 10-year treasury surpassing a 3% yield has proven to force fund managers to consider rebalancing risk in portfolios. Rising yields in 2018 are a factor of economic stimulus and the Fed unwinding its balance sheet, a colliding of factors/actions in 2018. Nonetheless, these issues presented have served to express a correction in the major averages as investors right size their portfolios and level set their expectations for future returns.
Of course there are geopolitical issues that weigh on investors’ appetites for risk, but these are ever present and ever moving targets in the global economy. As such, we are also forced to accept that, over time, markets follow earnings… even though that may be hard to believe as markets have trended lower through much of 2018 and in the face of exceptional Q1 2018 earnings results. So of course the question weighing on many investor minds is, why? “Why have exceptional earnings not served to, at the very least, stabilize equity prices?”
It’s a battle that’s being waged presently between the realization of record setting profits/exceptional earnings and the theory of “peak growth”. Who wins remains to be seen, but that’s the battle being waged and wagered daily. Thomson Reuters is forecasting Q1 2018 earnings growth of 24.6% presently, presently. I stress presently because every single week that forecast is revised and most every single week it is revised higher as earnings continue to largely beat analysts’ estimates. The chart below, from Bloomberg, shows the growth in Q1 is 22.4%, which is higher than the other forecasts that don’t include any actual results.
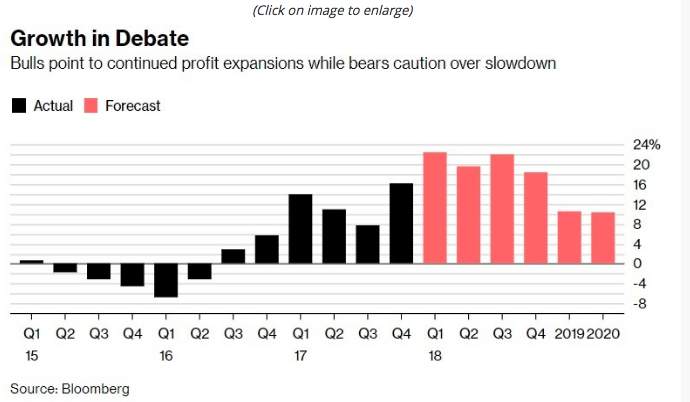
That chart looks great and does show an expectation for earnings growth to slow beyond 2018, as the laws of large numbers set in. Having said that, earnings are still expected to grow well into 2020 and as corporate earnings grow, so does the S&P 500 earnings, which historically prove to boost the S&P 500. But the chart below is a somewhat different take on earnings growth from Morgan Stanley.
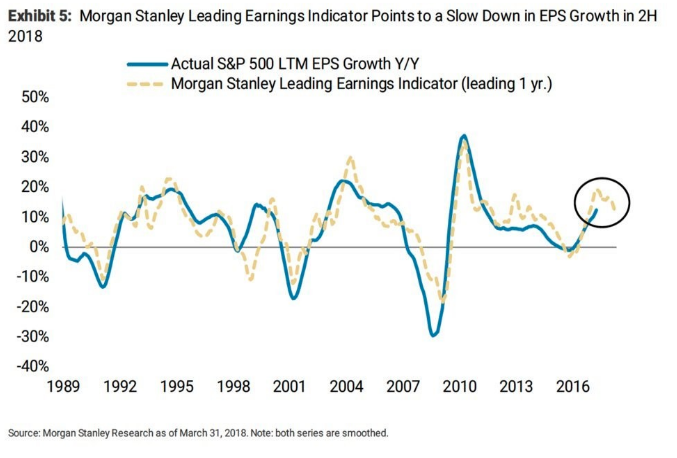
The circled, yellow dotted line shows the EPS growth is expected to slowdown in the 2nd half of 2018, based on Morgan Stanley Leading Earnings Indicators. According to Morgan Stanley, earnings growth in the second half will depend on the strength of the economy and the strength of the U.S. dollar. When we look at the chart above, we are forced to ask ourselves a couple of questions: 1. Does the consumer have the commensurate spending power? 2. Will modest reflation impact business investment? These two driving factors serve to grow the economy and are expected to increase from subdued levels in the first-quarter. Morgan Stanley also goes on to suggest the following with regards to the market’s first-quarter performance:
“According to Morgan Stanley’s Chris Metli, a strengthening dollar—the greenback put in its best monthly rise since President Donald Trump’s election in April—and a rising 10-year Treasury note yield– the 10-year yield touched its highest level in more than four years above 3% late last month—are also factors weighing on stocks. That 3% round-number level has caused angst on Wall Street, because it translates to higher corporate borrowing costs.”
With a late cycle bull market that finally corrects after nearly 2 years, the market tends to lose leadership. This has resulted in the longest market correction, now 58 days, since 2008. MarketWatch’s Ryan Vlastelica wrote that estimates for the percentage of S&P 500 sectors outperforming for two months in a row recently hit multiyear lows, and traded near multi-decade lows, citing research from Michael Wilson, chief U.S. equity strategist for Morgan Stanley.
“Rarely have we experienced such low leadership,” Wilson wrote.
So what is next for markets then if this tug-of-war is at-hand? Historically, stocks tend to perform far better after investors accept a peak earnings theory.
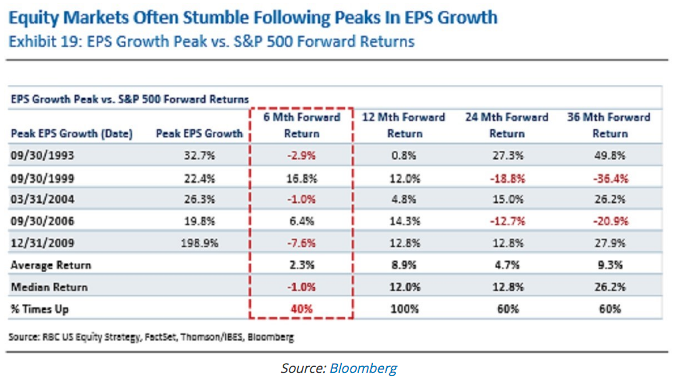
As shown in the table above by Bloomberg, after stocks stumble, they regain their footing as the average 12-month return following the peak in EPS growth is 8.9% with a 100% success rate. What the table offers is the validation of another theory widely accepted among fund managers and put forth many times by Finom Group, “markets follow earnings over time”.
The hope for Thursday is a less volatile or roller coaster ride-market day. Then again maybe that’s just the hope of long-term investors. Finom Group continues to trade what the market offers, be it daily scalps or swing trades and to coincide with long-term investments.
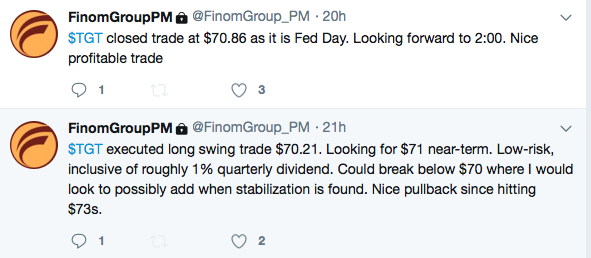
As shown in the screen shot above, from Finom Group’s private Twitter feed for subscribers, yesterday’s trade of the day was in Target (TGT) shares. The early morning dip gave way to opportunity, as Chief Market Strategist Seth Golden believes the mid-term fundamentals of TGT remain strong on a YOY basis. As such, the opportunity was taken to “buy the dip” for an intraday scalp trade. Subscribe to finomgroup.com today and receive access to all of our research, videos and trade alerts!
That brings us to Thursday’s economic data. Thursday will see jobless claims for the week ending April 28 posted at around 8:30 a.m., while services PMI (Purchasing Managers’ Index) data for April and factory orders for March is scheduled to be published during the mid-morning. Friday will see the all-important Nonfarm Payroll report, as investors will be looking for the wage element within the report that has previously been blamed for the market correction. There is always a catalyst!


