
In yesterday’s market update and financial reporting article titled Sell in May and…Not So Much, Finom Group identified that the colloquialism of sell in may and go away is not really supported by the market’s historic performance in May. Since 1998, the markets have been higher roughly 70% of the time in May. In each of the previous 5 years, May has shown positive returns. Tony Dwyer of Canaccord Genuity discuses his thoughts on May 2018 with CNBC yesterday in an on-air interview. Dwyer suggests that the old adage “sell in May and go away” doesn’t apply this year.
“When we looked underneath the surface in a non-recession environment, we found that you’ve never had a negative market going into May and then had a negative May through September. It’s more likely you’re going to have an up May through September. Ultimately, the market moves with the direction of earnings. That is definitely going to be positive for the foreseeable future.”
We’ve already discussed corporate earnings, the underlying thesis for Tony Dwyer’s 3,100 target on the S&P 500 for 22018, and at length in former articles and research reports. But to reiterate, the Thomson Reuters most recent forecast for S&P 500 earnings growth has been pushed higher, expressing a belief that earnings should grow nearly 25% year-over-year. But it’s not just earnings growth that’s outperforming prior forecast that proved to be too low, it’s operating margins, net profit margins and revenues.
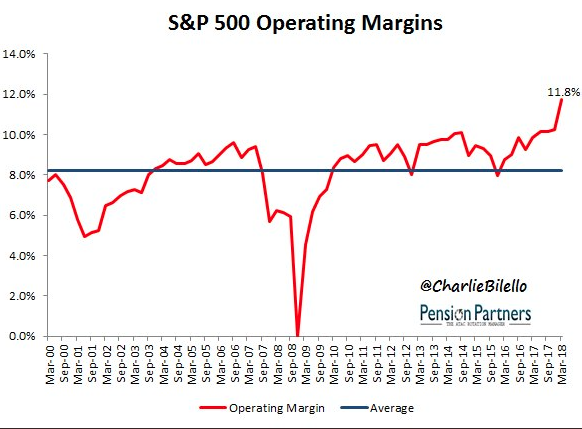
The chart above shows just how strong operating margins have become, setting all-time record highs. And that’s all good, fine and great, but the S&P 500 has been churning lower even as record operating margins are coming through. It just doesn’t seem to matter how strong companies are performing or how many times the forecast for earnings rises to investors! It doesn’t matter until it matters and history identifies quite clearly that over time markets follow earnings; it just takes…time! Until it happens though, investors will likely remain cautious and especially given the heightened levels of volatility in the markets thus far in 2018.
Moreover, the S&P has just spent its longest period in correction territory since….well, MAY of 2008. That was a pretty rough period! The S&P 500 has spent 57 days in correction territory, enough to draw a good deal of investors toward a breaking point and erode investor sentiment indeed. As of Tuesday, the S&P 500 index is off about 8.5% from its recent peak, while the Dow is 10.4% shy of its late-January record, and the Nasdaq Composite Index is off 7.7% from its recent record, put in on March 12.
There are not many good stats to report for the S&P 500 at present and during this correction period. The S&P has gone 65 sessions since its most recent record close. That’s the longest streak since a 68-session stretch that ended in November 2016. The Dow is also on its 65th trading day without a record close, its longest drought since a lengthy stretch that stretched from May 20, 2015 until July 11, 2016.
And of course that brings us into Wednesday’s Fed Policy Statement, on deck! With the Personal Consumption and Expenditures data released Monday, a measure of inflation in the economy, the Fed has achieved its inflation target of 2 percent. Many economists don’t feel the 2% level will be maintained throughout 2018, but in the interim, it can provide the Fed with cover as it raises rates.
Jan Hatzius, chief economist at Goldman Sachs, thinks core PCE inflation will show stability through early next year and rise to 2.2% by the end of next year. He sees the Fed hiking rates to a range of 3.25%-3.5 percent.

Fed officials are expected to leave interest rates on hold and signal no change to a tightening path of two more rate hikes in 2018. Expectations in the market for a rate hike are just 5.7 percent, according to the CME Group’s FedWatch tool, basically indicating no rate hike will occur at this meeting. There is no press conference or formal update to their economic forecasts at this month’s meeting. In terms of the policy statement and in light of an economic slowdown from Q4 2017 to Q1 2018, here is what Christopher Probyn of State Street Global Advisors has to offer:
“While the Fed will have to acknowledge that growth in the first quarter slowed to 2.3% annual rate in the first quarter from the 2.9% rate in the fourth quarter, the central bank will make sure to add hints that this slowdown is temporary. I can’t see any reason to create any uncertainty. I would say they are on course, and it is pretty well understood. If there is no need to raise an issue, then why do it.”
Probyn believes the Fed will have a steady as she goes, accommodative message for markets, but Diane Swonk, chief economist at Grant Thornton, believes the Fed will present a more hawkish tone.
“They will be more hawkish. It’s going to be a pretty bullish, hawkish statement — with a good economy and a warming trend. You had 1.9 percent in core PCE, the highest since January 2017. “
If indeed the policy statement appears more hawkish to investors, the markets are likely going to have a rough go of it, even as earnings come in quite strong. Yesterday’s market action was indicative of the push-and-pull that the markets have undergone over the last couple of months. At one point during yesterday’s trading session, the Dow was down roughly 350 points before staging a late day rally. The S&P was down by roughly 24 points as well and before finishing the day in positive territory, ahead of both the Fed announcement and Apple Inc.’s earnings release. Let’s take a look, briefly at what Apple Inc. reported after the closing bell yesterday.
Apple reported net income of $13.8 billion for its fiscal second quarter, or $2.73 a share, up from $11 billion a year earlier, or $2.10 a share. Analysts were expecting net income of $13.5 million, or $2.62 a share, according to FactSet. Revenue rose 16%, to $61.1 billion, and came in just ahead of the FactSet consensus of $60.9 billion. The company announced $100 billion in additional share buybacks and a 16% increase in its quarterly dividend. Apple’s third-quarter outlook calls for revenue of $51.5 billion to $53.5 billion. Analysts were expecting revenue of $51.5 billion for the third quarter. Apple sold 52.2 million iPhones in the quarter, below estimates for 53 million. The company generated $38 billion in revenue from iPhone sales, below the $39.1 billion consensus figure. Revenue from Apple’s services segment rose 31% to $9.1 billion and beat estimates for $8.4 billion. “Customers chose iPhone X more than any other iPhone each week in the March quarter, just as they did following its launch in the December quarter,” Chief Executive Tim Cook said in the release. “We also grew revenue in all of our geographic segments, with over 20% growth in Greater China and Japan.”
Apple said it would buy back $100 billion in shares and raise its quarterly dividend 16%, to 73 cents a share from 63 cents a share. The amount of buybacks we’re announcing is so large that it’s going to take us some time to execute,” Chief Financial Officer Luca Maestri told the Wall Street Journal. “Our plan is to do it at a fast pace.”
“Bernstein analyst Toni Sacconaghi sees the company raising its total shareholder-return allocation by $180 billion over the next 2½ years, through incremental buybacks of $50 billion annually as well as a 15% to 20% boost to the dividend. Such efforts could lift fiscal 2018 earnings per share by 12 cents, he argued, and fiscal 2019 earnings per share by 79 cents. Sacconaghi has a market perform rating and a $170 price target on the stock.”
Shares of AAPL rose sharply in the after hours trading session on the heels of beating analysts’ estimates and the share repurchase plan announcement. Wednesday morning, equity futures are following in Apple’s lead and marching higher. It remains to be seen if equities can finish the trading day in positive territory, however, since most rallies have been sold during this corrective period.
In terms of earnings expected out today, May 2nd, the following graphic aids to deliver on the companies reporting today.
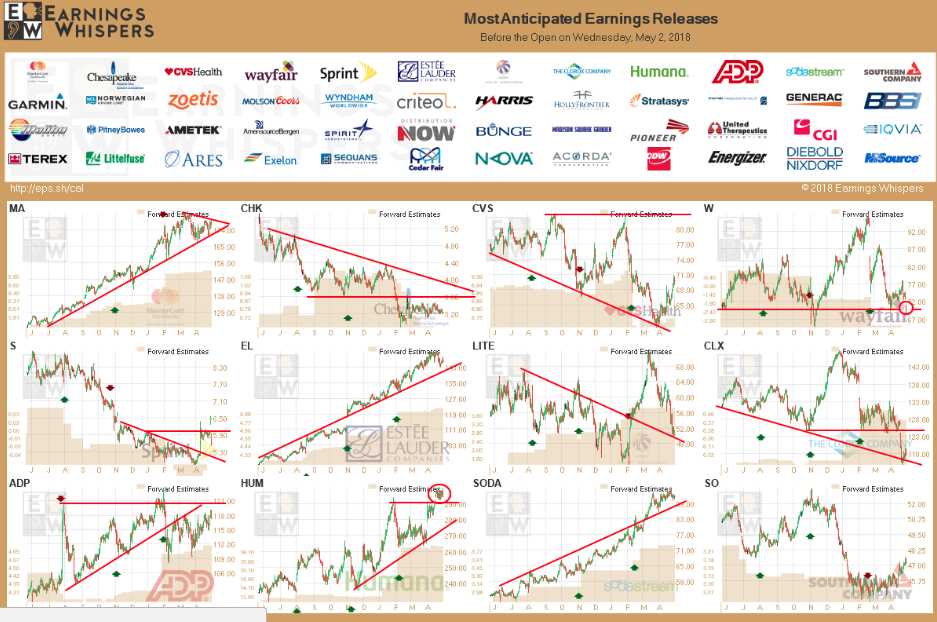
You may notice the chart of SodaStream, (SODA) expected to report quarterly results this morning and as shares have soared since 2016. With the stock rallying from $11 to nearly $100, yet only now expected to deliver revenues not seen since 2012, investors are expected to hear good things when the company reports results ahead of the opening bell. Finom Group often trades the name intraday and will look for an opportunity to participate in either direction and depending on the results. The share price has baked in high expectations with respect to the current price-to-earnings multiple, which is the highest since the company IPO’d in 2011. Garmin (GRMN) is another consumer goods company expected to release earnings today as the share price expresses a good deal of churn since last reporting its Q4 2017 results.
In yesterday’s trading session, Finom Group delivered yet another trade in the VIX-complex through shares of VXX. The screen shot below identifies our short scalp in the VIX-ETP, which delivered a quick profit.
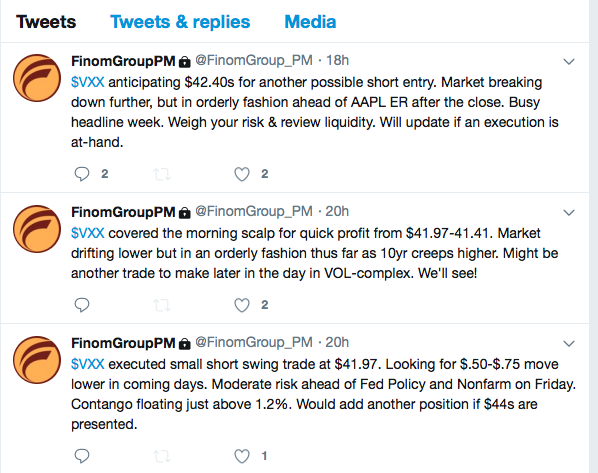
Volatility has actually been on the decline in recent trading sessions, even as the S&P 500 has taken another leg lower. As the markets were in steady retreat yesterday, the VIX wasn’t indicating a move in kind and was only slightly higher by mid-afternoon and before the S&P 500 began to rally. The VIX finished the day lower at 15.49 and is slightly lower again, ahead of the market’s open.
Some important facts to understand about the VIX and if one chooses to trade/invest with VIX-Exchange Traded Products are as follows:
- The VIX is priced from a portfolio of S&P 500 (SPX) options defined by the CBOE, and the futures price from the market’s expectation (Implied Volatility) of where the VIX Index will settle at expiration. One component in the price of SPX options is an estimate of how volatile the S&P 500 will be between now and the option’s expiration date.
- This estimate is not directly stated, but is implied in how much buyers are willing to pay. If the market has been expressing great gyrations, option premiums will be expensive. To the contrary, in a quiet market they will be cheaper.
- The moves of the VIX track prices on the SPX options market, not the general stock market; this is a key point. The SPX options market is large, with a notional value greater than $100 billion, and is dominated by institutional investors. A single SPX put or call option has the leverage of around $200K in stock value, too big for most retail or independent investors.
- The VIX Index, often referred to as “spot VIX”, is simply the implied 30-day volatility of S&P 500 options. To calculate 30-day implied volatility of S&P 500 options, a weighted average of implied volatility across a range of puts and calls (strangle) is taken such that the resulting weighted average represents synthetic 30-day implied volatility.
One of the reasons why I point to these facts concerning the VIX is for a very important reason. Most professionals know and understand the derivative nature of the VIX and the instruments within the VIX complex don’t lend themselves well to technical analysis. The efficacy rate is simply not within the realm of finding sound technical analysis that is worthy of the exercise. Nonetheless, social media participants who don’t have such an understanding will use TA to guide their participation with VIX-ETPs. The following screen shot is taken from a popular social media site geared toward traders, StockTwits.
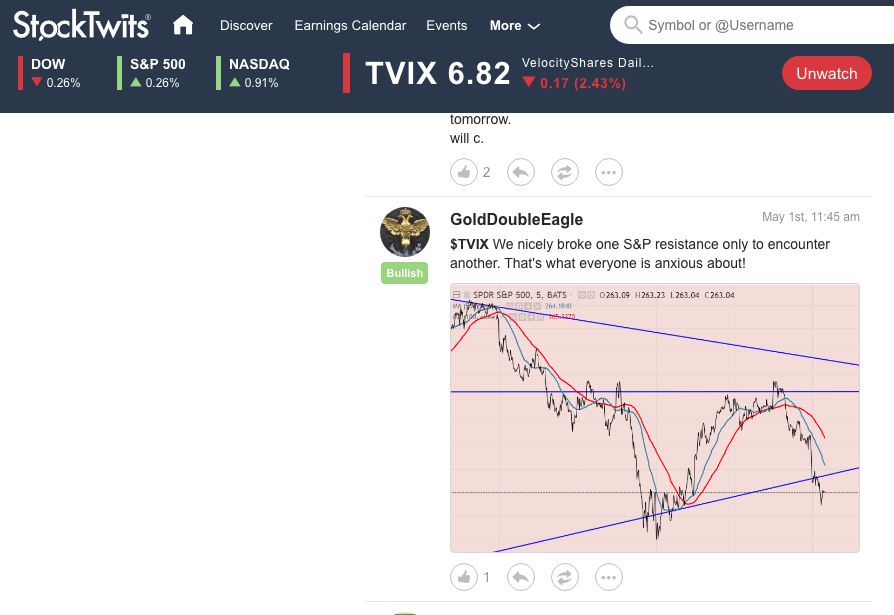
Traders beware!!! Not all investment vehicles and/or instruments are created equally and not all hold the principles for using technical analysis. Subscribe to Finom Group today and receive all of our research reports and trade alerts in real time. Good luck traders and investors!


