
The first 5 trading days of the year are now in the book. CNBC wrote an article about it, to set the stage for what investors might expect given the first 5 days of the year trading statistics. According to the Stock Trader’s Almanac, when the first 5 trading days show a gain, the S&P is up 82% of the time for the whole year going back to 1950. What else? Well LPL Financial decided to push the envelope and find out what happens when gains are really big in the first 5 days of the year, as they were in each of the previous 2 years.
Keeping in mind that when the first 5 trading days of the year have been negative, the S&P 500 is up only 60% of the time when the first 5 days have been lower, and here there is indeed something that proves compelling when market gains are really strong in the first 5 trading days of the year.
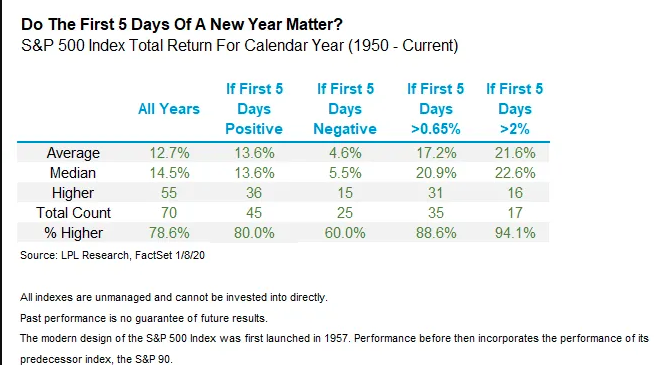
When those first 5 days have been up more than 2%, the full year return has been positive an impressive 16 of 17 times! Only 2018 didn’t follow suit when the first five days were up 2% or more. 2018 broke a lot of historic patterns quite frankly, which goes to prove that one shouldn’t necessarily invest based on the past as future results can differ greatly. But there’s more…
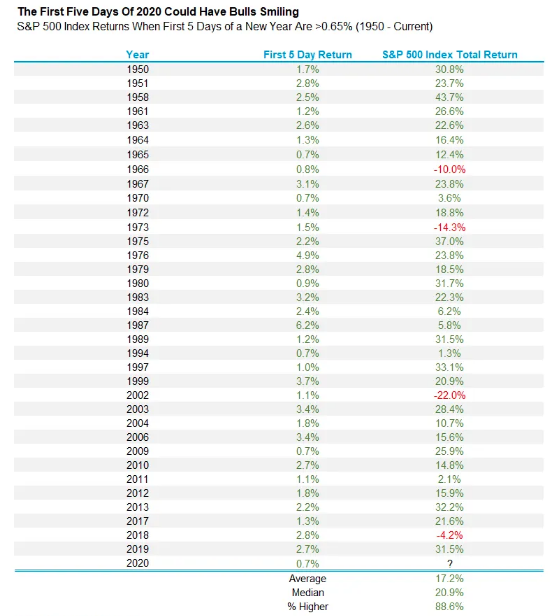
As shown in the LPL Chart of the Day below, when the S&P 500 has gained more than 0.65% the first five trading days of a new year, like 2020 to-date, the full year has finished in the green 31 out of 35 times, with a very solid 17.2% average annual return.
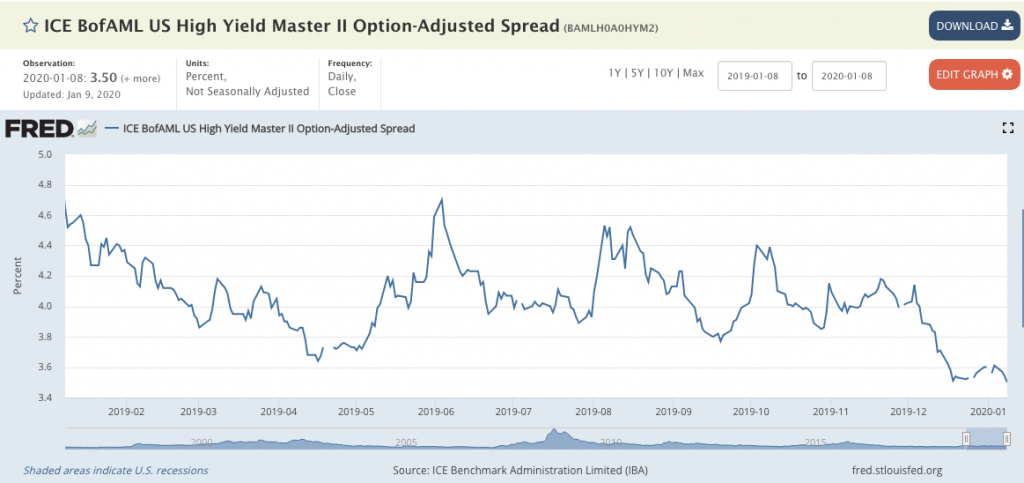
While the 5-day rule is technically about the S&P 500, the fact that U.S. small caps (Russell 2000 and S&P 600) are down YTD is a troubling signal for this slice of U.S. equity markets. Small cap valuations correlate with high yield spreads. Those are already tight and seem unlikely to improve much near-term. Therefore, the fact that small caps are down YTD is not a signal that the broader U.S. equity market is in trouble.
Equity markets have moved sharply higher on the latest uprising/conflict that seems to pervade the White House Administration. The Administration seems to move from one crisis to the next, causing a stir and then in due time de-escalating the situation through one means or the other. The latest U.S./Iran conflict was found with de-escalation on Wednesday with the U.S. choosing to avoid a more deliberate, yet expanded, military confrontation with the Middle East foe.
As we look ahead to the final day of the trading week, which has been anything but smooth, the weekly expected move has yet to be achieved on the S&P 500 cash. The S&P 500 heads into Friday’s economically-data driven day at record highs and within 4-5 points of achieving the upper bounds of the weekly expected move of $44/points (S&P came into the week at 3,234).
From a technical and/or breadth standpoint, the market remains quite overbought. We feel like that has been a theme for markets over the last 2 months and yet… In this past weekend’s weekly Research Report, we offered our subscribers the following chart and commentary:
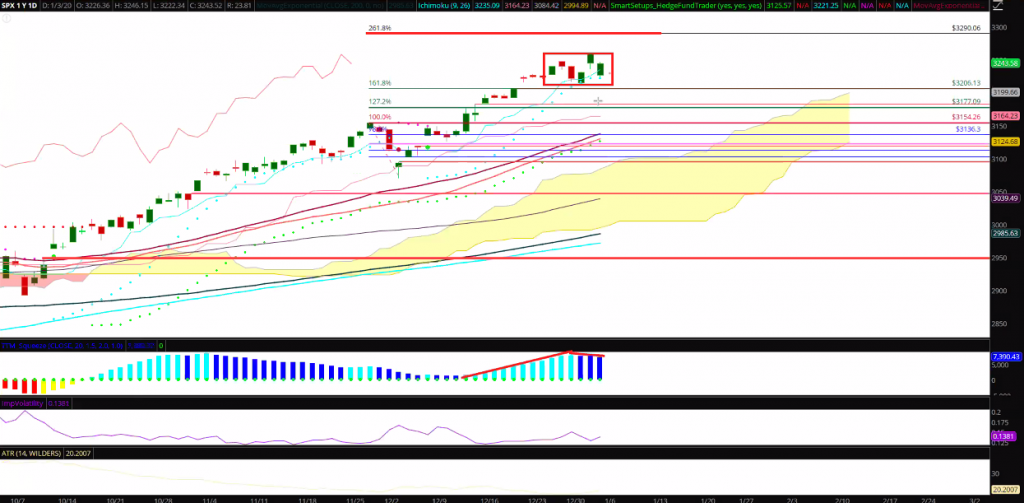
“The S&P 500 chart above identifies the the island top, potential technical formation but also… On Thursday, the S&P 500 gapped higher. On Friday the S&P 500 filled the gap. This happened and proves interesting, but for obvious geopolitical reasons. Nonetheless, bullish candles outnumber bearish candles and the Fibonacci 6.18 level seems to be a magnet just above current levels, at 3,290.
So here is what a CMT (Certified Market Technician) might say about the current technical formation in the chart above: “A move to 3,210 for the S&P 500 would likely put traders on alert for a potential island top at the highs.” What we would say is that, “If the bulls desire the uptrend to continue to seek and achieve the Fibonacci level noted, they will need to make a stand this coming week.” Breadth is at the bulls back, but that can shift rather quickly.”
It very much appears that the bulls have made a stand and breadth remains quite strong, and that is to put it modestly as shown in the chart of below:
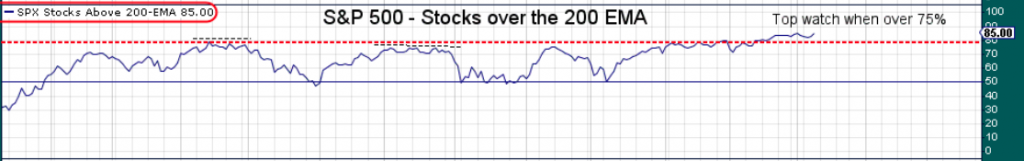
The number of stocks trading above the S&P 500’s 200-EMA has hit 85%, up another 2% from the previous week. This evidences the fact that breadth remains strong, but in overextended/overbought territory. There are very few “deals” left in the markets. It’s for this reason we would propose that a good many “smart people” are on the sidelines in cash.
As mentioned briefly, small caps have lagged large caps to this point in the New Year. An interesting finding from DataTrek shows exactly where the S&P 500 gains have come from in the first few days of the new year.
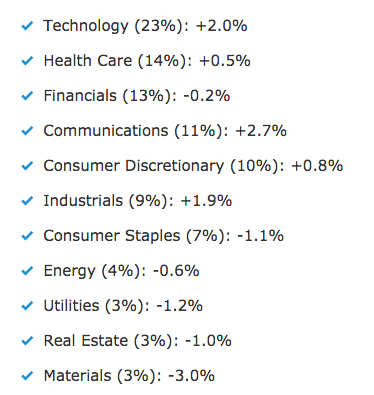
Aint it something? The entire reason the S&P 500 is up 69 basis points on the year comes down to Tech (46 bp contribution) and Communications (30bp). Alphabet (GOOGL) and Facebook (FB) dominate the latter sector, and both are up 5% already in 2020 with Facebook barreling through $215 with strength and Google breaking up and beyond $1,410. In other words, 2020 is starting off as another strong year for Big Tech.
The most important factor for the market Friday is undoubtedly the Nonfarm Payroll report set to be delivered by the Bureau of Labor and Statistics at 8:30 a.m. EST. With this key piece of economic data in mind that has the potential to move markets one way or the other, we aim to review what economists and analysts are forecasting for job and wage growth in the month of December 2019. The following table identifies economists’ estimates as surveyed by MarketWatch.
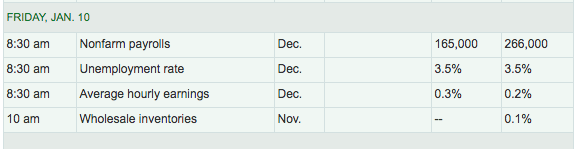
It’s important to denote that while job growth is expected to slow from the November 2019 period, monthly revisions will also be highly relevant to investors. Additionally and heading into the monthly payroll report, other labor and employment reports are suggesting the labor market remains strong.
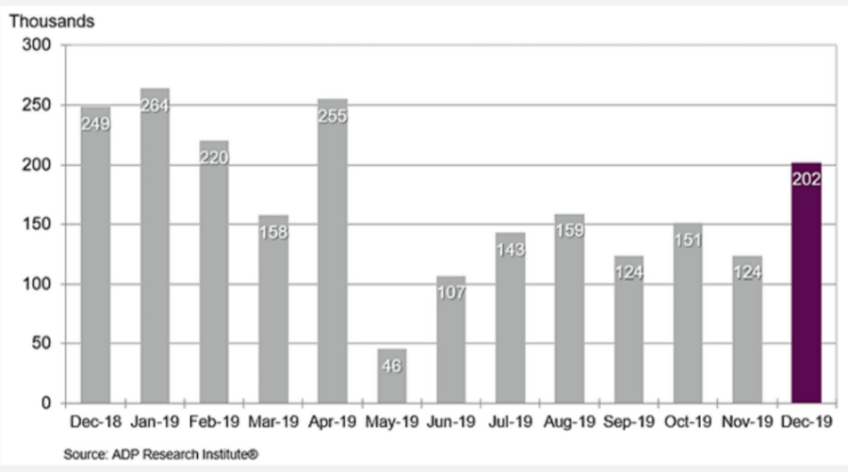
The ADP employment report showed an increase of 202,000 private sector payroll jobs were added in December 2019. This was well above consensus expectations of 156,000 private sector payroll jobs added. October ADP data was revised up 30,000 from 121k to 151k and the November ADP data was also revised up from 67k to 124k.
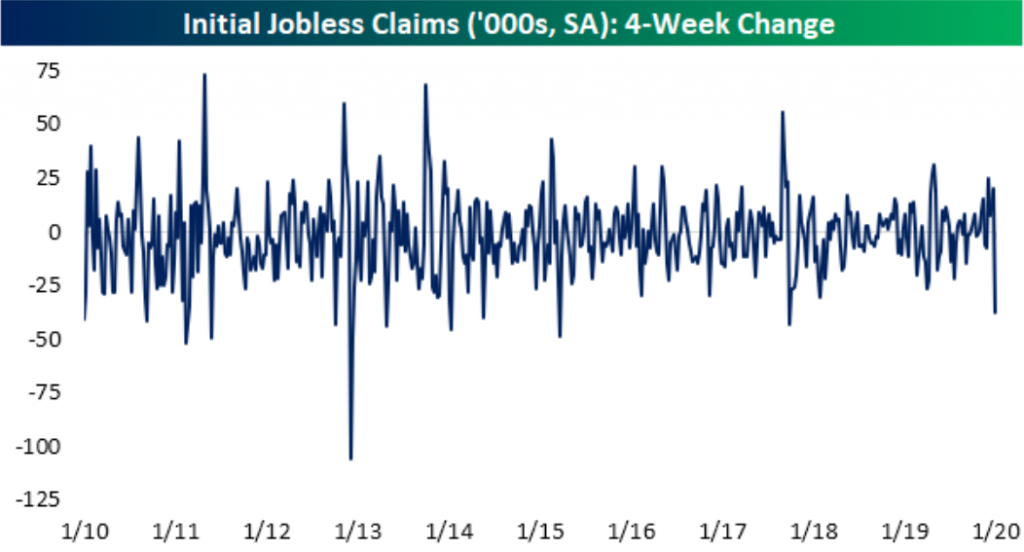
Moreover, initial jobless claims have fallen 38K since the spike up to 252K around Thanksgiving. That is the largest decline in a four-week span since September of 2007:
Cornerstone Macro Research’s Nancy Lazar says her payroll model suggests December jobs rose 146k vs. consensus at 160k. Lazar admits that the 202k gain in December’s ADP report signals upside risk. As for wages, Nancy is inline with the consensus estimates at .3% MoM increase.
Goldman Sachs economist Spencer Hill: We estimate Nonfarm payrolls increased 185k in December … We estimate an unchanged unemployment rate at 3.5% … we estimate average hourly earnings increased 0.2% month-over-month, lowering the year-over-year rate to 3.0 percent.
The BofAML job tracker declined sharply in December to 54K, down from 195K in November, suggesting fewer jobs were added in December when compared to the previous month. With this in mind, BofAML forecasts Nonfarm payrolls growth of 150k in Friday’s December 2019 employment report. The firm also expects the unemployment rate to tick up to 3.6% from 3.5 percent.
The consensus estimate for the soon to be released Nonfarm Payroll report is for a gain of approximately 160,000 net new nonfarm jobs. This is a lot lower than the 202,000 that ADP reported. Historically, the market has responded less than positive to the jobs report released in January, as outlined in the Trader’s Almanac. The table below dates back to 2000 and identifies the various index performance based on the Nonfarm Payroll report released in the month of January.
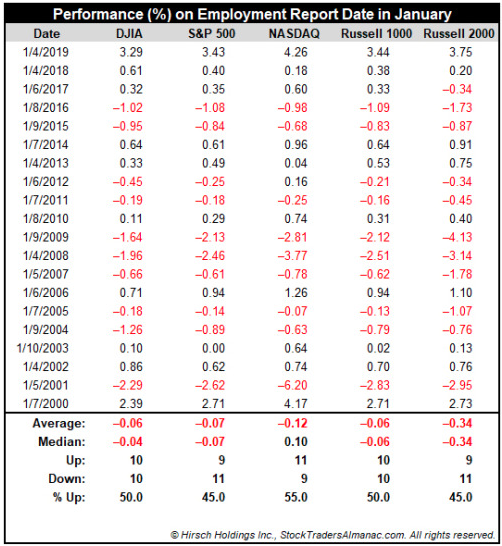
The S&P 500, NASDAQ, Russell 1000 and Russell 2000 have all posted average losses on the day in the last twenty years. S&P 500 and Russell 2000 both logged eleven losing years.
The first 5 days of the year are in the book with a key piece of economic data set to be released… and the S&P 500 is already up >1% in 2020. Since 1950, the full year has been higher 90% of the time and up 18.6% on average (total return) when this happens.
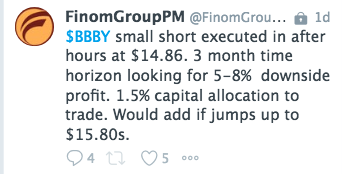
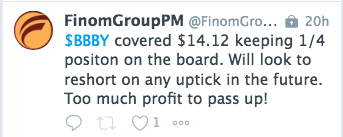
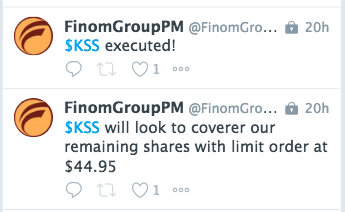
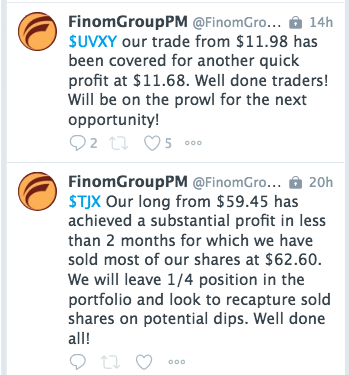
After a strong start to the year for markets, Finom Group’s trade alert service is also off to another strong start as we’ve completed some 10 trade alerts on the year. Some of our more recent trades in the retail and volatility complex are depicted below:
Subscribe to finomgroup.com today and trade with us in our Live Trading Room daily and weekly. We offer a robust dialogue on daily market activity, economic data and the macro headlines on the minds of traders and investors.


