
Welcome to this week’s State of the Markets with Wayne Nelson and Seth Golden. Please click the following link to review the SOTM video. In 2020, markets continue there seemingly endless melt-up. We all know that when valuations stretch too far beyond their historic average, unkind things tend to take place in the market. Currently, sentiment and market breadth register at extreme levels, but the low liquidity market and lack of selling volume has found the bull with legs. The reasons to be a seller are few and far between at the moment, shy of valuations and which hasn’t been the case through much of the bull market. We suggest the bull market will carry forward, but not higher in a straight line and not without a near-term correction. Without a recession on the horizon and with earnings projected to rebound in 2020, have that shopping list of stocks/ETFs ready.
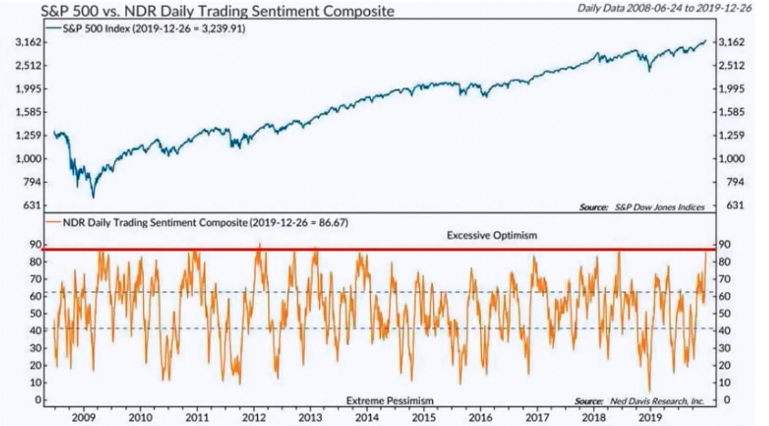
- NDR’s Daily Trading Sentiment Composite almost hit 90 recently.
- This is extremely stretched, only a few days in history ever got this high.
- In early 2009 & 2013, Stocks kept rallying anyway. All other spikes led to significant pullbacks.
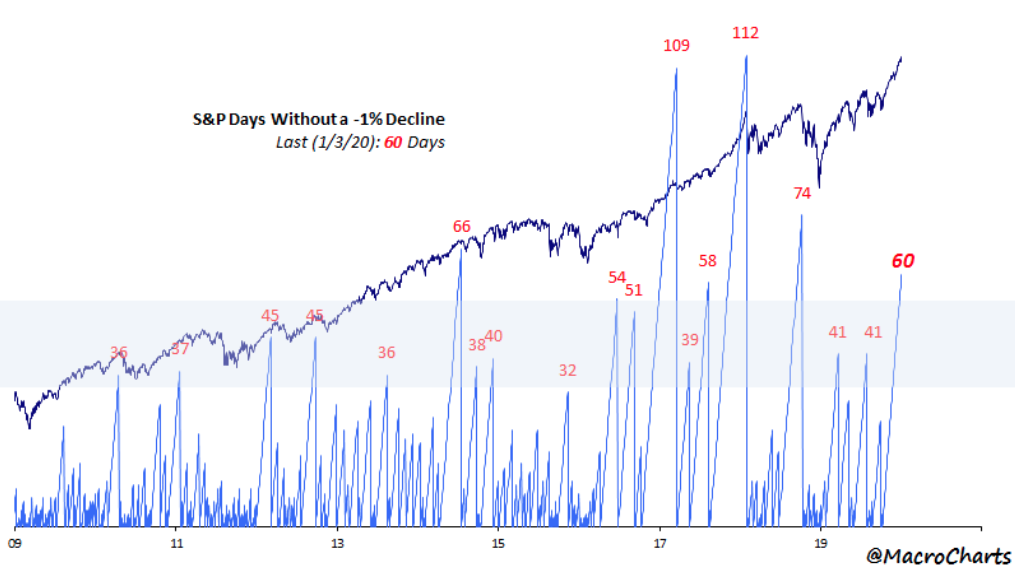
- Starting the new decade with the 5th longest easy streak since 2009.
- This can obviously continue based on the stats in the chart above, but history has not been kind to stocks when things got this easy and overbought without a interim drawdown of greater significance.
- Be ready for a regime change potentially in Q1 2019, even if temporary.
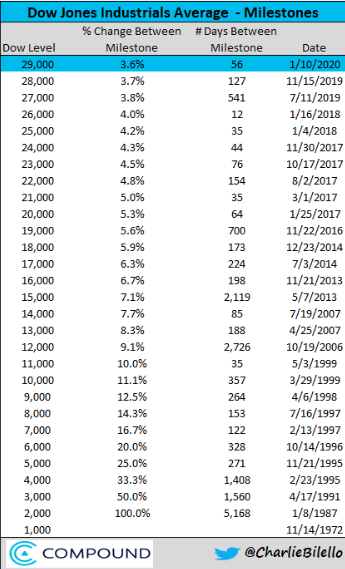
- Dow crosses 29,000 for the first time in history.
- It took just 56 days to move 1,000 points to achieve this level.
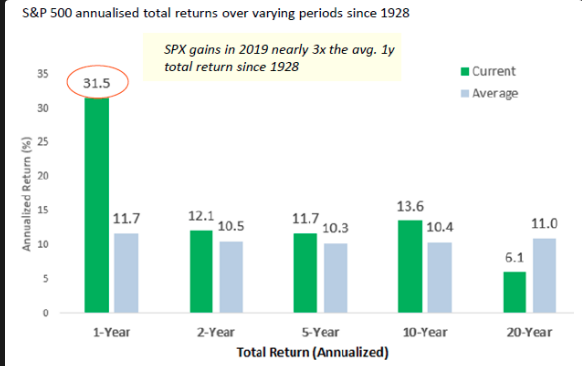
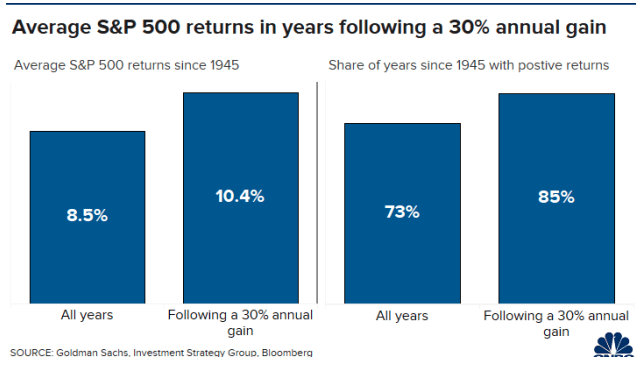
- Average returns over different time period.
- Michael Hartnett of BofAML latest thoughts:
- Maximum liquidity (annualizing $1.1tn)…SPX 3333 by 3/3, GT10 yield 2.2% by 2/2 remain melt-up targets.
- Record inflows to bubble bonds; BofA Bull & Bear Indicator up to 6.5…investors most bullish since Mar’18.
- We recommend “sell-into-strength” as 10-year yield moves >2.2% & as SPX PE ratio approaches 20x.
- This week sees record inflows to bubbly bonds; credit spreads (IG AA, HY BB) cyclical lows; equity leadership stretched (AAPL >40% above 200dma), volatility not at lows, investors have priced in PMI recovery >55 but no inflation.
- Fresh gains on the back of goldilocks Dec payroll, Jan 15th trade deal, passive Jan 29th FOMC) should create peak bullishness and dovishness; we would recommend a “sell-into-strength” strategy should the 10-year yield move above 2.2% and as the SPX PE ratio approaches 20x.
- As in 2018, underperformance of high yield bonds (HYG), semiconductors (SOX), homebuilders (XHB), banks (BKX) should be viewed as a prelude to a “top”.
Goldman Sachs: “Given our view of a low probability of recession…the economic and policy backdrop favors staying invested,′ said Mossavar-Rahmani. Historically, when the S&P 500 has returned 30% on a rolling 12-month basis—as it did in 2019— the next year’s returns average 10.4%, with a positive price return 85% of the time.
“Strong erstwhile returns have borrowed from future gains.
Goldman’s base case estimates the S&P 500 will return 6% in 2020, with a 55% probability. In its good case, the 500 stock index will return 12%, with a 25% probability.
The probability of a positive one-year return in U.S. equities in an economic expansion is 87%.”
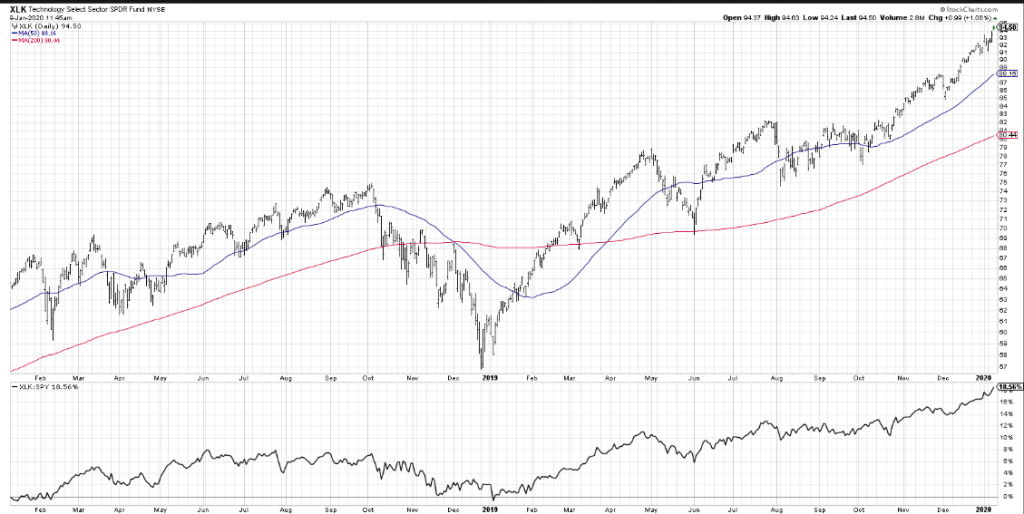
- The chart above identifies the S&P 500 up top and the XLK:SPY ratio.
- This ratio is at its highest level over the last 2+ years.
- “Any bull market covers a multitude of sins, so there may be all sorts of problems with the current system that we won’t see until the bear market comes.” -Ron Chernow
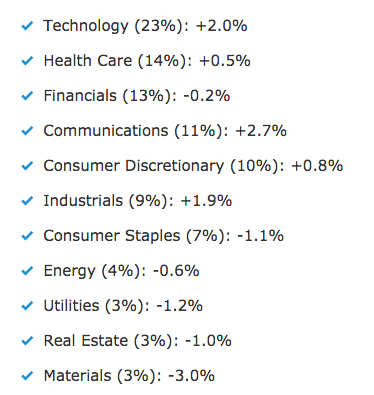
- The entire reason the S&P 500 is up 69 basis points on the year comes down to Tech (46 bp contribution) and Communications (30bp).
- Alphabet (GOOGL) and Facebook (FB) dominate the latter sector, and both are up 5% already in 2020 with Facebook barreling through $215 with strength and Google breaking up and beyond $1,410.
- In other words, 2020 is starting off as another strong year for Big Tech.

- Bed Bath & Beyond’s gross margins have decline for the last 5 years and are lower today that during the Great Financial Crisis.
- While analysts came out recently with turnaround, hope-filled price targets beyond $18 per share, the company continues to falter.
- YouTube video outlining that the discretionary retail goods provider may struggle to survive in the coming years.
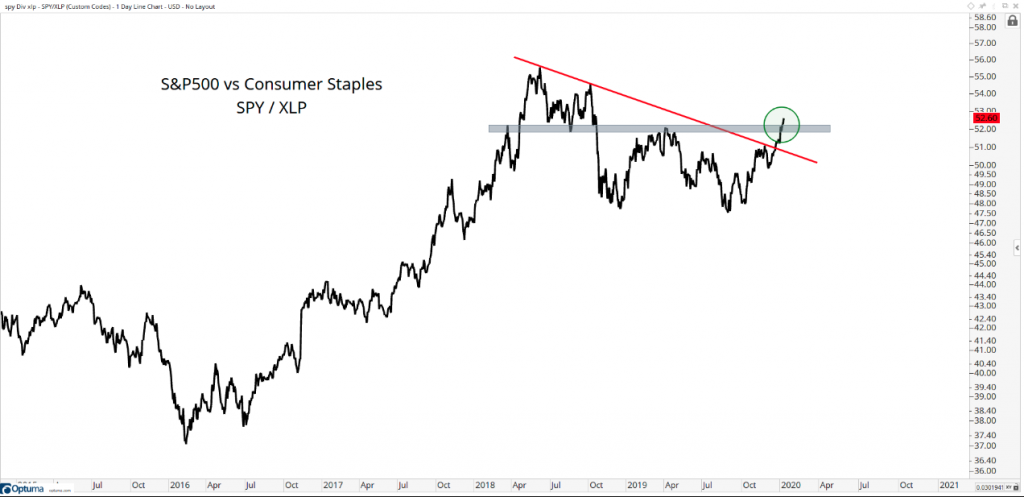
- Consumer Staples are making new 52-week lows relative to the S&P500:
- The breakout in this chart suggests we’re in an environment where stocks as an asset class are going up, not down.
- When stocks are going up, it pays better to own stocks rather than be short them.
- If we’re above those April highs in this ratio, the weight-of-the-evidence continues to suggest that we spend our time looking for stocks to buy and not looking for stocks to sell.
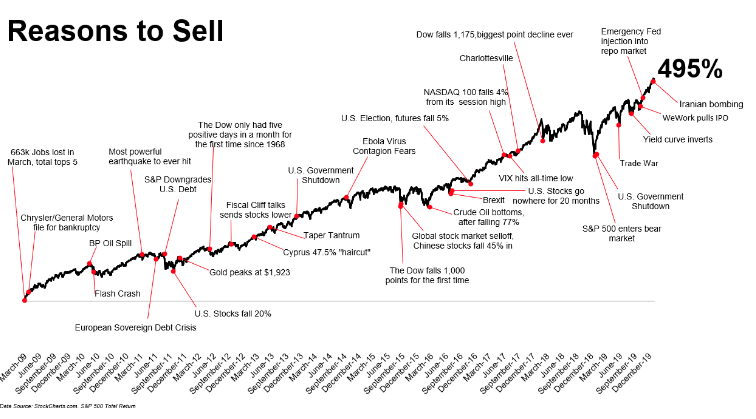
- Disaster looms around every corner, so say the clickiest headlines. But reasons to buy? Well, those are a bit trickier to track down.
- Ritholtz Wealth Management’s Michael Batnick found that out when he created this “Wall of Worry” that investors have been climbing the past decade.
- “The hard part wasn’t coming up with the list, but rather choosing what to leave off,” Batnick wrote Wednesday in a blog post.
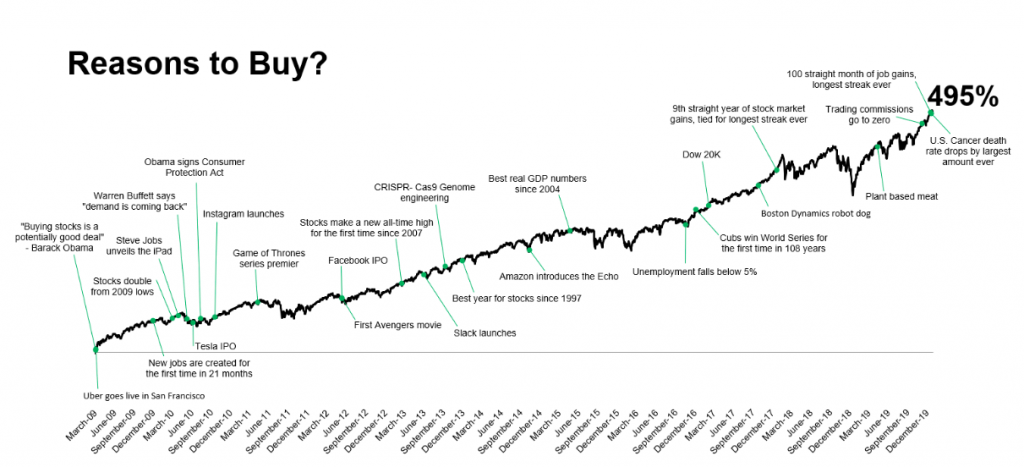
- “It’s impossible to deny that things have dramatically improved since the end of the recession,” Batnick wrote.
- “But the reason why I struggled to fill up the chart above is because gradual improvements go unnoticed.”
- “You would think that keeping up with the market is as simple as buying an index fund and leaving it alone,” Batnick concluded in his post. “And it is that simple, but it isn’t that easy, because bad news smashes your face against an amplifier, while good news just plays quietly in the background.”
- Don’t follow biased investors, regardless of how fancy their charts are.
- Learn to think for yourself & always analyze both side of the story as you can be wrong.
- This industry has a short term memory so track people’s transparency & track record.
- The economy created 145,000 jobs in the final month of 2019 to cap off the ninth straight year in which new hires topped the 2 million mark.
- The unemployment rate, meanwhile, stayed at a 50-year low of 3.5%.
- What’s more, a broader measure of joblessness known as the U6 rate fell to 6.7% to mark the lowest level on record.
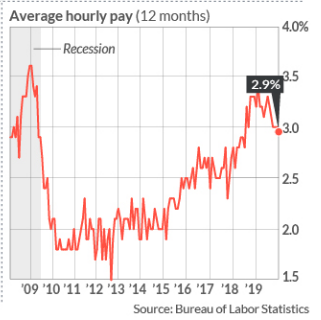
- The pace of hourly wage growth fell below 3% in December for the first time in a year and a half.
- The increase in new jobs in November was trimmed by 10,000 to 256,000, while October’s tally was reduced by 4,000 to 152,000.
- The 12-month avg of 159k is still above the roughly 115k pace needed to hold the unemployment rate steady at current rates of participation, unemployment & pop growth.

- Monetary, tax and trade policies all helped drive soaring stock and bond returns in 2019. They aren’t likely to be as influential in 2020, which has implications for how to invest.
- Federal Reserve stimulus: At its meeting last week, the Fed affirmed it is on hold and suggested it would take a major economic move for it to either raise or lower interest rates in 2020. Fed rate cuts were a big driver of stock and bond gains in 2019 and additional bond buying to shore up the overnight lending market added liquidity late in the year. In 2020, rates are likely to be stable and the excess liquidity removed.
- Fiscal policy: The impact of tax reform was already waning in 2019, but investors have held out hope that there could be more tax cuts or fiscal stimulus in 2020. Given the polarized election year environment and the potential for gridlock, I think additional fiscal stimulus is unlikely in the coming year.
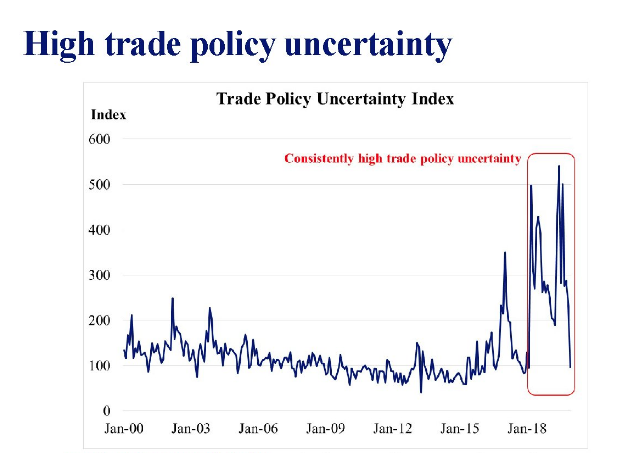
- Trade levers: While a trade deal would serve to de-escalate tensions, the terms of the current proposed Phase One trade deal with China, as well as the proposed deal with Mexico and Canada do not seem likely to be economically meaningful in 2020 and their benefits have already largely been priced into markets. Once they are behind us, it’s hard to see upside from further trade policy gains in 2020.
- I expect actively-managed funds to outperform index funds and stock and bond markets to be range-bound, but more volatile.

“This is a market looking through fundamental data, looking through corporate guidance and data points, looking through Fed guidance itself,” Lisa Shalett, the chief investment officer at Morgan Stanley Wealth Management, told Bloomberg Television.
“It is a market that wants to go up in the short term. That is what makes it so profoundly dangerous.”
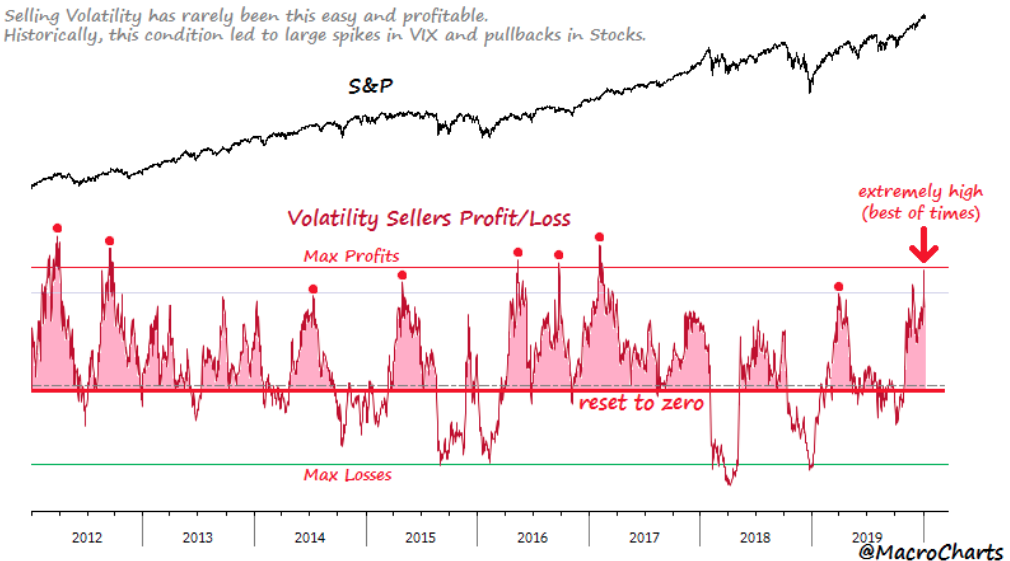
- Volatility Seller P&L Model (updated from Dec 3). Among the most extreme levels in a decade.
- Risk remains significant for some mean reversion.
- Base case: Look for a reset to zero (market takes all profits back) from those without a strategic plan.
- Long way until then, potentially.
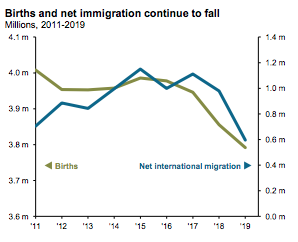
- Last week, the U.S. Census Bureau released population estimates through July 1, 2019, revealing a continued slowdown in population growth.
- The population grew by just 0.5% or 1.5 million people, which is by some estimates the slowest growth rate in a century. This was driven by two factors: a decline in both the natural increase in population and net international migration.
- The natural increase, which is the number of births minus deaths, fell to one of the lowest levels since the Great Depression, while births themselves decreased to levels not seen since the mid-1980s, and deaths continued to rise.
- Net international migration fell to 595,348, nearly half the level it was just a few years ago, also the lowest in decades. Slower population growth has significant implications for long-term growth because it limits both demand itself and the ability to meet demand.
- With weaker population growth, there is less demand in key sectors of the economy, such as housing and autos, and consumption broadly. For the demand that does exist, companies may have trouble meeting it given that the pipeline of available workers is not being adequately replenished by population growth or migration as older generations retire.
- In short, from both a supply and demand perspective, slower population growth makes it harder to achieve even 2% GDP growth in the long run.


