
Welcome to this week’s State of the Markets with Wayne Nelson, Seth Golden and our special interview guest Michael Listman. Please click the following link to review the SOTM video/interview. This week we had the pleasure of interviewing Michael Listman, (UVXYTrader on Twitter) who specializes in trading Volatility and Volatility Exchange Traded Products (ETP). In addition to the interview, please review our weekly market notes below alongside the latest research notes and outlook on the market from Morgan Stanley’s Chetan Ahya. Breadth indicators remain with a bullish outlook for the market even as overbought conditions persist.
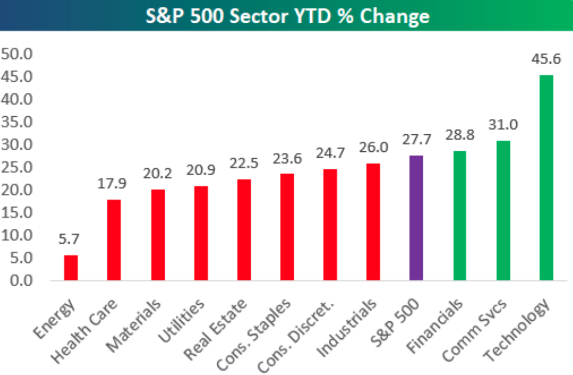
Tech sector now up 45.6% in 2019.
- Only three of eleven sectors are up more than the S&P 500 (Communication Services and Financials the other two)
- Tech’s 23% weighting has huge impact on overall market move.
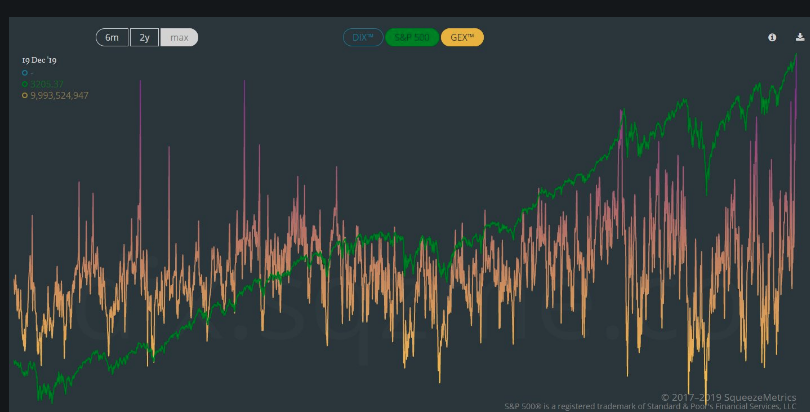
- New multi-year high in gamma exposure folks
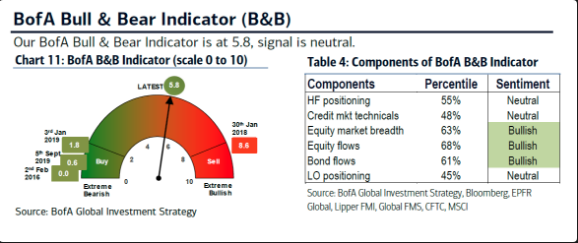
- BofA Bull&Bear Indicator highest since April 18
- Rises to 5.8 from 5.6 on EM debt inflows & improving equity market breadth.
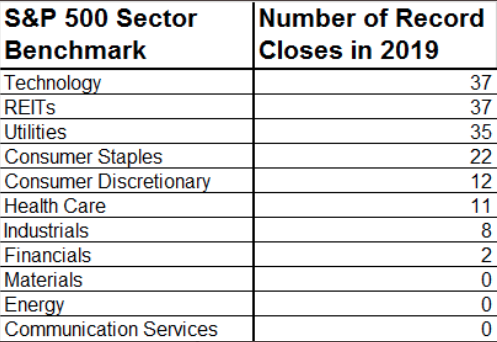
- The S&P 500 Technology Sector has achieved its 37th record close of 2019, tying the previous leader, REITs, which last charted a record high at the end of October.
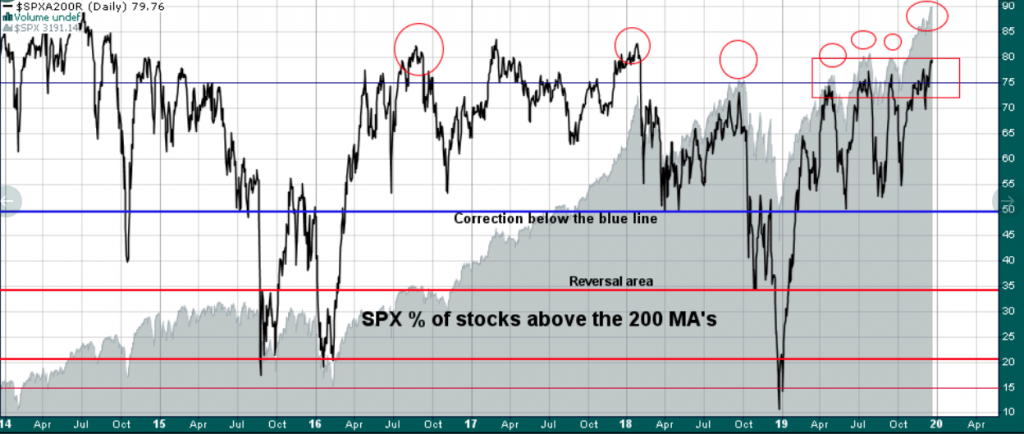
- Stocks over their 200-DMA in the S&P 500 at 80%.
- Generally you look for tops at 75% – 80%
- Seasonality should always be taken into consideration as the Santa Claus Rally may impact topping formation.
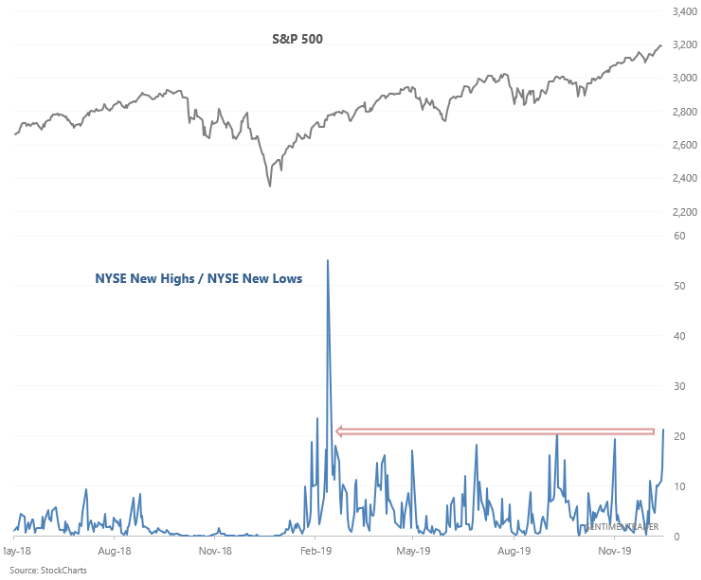
- The ratio of NYSE New Highs vs. New Lows has spiked to the highest level in more than 200 days.
- When this happened in the past, the S&P 500 almost always rallied over the next year.
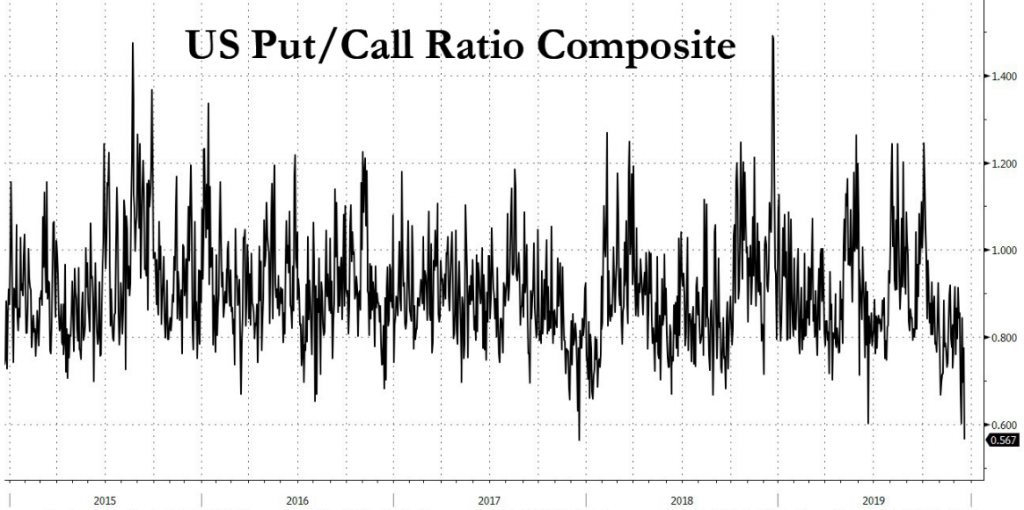
- Over the last several years, it is rare to see markets this complacent.
- Trade war rhetoric has died down of late and with the phase-1 agreement announced by both the U.S. and China.
- This has lead to a steep decline in the Put/Call Ratio Composite Index
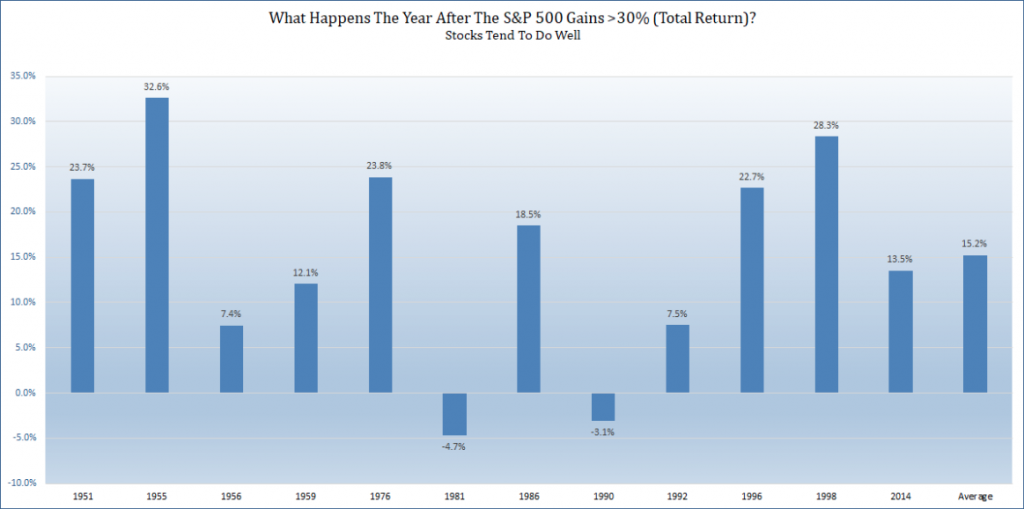
- S&P 500 could be up >30% (total return) in 2019 when it is all said and done.
- Historically, the following year has been higher 10 of 12 times and the avg. return is 15.2%. (See Chart from Ryan Detrick below)
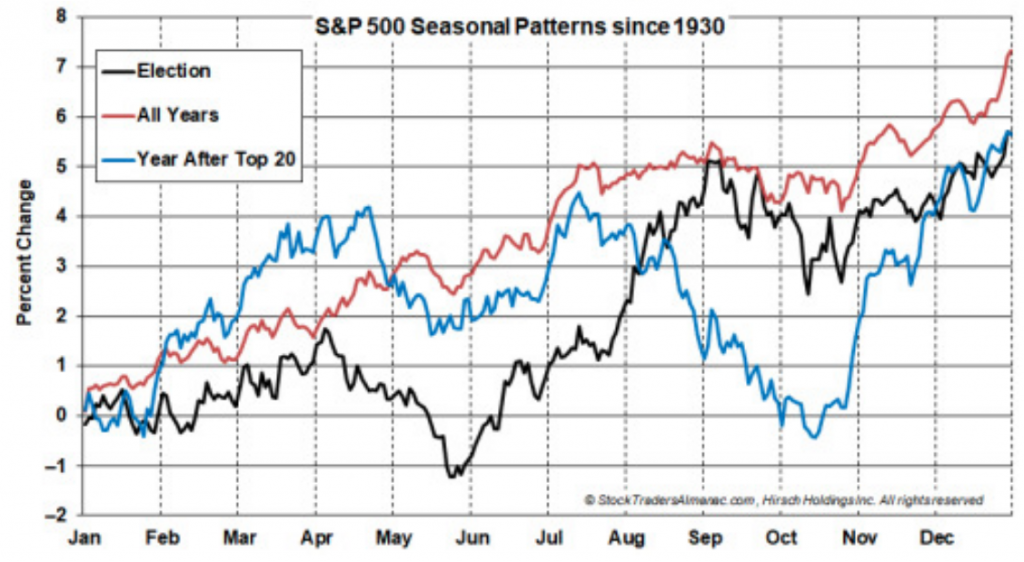
- “Such strength could cause some concern that the market could be “borrowing” from next years performance. However, that does not appear to be entirely the situation. Using the years after the big years, the following seasonal pattern chart was produced for the S&P 500. The chart contains the seasonal pattern of “All Years,” “Election” and “Year After Top 20.” S&P 500 exhibits a similar pattern in the beginning of the year, but by the end of the full-year it ended with nearly the same average performance as its peer indices.”
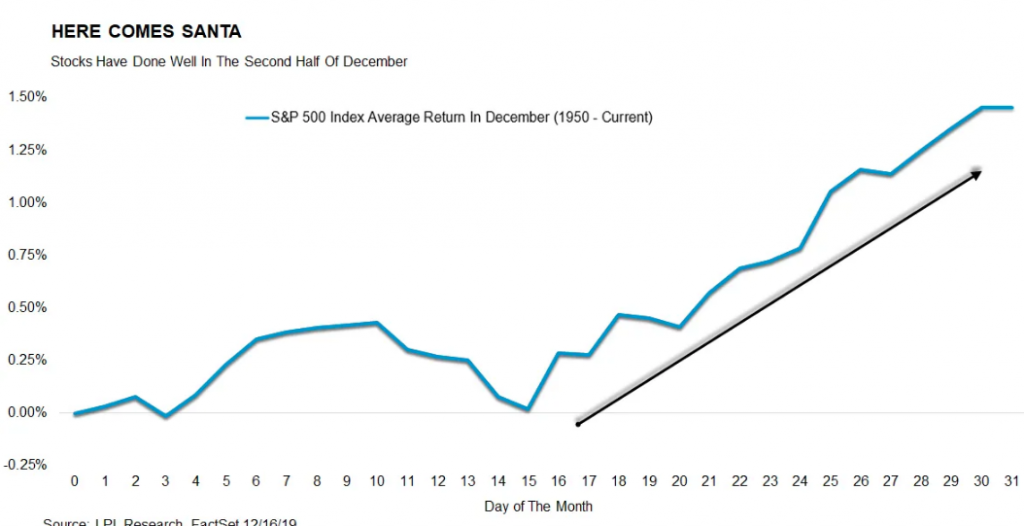
- Turns out, the majority of December’s gains have tended to happen in the second half of the month.
- Last year, the S&P 500 fell more than 9% during the month and most of the losses did indeed defy the typical seasonal pattern in December.
- Christmas Eve 2018 found the S&P 500 falling to it’s low point of the year.
- The chart below identifies the typical month of December S&P 500 and why many are still anticipating the Santa Claus rally.
- “Santa Claus tends to come to Wall Street nearly every year… This has been good for an average 1.3% gain since 1969.” –@AlmanacTrader
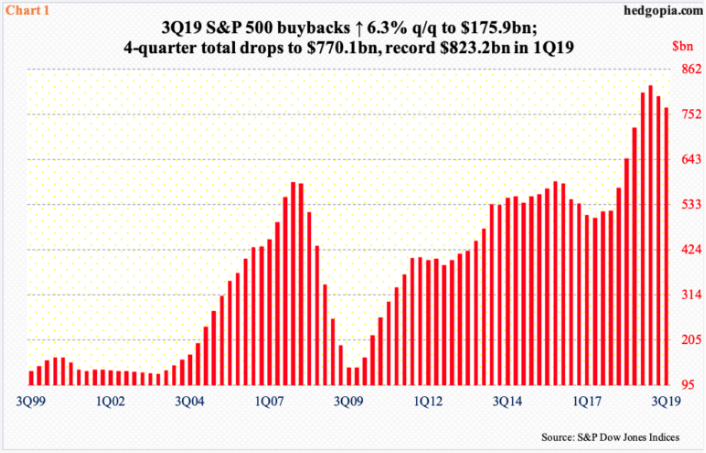
- Buy backs by S&P 500 companies continue at an aggressive pace. This makes up for shortfalls coming from margin debt and money market assets.
- After a two-quarter decline totaling $57.5 billion, S&P 500 companies spent $10.4 billion more in buying back their own shares than they did in 2Q19. The all-time high of $223 billion was set in 4Q18.
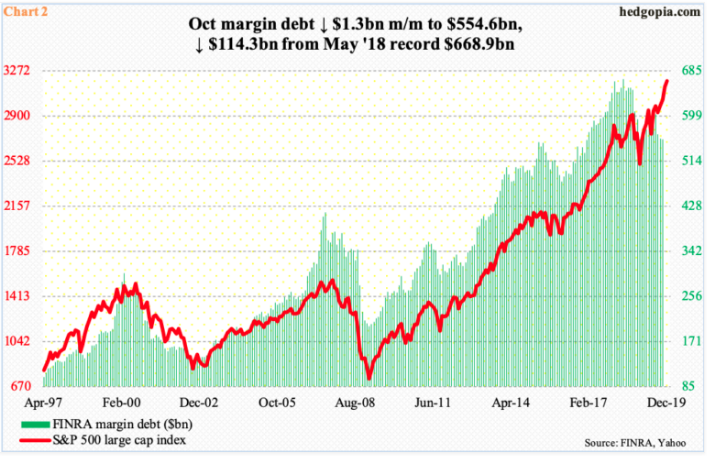
- This is coming at a time when margin debt is not quite cooperating. November’s data should be out any day now, but October showed FINRA margin debt fell $1.3 billion month-over-month to $554.6 billion
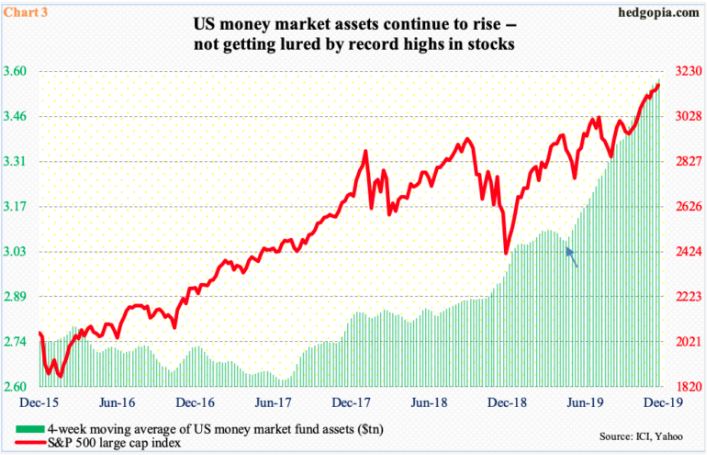
- This is also at a time when cash continues to pile up on the sidelines. US money market assets, as of Wednesday last week, had risen to $3.62 trillion – the highest since July 2009.
- On a four-week basis, these assets stood at $3.58 trillion
- US Leading Economic Index: +0.09% over past yr, slowest growth since 2009.
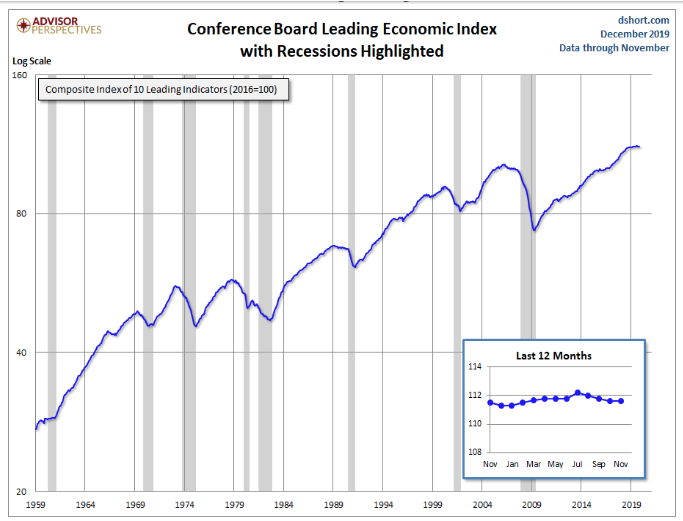
- Last 5 times LEI went from + to – YoY… -Aug 2006 (recession Dec ’07) -Nov 2000 (recession Mar ’01) -Jan 1996 (only 1 month neg, no recession) -Oct 1989 (recession Jul ’90) -Jul 1981 (recession Jul ’81)
- Consumer spending rose 0.4% last month, the government said Friday. That’s the biggest increase since July.
- The cost of goods and services also increased slightly in November, but inflation more broadly was still quite low.
- Incomes climbed a solid 0.5% last month, rebounding from a flat reading in October that economists viewed as an anomaly.
- Consumers were also able to pocket some more savings. The savings rate edged up to 7.9% from 7.8%.
- The so-called PCE price index rose 0.2% last month to push the yearly rate of inflation up a tick to 1.5%. That’s still well below the Federal Reserve’s 2% inflation target, however.
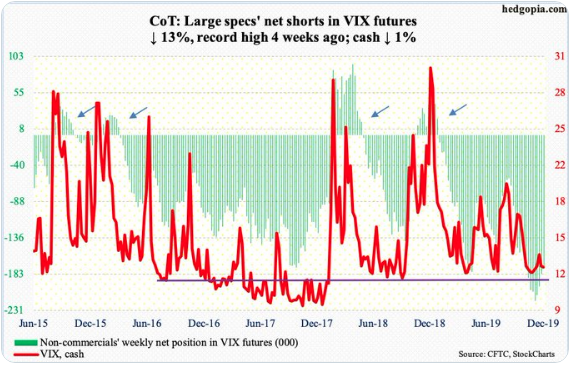
- The S&P 500 is up 1.7% for week, VIX (12.51) only down 0.12. Volatility bears were unable to squeeze much out of volatility this past week.
- Hedge Funds have seemingly decided to gradually reduce their massive net shorts in VIX futures.
- VIX futures down 4th week in a row from record holdings.
Morgan Stanley 2020 Outlook From Chetan Ahya

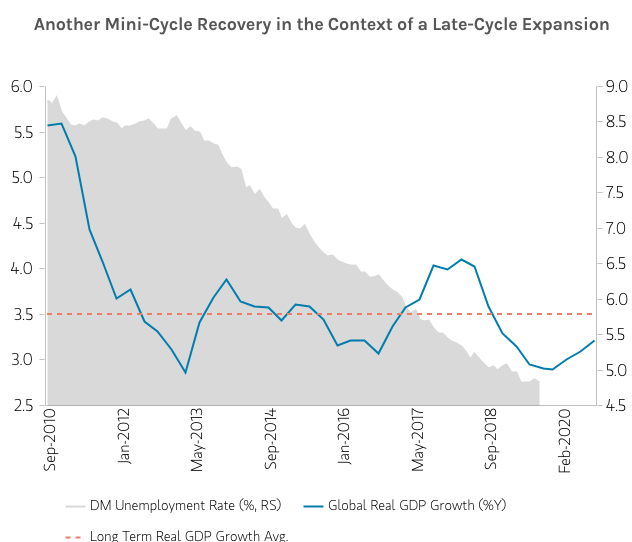
A year ago, the global economy seemed poised for smooth sailing. However, as 2019 progressed, trade tensions dropped an anchor on progress, dragging down corporate confidence and capital spending, and ultimately slowed progress by nearly 60 basis points.
Heading into 2020, however, the winds could shift, setting up the global economy for a third “mini-cycle recovery” in this decade-long expansion.
“While this global cycle has lasted more than a decade, constant interruptions have thus far averted an exuberant stage that would threaten overheating,” says Chetan Ahya, Morgan Stanley’s Chief Economist. Those disruptions included the European debt crisis in 2011, China’s slowdown in 2014 and, most recently, trade tensions. “Now, with trade tensions and monetary policy easing concurrently, we think the macroeconomy can continue to make forward progress.”
Looking to the Future
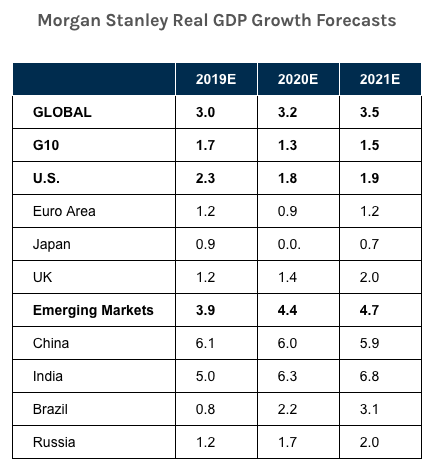
In Morgan Stanley’s 2020 Global Macro Outlook, Ahya and his colleagues forecast a recovery in global GDP growth from 2.9% in 4Q19 to 3.4% in 4Q20 (averaging 3.2% GDP growth in 2020). They also forecast 3.5% growth in 2021, up from an estimated 3% in 2019. This growth will come predominantly from emerging markets and, to a lesser degree, an improving outlook in Europe. The U.S. economy continues to sit on stable ground, but its pace of growth may slow down.
However, there is an asterisk with this outlook: “Should additional tariffs be enacted, we think global growth could decelerate further,” Ahya says. Moreover, with rates already low, central bankers around the world will be more limited than before to respond to any global shocks.
For this reason, Morgan Stanley strategists are prescribing more nimble and defensive positioning than in a typical recovery.
Synchronous Easing
For 2020, Ahya says that the synchronous easing of trade tensions and monetary policy will be a key theme. Though U.S.-China trade will remain a factor in 2020, the current sentiment is positive.
Meanwhile, 20 central banks have eased monetary policy over the past 12 months and Morgan Stanley economists expect more easing, with the global weighted average policy rate reaching a seven-year low by March 2020.
“Throughout 2018, tighter policy and escalating trade tensions both weighed on growth, and even though monetary policy began to ease from first quarter 2019, it was offset by rising trade tensions,” Ahya says. “Today, these two forces are reinforcing each other in supporting the global economy.”
Beyond this convergence, consumption improvements could also propel a mini-recovery. “Today the consumer in aggregate is in relatively good shape, with healthy household balance sheets, low unemployment in developed markets and moderate wage growth,” Ahya says. Among other positives, the corporate sector has responded to tariff threats by trimming hours rather than laying off employees, avoiding a “spillover effect” from tariffs thus far.
Stable But Slowing U.S. Growth
Although economists forecast an average year for the U.S. consumer, a strong job market coupled with low interest rates keeps the U.S. economy on solid footing. The pace of U.S. growth is slowing, but this comes after years of above-average expansion.
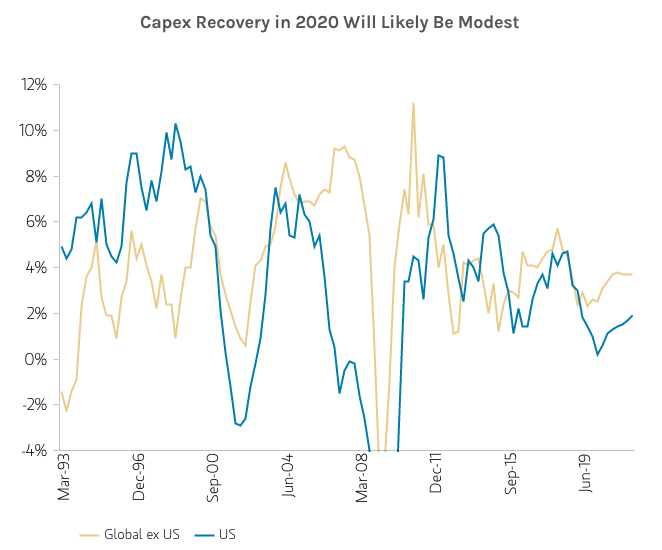
“Judging from the current unemployment gap, we’d characterize the U.S. as distinctly in the late-cycle phase of recovery,” says Chief U.S. Economist Ellen Zentner. On the positive side, stabilizing growth elsewhere in the world should lift exports and business investment, which are currently at very low levels. Putting this together, Morgan Stanley’s base-case outlook calls for U.S. GDP growth of 1.8% in 2020, versus an estimated 2.3% in 2019 on a 4Q/4Q basis.
Steady Progress for Emerging Markets
Less uncertainty around trade tensions is particularly key for emerging markets. In China, the combination of reduced tariff uncertainty and stable policy support could lead to improved corporate confidence and a steady expansion of the consumer class, adding up to a more optimistic outlook. “We expect growth to bottom in the fourth quarter of 2019 and recover modestly from there,” says Chief China Economist Robin Xing, whose team is forecasting GDP growth of 6% for China in 2020. This is also good news for Korea, which has been affected by U.S.-China trade tensions.
In India, past policy measures could create a virtuous cycle of growth. Economists expect GDP growth to reach 6.3% in 2020 and 6.8% in 2021, up from an estimated 5% this year.
There are other bright spots. Notably, the Brazilian economy is poised to accelerate in 2020 as historically low interest rates spur consumption and in turn investment activity. Morgan Stanley raised its GDP growth estimate for Brazil to 2.2% for the year ahead and 3.1% for 2021.
Bluer Sky in Europe
Growth in Europe continues to be sluggish, but economists see flickers of life as less uncertainty about trade, policy and Brexit unleash pent-up demand. Although real GDP growth in the Euro area is likely to dip below 1% in 2020, economists expect it to pick up again by 2021.
The U.K. may follow a similar trajectory, assuming an orderly resolution of Brexit. Uncertainty over the U.K.’s exit from the European Union has played no small role in dampening growth. With a resolution on the horizon, the economy could soon accelerate above trend. Economists are calling for a 1.4% bump in GDP growth for 2020 followed by 2% in 2021.


