
The following is an excerpt from our December 15, 2019 Research Report:
“With market breadth/internals still found with strength and now the most impactful binary event having been tranquilized, so to speak, a melt-up into year-end is the most probable outcome. To be clear, this is the most probable outcome, but it is by no means guaranteed. With that being said, we aim to discover what other market analysts and strategists have suggested since the latest announced phase-1 trade deal and with markets at all-time highs.”
So far so good, right? The S&P 500 rallied higher last week, setting several new all-time highs at it closed above 3,200 on the week.
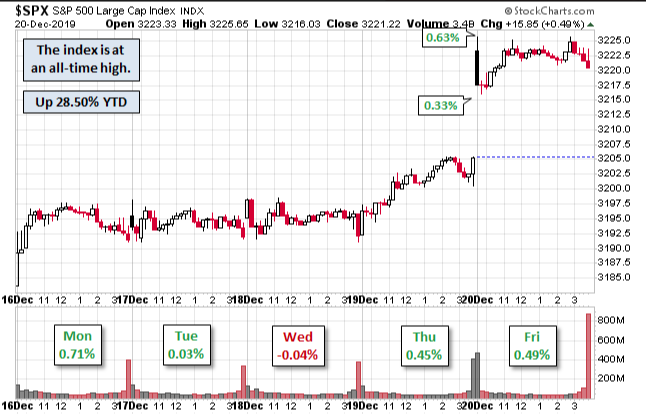
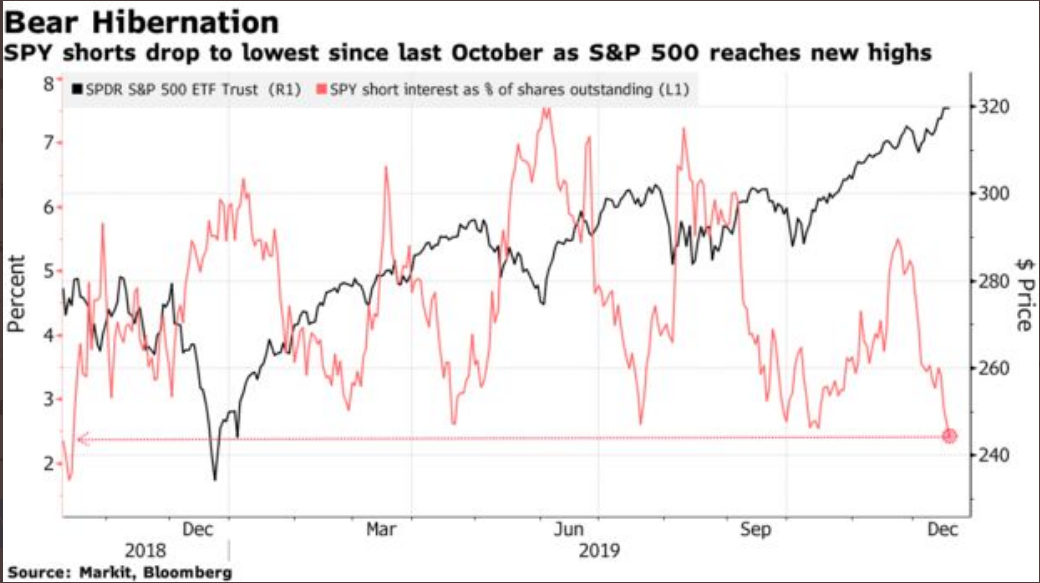
The S&P 500 gained another 1.65% last week and enters the final trading week of the year and decade on a high note. The S&P 500 is now up some 28% on the year. Investors are piling into equities in the 4th quarter of 2019, expecting an earnings rebound in 2020 to coincide with improved investor sentiment and geopolitical relations. The short interest on the Spiders ETF (SPY) is also at its lowest level since October of 2018. They may have seen the “writing on the wall”, so to speak.
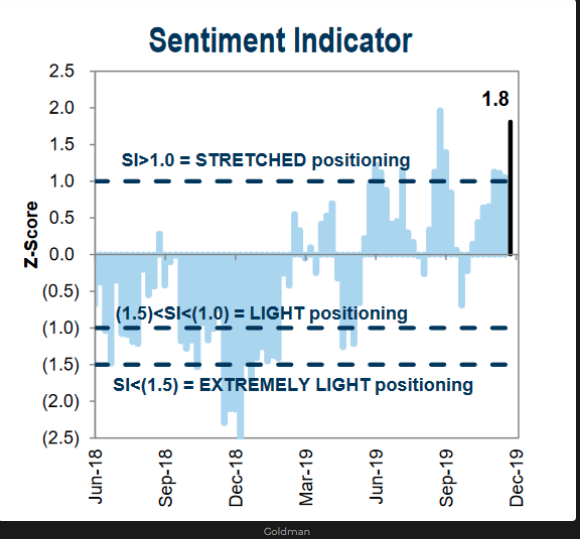
One could argue that positioning is extremely bullish as we complete the final trading week of the year and with much of the future market gains being pulled forward, from 2020 into 2019.
In fact, a recent study from Thrasher analytics offers some statistical insights in this regard and as the S&P 500 dances around a 30% return in 2019.
- Since 1950 the S&P 500 hasn’t seen a 30+% rise in a 1-year period very often.
- Historically the index struggled over the following year.
- Down 65% of the time 3-months later, 66% of the time 6-months later and 77% of the time 12-months later when 1-year ROC crossed 30% (n=112)
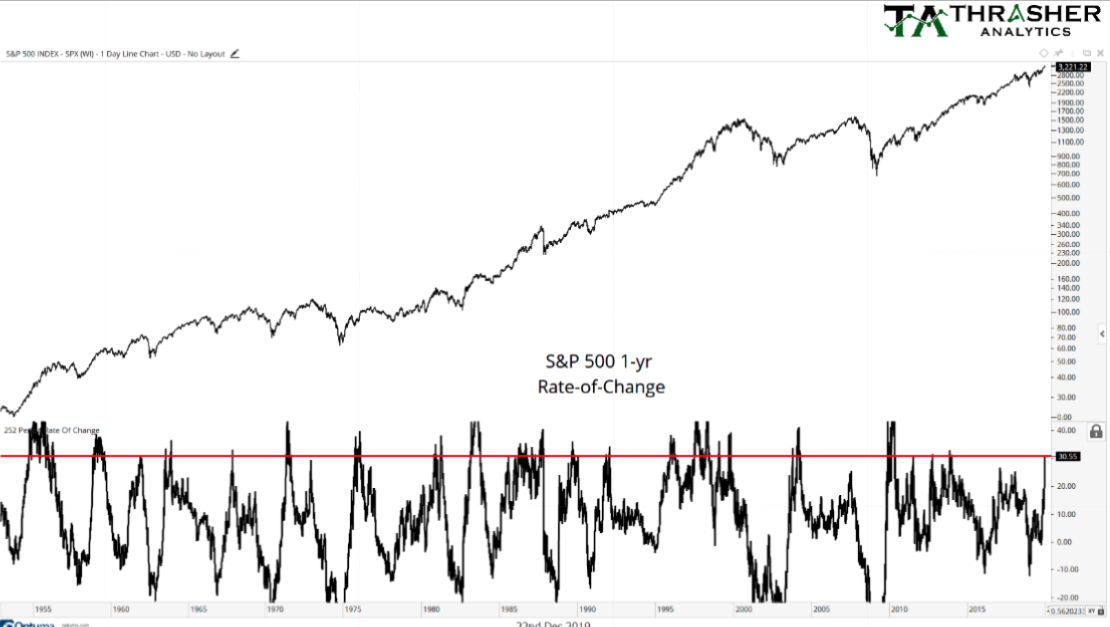
Given the statistical offerings from Thrasher Analytics, this begs of the average investor a little more due diligence. If the market struggled over the time frames offered and out a full year, we may not find a positive return in 2020. As such, the forward-looking 12-month EPS estimates will need to offer a better understanding of what to expect. Lately, we’ve been hearing a lot of nonsensical commentary suggesting “earnings don’t matter”. This is being said mainly because in 2018, earnings grew some 20% and yet the market was down over 4% for the year. In 2019, S&P 500 EPS is expected to be flat to down 1.5 percent and yet the S&P 500 might finish the year with a 30% return. We get it; that does seem confusing and it should lend itself to further study. But check out the bullet points noted below:
- When we look at the 2-year earnings growth rate of the S&P 500 we come to find that the 2-year price-to-earnings multiple is just 15.7.
- According to FactSet Data, this is actually lower than the 5-year average PE ratio of 16.6 and only .8% above the 10-year average PE of 14.9.
- So if you think earnings don’t matter, the 2-year PE average tells a very different story and suggests at the very least the PE multiple has expanded over the last 5 years, but with the last 2-year period’s average PE still below the 5-year average PE.
- Some might say this sets up the argument that the market is still cheap.
And to further the point about the market possibly being less expensive than one might think from a simplistic forward-looking PE multiple, that same PE multiple still resides below the 50-month PE multiple as shown in the chart below:
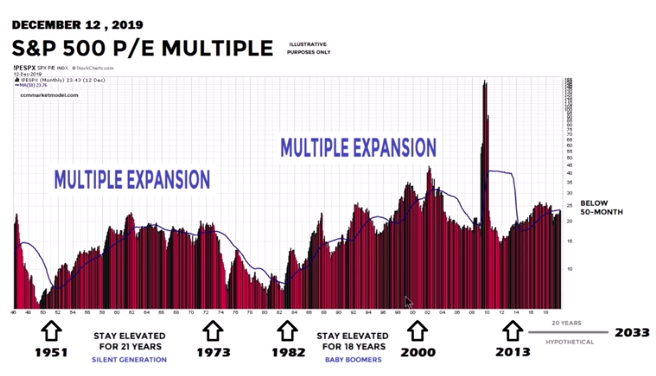
Sometimes the facts are far less convenient to the permabears than they would have liked, but the chart from Chris Ciavacco doesn’t lie folks.
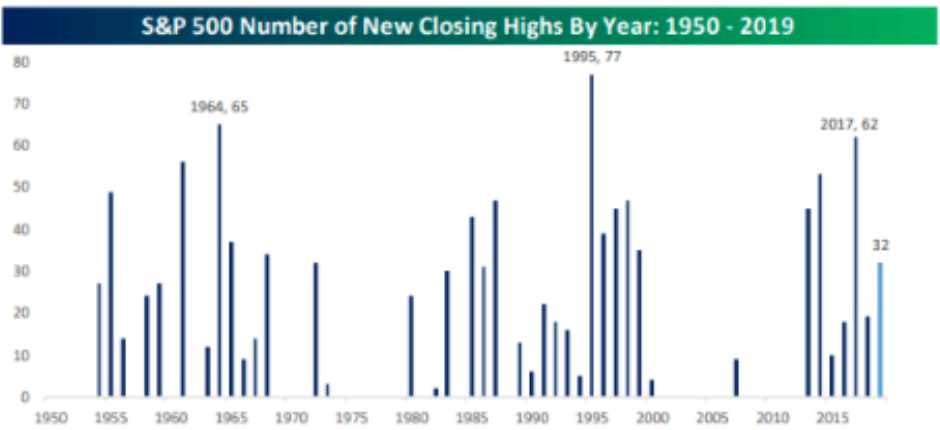
The finish to the trading week, last week, saw the sixth record close in the last seven trading days for the S&P 500. In total, that makes 32 record closes for the calendar year. That is less impressive compared with 62 record closes in 2017, the second-highest in history behind 77 in 1995. Additionally, since the S&P 500 broke out of a 20-month consolidation zone/period in late October, we’ve witnessed record closes at a pace of once every other day. Rather remarkable and indicative of strong market breadth and improved fund flows from the previous 3 quarters of the year.
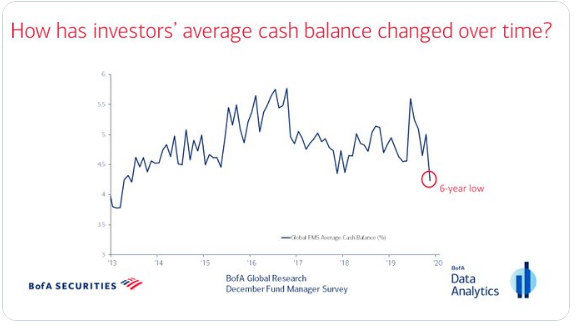
In speaking of flows into equities, as the market melts higher into year-end, the latest Bank of America Merrill Lynch Fund Manager Survey (FMS) identifies cash balances as a percentage of total portfolio/fund holdings. According to this month’s FMS, investors’ average cash balance holds steady at 4.2%, the lowest level since March 2013. It’s clear that after rather lofty cash balance levels in the previous quarters of 2019, as the geopolitical climate has shifted and rates moderated lower, risk-on became the name of the game.
In terms of fund flows, up until this most recent week, equity ETFs benefitted from 8 straight weeks of inflows. Unfortunately, that streak came to an end this past week according to Lipper Weekly FundFlows Insights. ETFs had overall net outflows of $1.9 billion for the fund-flows trading week, which were driven by equity ETFs (-$3.0 billion). The largest individual net negative flows among equity ETFs belonged to iShares Core S&P 500 ETF (IVV) and the SPDR Select Financial ETF (XLF), which saw $2.8 billion and $590 million leave. Taxable bond ETFs (+$983 million) and municipal bond ETFs (+$136 million) both took in net new money on the week. The most significant positive net flows for each of those two groups were attributable to SPDR Bloomberg Barclays High Yield Bond ETF (JNK) and the iShares Short Term National Muni Bond ETF (SUB) at $527 million and $37 million, respectively.
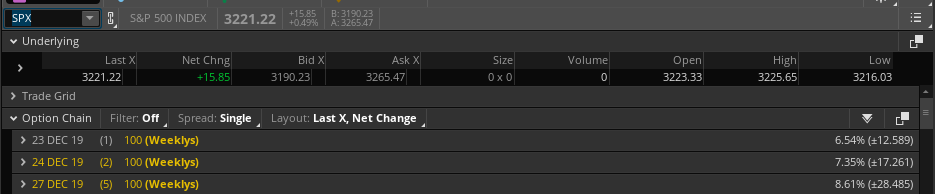
For the holiday shortened trading week, the weekly expected move for the S&P 500 has come in quite a bit, even as volatility (VIX) didn’t move much at all last week. The weekly expected move dropped from $46/points last week to just $28/points this week.
The U.S. economy has remained a beacon of global economic strength throughout 2019, even as fears of a recession were being hyperbolized when the yield curve inverted in the 2nd quarter of 2019. Recession models were thrown about like permabear candy.
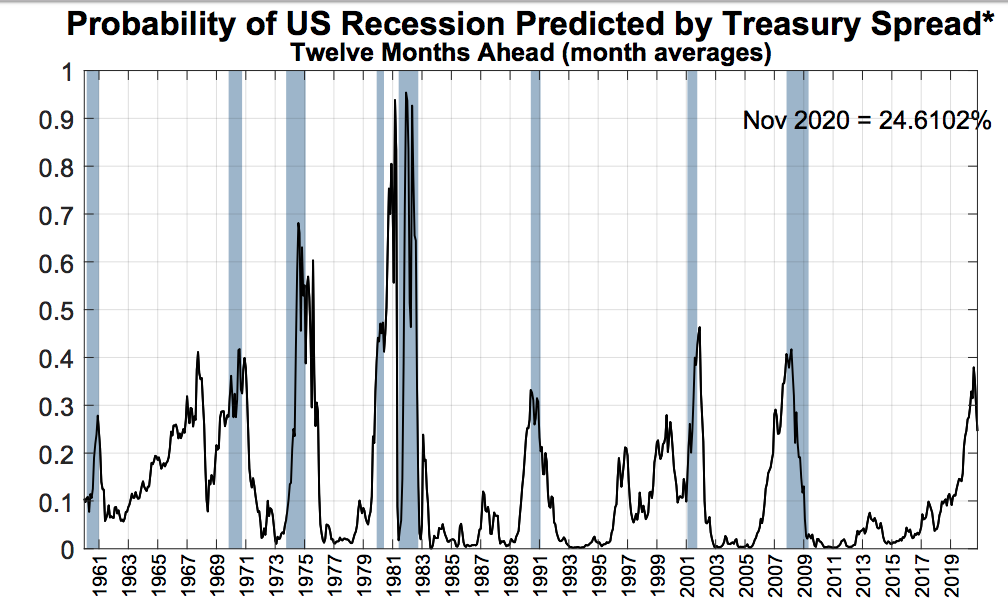
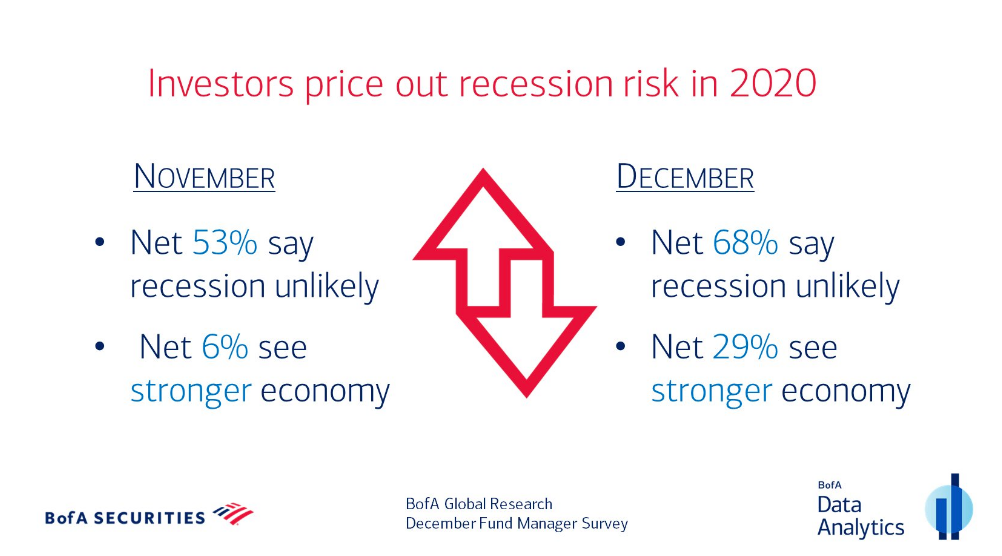
The New York Fed’s recession model, which serves to measure the probability of a recession 12 months ahead ticked higher than 37% earlier in 2019. Historically, almost every time the model reached above 35% a recession occurred over the next 12 months, except in 1968. But Since this recession model touched 37%+ in 2019, it has retreated and now resides at 24.6 percent. The reduced threat of a recession has apparently also bolstered investors’ confidence in the economy going into 2020 as identified in the latest BofAML FMS. According to the FMS, recession concerns diminished in December, as net 68% of investors say a global economic recession is unlikely in 2020.
As of December 2019, the U.S. economy has expanded for a record 126 straight months, the longest time period in the country’s history according to the National Bureau of Economic Research. Put another way, the U.S. has avoided a recession for an entire calendar decade for the first time ever.
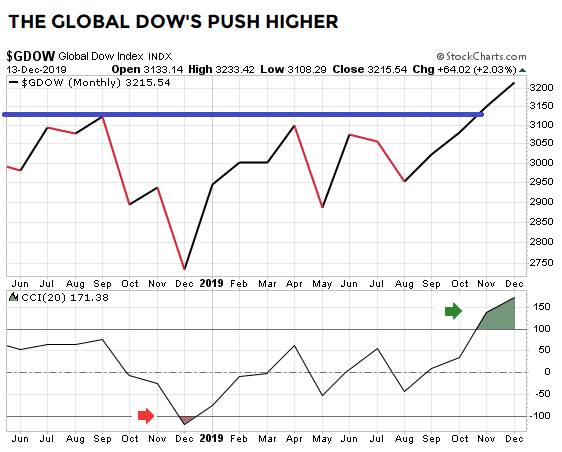
As investors lower their cash balances and perceive the economic outlook to be improving into 2020, we can look to the Global Dow Index as a reasonable expression of longer-term market positioning. According to Chris Ciovacco, at the end of November the monthly CCI on the Global Dow Index completed a momentum round trip by closing above 100 after closing below -100 in late 2018.
“The turn that just took place over the last year is typically associated with a significant shift from pessimism to optimism as it relates to investor perceptions of future economic and market outcomes.“
So what does the Global Dow Index and CCI Momentum turn higher tell us about the S&P 500 going forward? Based on institutional positioning, we know that these groups of investors are found increasing equity market exposure. So what does the historic data have to show given like Global Dow Index signals from the past.
Given the Global Dow Index and CCI momentum signal noted in the chart above, the table below shows very favorable historical outcomes for the S&P 500 looking out 1-4 years.
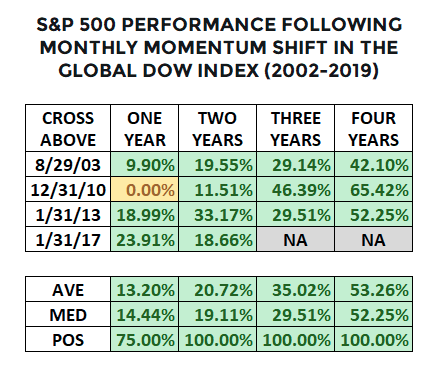
Of course, history does not always repeat itself, but as investors it behooves us to understand the probabilities given the denoted signals and market positioning by institutional investors based on historical data.
While the market appears to have strong breadth, as recognized by the percentage of stocks trading above their 200-DMA, at least, the analyst community always proves a mixed bag of sentiment and guidance. The latest notes from some strategists prove more cautionary, given the run-up in equities through Q4 2019. With the average 2020 S&P 500 price target at roughly 3,300 and the S&P 500 currently residing at just over 3,200, that doesn’t leave much upside when the calendar year turns anew after this week. For this reason, Jeremy Hale, Citigroup’s head of asset allocation offered a warning to investors late last week.
“Signs of growing global economic stabilization in the short term, alongside positive developments on the trade war, may have caught some big money managers off guard.
In short, those who weren’t overly exposed to stocks and missed out on the S&P’s 27%-plus gain this year may be forced to play catch up and pile into equities in early 2020.
As such, equities have the potential to overshoot expectations inferred by fundamentals for the initial quarters of the year as the economy stabilizes. We will continue to track flows, positioning and signs of over-exuberance closely in the coming months.
When the economy begins to lose steam in the second half of this year, as they expect, “volatility will once again pick up and risk assets will be depending on further juicing from lower discount rates.”
While Citigroup’s Hale suggests the current market melt-up could present a problem sooner than later, Finom Group believes there’s a more profound point to be made about “overshooting”. The market’s strength and seemingly endless surge has come in a very low liquidity environment whereby volume is light and S&P 500 futures turnover is near it’s all-time lows. In such an environment, a countertrend move is very difficult for the market to accomplish. And keep in mind that this low liquidity regime has been accompanied by a new multi-year high in gamma exposure (GEX) at $9.9bn as of last week Friday.
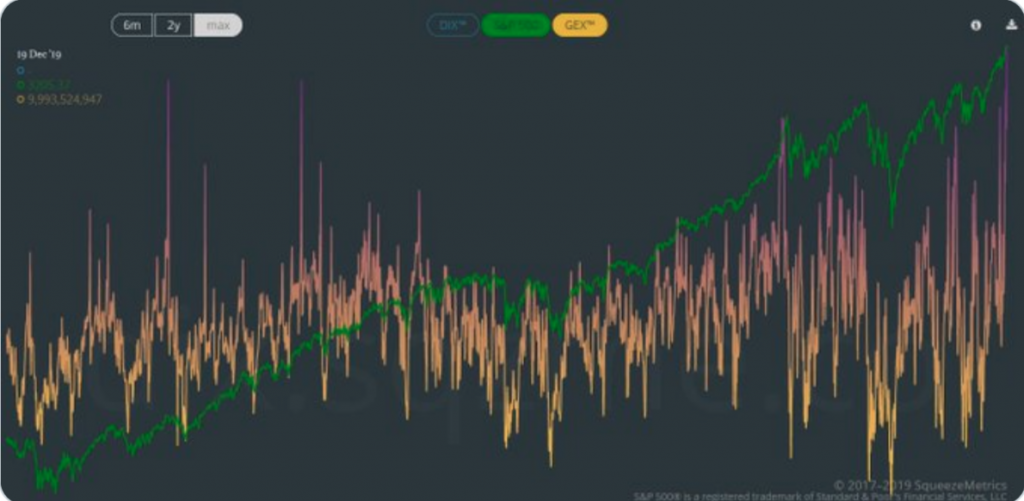
Gamma exposure is at its highest level since 2013. My how the tide has turned in the final quarter of the year and decade. But in speaking of those analysts and strategists sentimental views on the market going forward, let’s turn our eyes to the latest comments on the market to Merrill Lynch. The head of Merrill Lynch Wealth Management, Andy Sieg, says that the U.S. stock market has plenty of room to run higher.
“If we take a step back, we think this is a generational bull market. We think this is a 30-year cycle and we need to remember that because this has been it’s been a fantastic 10 years.”
He cautioned that the big mistake that investors tend to make in periods like this one is waiting too long to jump in.
“But the mistake we see investors make is that they are waiting to participate in the rally.
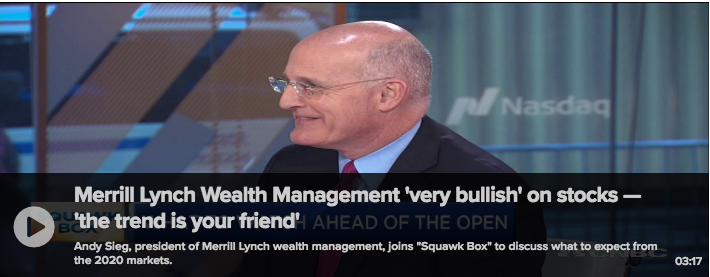
Asked if he was conveying his investment firm’s bullish outlook for stocks to clients with sufficient gusto, Sieg said, he was “pounding the table.”
“Yeah, we are pounding the table. And we’re also trying to point to the fact that things like a 60-40 allocation [of stocks and bonds] which has been something you know clients and advisers have been talking about for a long, it may be dead.”
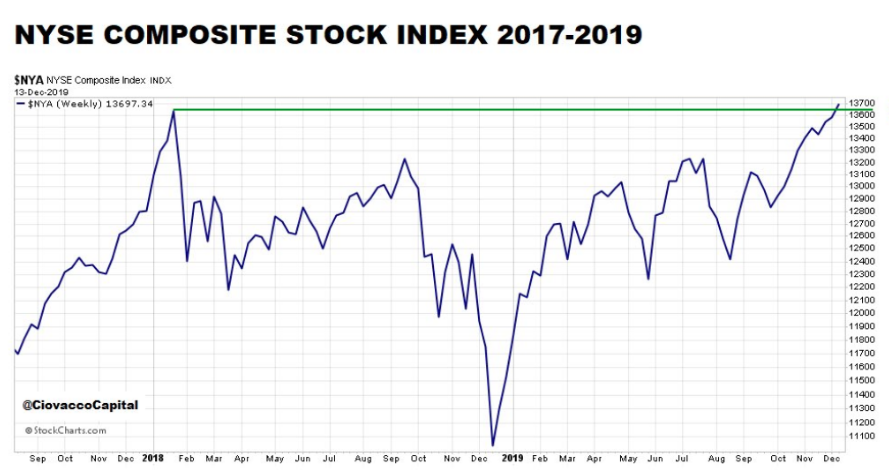
As we march forward into a new decade, it may prove important to reflect on the last 2-year period whereby the S&P 500 plunged into a technical bear market and since surged to new record highs. Sentiment was at or near record low levels heading into Christmas Eve 2018 and has finally found it’s highest AAII survey reading on bullish sentiment for 2019 as of last week, at 44 percent bullishness. We witnessed the NYSE Composite Index also plunge late last year and recently break out in the 4th quarter of this year.
It’s with all of this consolidation over the last 2 years, all of this plunging of depths to reach the S&P 500 200-week moving average in 2018 only to surge thereafter and over the last 12 months that we often miss the forest for the trees. The S&P 500 quite literally performs one achievement over time. Despite intermittent drawdowns, corrections and bear markets; the S&P 500 only goes higher over time.
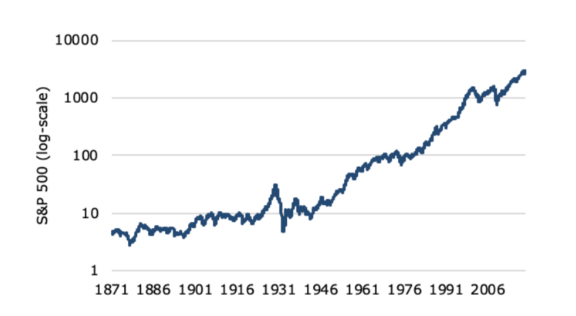
It’s those few and far between blips on the S&P 500 chart above that prove the extraordinary opportunity that investors should take advantage. Unfortunately, that which brings about those blips is found with tremendous levels of fear for which most investors never return to the equity markets. This despite the preponderance of evidence, as to what will eventually come in the way of forward-looking returns.
Unfortunately, the media can prove a headwind for investors and as it hyperbolizes the fearful moments that accompany market pullbacks and corrective periods. The likes of CNBC and Bloomberg recognize that fear drives viewership, even if it comes at the expense of the average investor who listens to such commentary for factual disseminations and insights. With this in mind, Finom Group encourages if not urges investors to recognize that most, yes most, CNBC or Bloomberg guest analysts are no better at predicting markets than one needs them to be. “Needs them to be?”
As mentioned above, the market goes higher over time. Given this point of fact, the bullish narratives thrown about on CNBC or Bloomberg by analysts bear nothing more than statistical bias disseminations. The bearish narratives often require the ignoring of such statistics in favor of a dislike for the Fed, economy and/or debt levels. More often than not, these permabear market disseminations and outlooks are found with great error. One of the worst market calls for the year came ahead of the 2019 New Year from Morgan Creek Capital’s fund manager Mark Yusko.
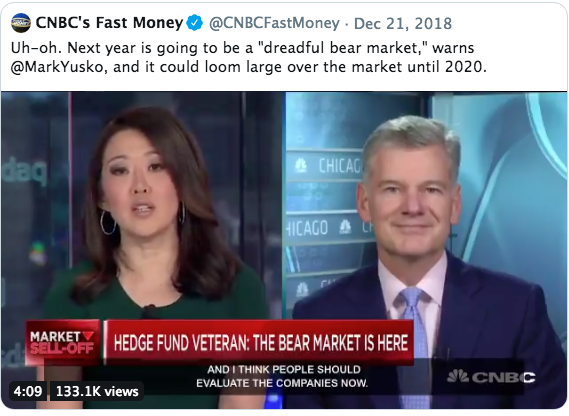
Yusko was calling for the technical bear market of 2018 to last through 2019 and into 2020. Of course this never came to pass, but the average investor tuning into the guest appearance isn’t aware of Yusko’s extremely poor track record when it comes to managing the Morgan Creek Capital fund or his calls on the market.
For the fi scal year ended March 31, 2016, the Fund generated
a negative net return of (14.2%)compared to (3.5%) for
the MSCI World Indexand (7.2%)for the HFRX Equity
Hedge Index.
For the fi scal year ended March 31, 2017, the Fund gained
+3.7% compared to +14.8% for the MSCI World Index and
+5.9% for the HFRX Equity Hedge Index.
Nonetheless, investors who tuned into this interview on December 21, 2018 and during the peak in market panic that would last through Christmas Eve, they likely sold their stocks in favor of cash. Most of these investors will never return to the market after watching Yusko’s performance on-air and they’ll likely never realize his narratives are almost always calling for a continued market downturn.
Investors should always be focused on two things when it comes to the stock market, earnings and consumption data. In a consumer-based economy, consumer spending will drive earnings. While we can’t control that which takes place abroad, generally, as the United States goes the global economy follows. This is not to suggest that there can and haven’t been divergences between the U.S. and the global economy in the past or the future, but like market drawdowns these divergences are likely to prove temporary. With that being said…
Last weeks release of the Personal Income and Consumer Expenditures data (PCE) proved once again that consumers are in very good shape. The popular contrary opinion, however, goes something like this: “How can consumers continue to spend with debt levels at all-time highs.” Unfortunately, what this narrative/suggestion doesn’t tell us and doesn’t answer is the debt to income ratio levels and more importantly the household obligations as a percentage of disposable income levels.
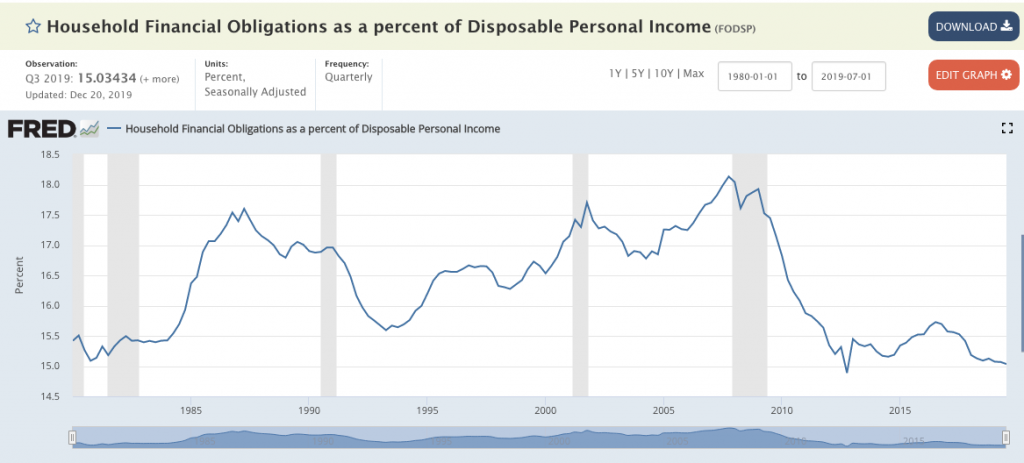
Finom Group has said before, this is probably the most important measure of health or weakness in the economy, as it assumes the ability of the average consumer to spend remains strong. In fact, it denotes that the average household/consumer balance sheet is at its best levels since the 1960s. And this coincides with the lowest level of unemployment in history, presently.
As we review last week’s PCE data we come to find the following:
- Consumer spending rose 0.4% last month, the government said Friday. That’s the biggest increase since July.
- The cost of goods and services also increased slightly in November, but inflation more broadly was still quite low.
- Incomes climbed a solid 0.5% last month, rebounding from a flat reading in October that economists viewed as an anomaly.
- Consumers were also able to pocket some more savings. The savings rate edged up to 7.9% from 7.8%.
- The so-called PCE price index rose 0.2% last month to push the yearly rate of inflation up a tick to 1.5%. That’s still well below the Federal Reserve’s 2% inflation target, however.
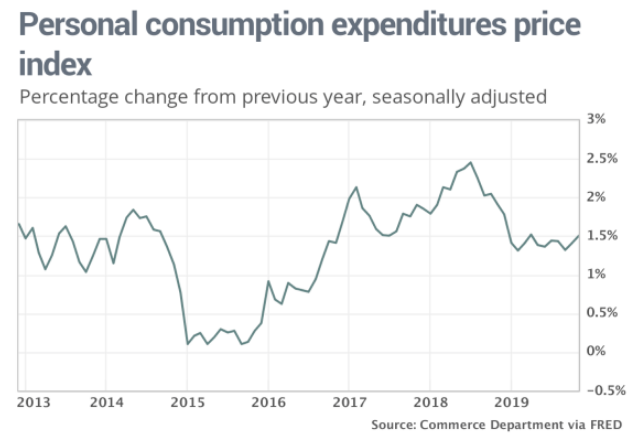
“Despite the late start to the holiday season, U.S. consumers were in a festive mood, suggesting the backbone of the economy remains rock solid,” said senior economist Sal Guatieri of BMO Capital Markets.
The economic calendar is light for this week as it is also a holiday shortened trading week as the market will close at 1:00 p.m. EST on Christmas Eve and be closed for Christmas Day.
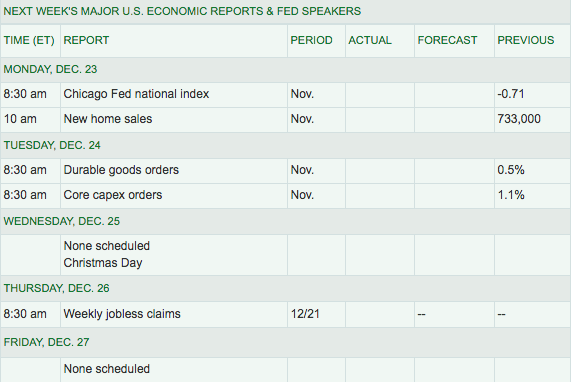
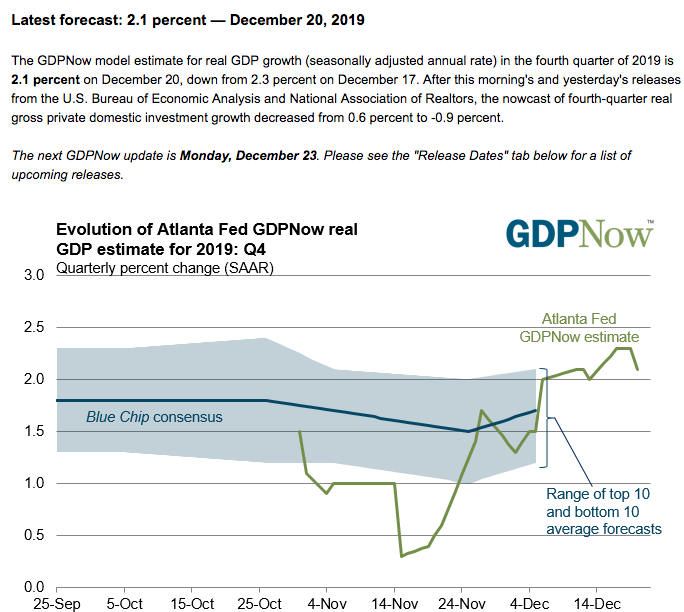
With much of the monthly economic data releases in the rear view mirror, Q4 GDP is looking as if it may surprise to the upside. Recall that GDP grew only 1.1% in Q4 of 2018. Coming into Q4 2019, the Atlanta Fed GDPNow forecast model was looking for GDP growth of just .3 percent. At present, that forecast model shows that GDP is forecasted to grow above 2% in the Q4 2019 period. Revisions to the model are slated for this coming week on Monday and with the release of the latest monthly New Home sales data.
Most economists see the record setting economic expansion cycle continuing through 2020, even as the presidential election cycle takes shape. A panel of 57 economists who participated in The Wall Street Journal’s December economic survey offered a relatively optimistic outlook for 2020 growth, albeit at a slower pace than in 2019.
On average, they expect U.S. economic growth to slow slightly in 2020, to a year-over-year rate of 1.8% in the fourth quarter from an estimated 2.2% in 2019. They also see lower odds of a recession over the next year than they did in the prior two months.
Forecasters expect the labor market to remain strong with employers continuing to add jobs. They expect monthly job growth of around 157,000 in the first half of the year, and about 104,000 a month in the second half of 2020. The survey found that economists expect the unemployment rate to rise slightly from 3.5% in December 2019 to 3.7% in December 2020.
Economists said their disappointments for the 2019 economy were mostly related to business investment and uncertainty surrounding trade policy.
“Business investment collapsed in 2019 as the combination of weaker global growth, persistent trade tensions, lingering policy uncertainty and subdued corporate profitability restrained activity,” said Gregory Daco, an economist at Oxford Economics.
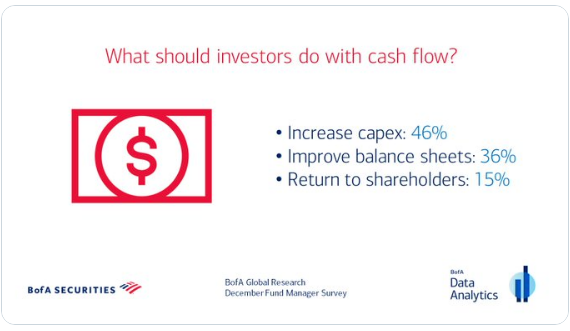
The latest BofAML FMS survey also indicated disappointment in CAPEX spending in 2019 and respondents desired to see a boost from CAPEX in 2020.
Lastly, when it came to recessionary probabilities and according to the Wall Street Journal survey, economists this month saw an average probability of 25.9% of a recession in the next 12 months, down from 30.2% in November and 34.2% in October. Just over a third of economists expect the next recession will come in 2021. One-fifth expect it in 2020, and 22.9% expect it to come in 2022.
A recession will happen folks; just like bear markets will happen and even general market corrections. As we head into the final trading week of the year, keep that in mind. As the market melts-up, begin the process of portfolio assessment and modeling for 2020. Set your expectations to align with the eventuality of a market corrective period so as to diminish the fear and/or loathing that accompanies these market downturns. The better prepared you are now for when the corrective period arrives, the better you’ll perform thereafter. As long as the consumer is spending and investors are eyeing a rebound in earnings growth in 2020, the market will battle back and through such corrective periods.
From flat to slightly negative earnings growth in 2019, the forward pricing mechanism that is the S&P 500 may very well have pulled forward some of the expected 9.5% earnings growth of 2020. Having said that, the average quarterly beat rate is roughly 4.5%, so let us not discount this important detail when suggesting all of the earnings growth has already been factored into the market. As such, WHEN a pullback finally arrives, be smarter than you are found fearful and find your portfolio likely to outperform by year-end 2020. Outperformance comes from studying the details and ignoring the hyperbole.


