Welcome to this week’s State of the Markets with Wayne Nelson and Seth Golden. Please click the following link to review the SOTM video. This week we discuss the upcoming risks to the coming trading week, which will complete ahead of the December 15th tariff deadline/announcement. Employment data surprised strongly and with upward revisions to previous months, setting off a market rally. Demographic shifts in retail, technology and the endless decline in birth rates don’t support the baby boom-market surge narrative over the next 15 years. Also, regional Federal Reserve bank GDP forecasts take center stage, as we explore their make-up. Please review the supporting graphics and bullet points that accompany our State of the Markets video!
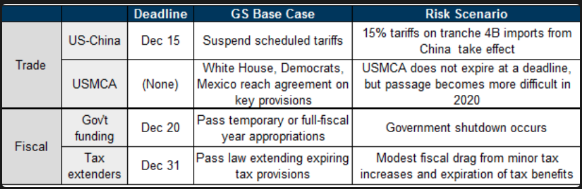
- GS: base case is they push the deadline into Jan and any dip on that headline will be short lived and bought
- big upside if they actually agree
- as long as there is no further escalation/they are still talking, markets will push to all-time highs
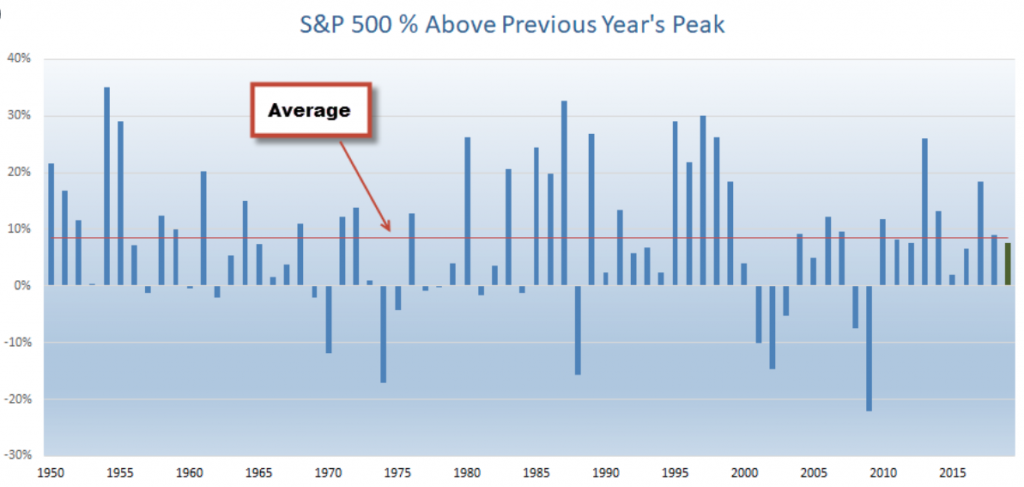
- The S&P 500 is only 7.6% above the peak from 2018. This isn’t even above the average year of 8.5%.
- The median age of U.S. home buyers is now 47, according to the data compiled by Deutsche Bank. In 1981, the median age of American home buyers was 31.
- Notably, the median age has increased by eight years since the financial crisis. Much of this rise can be attributed to the disappearance of young, first-time home buyers from the housing market.

- TransUnion has predicted that at least 8.3 million first-time home buyers will enter the mortgage market between 2020 and 2022, thanks in part to low unemployment, low mortgage rates and rising wages.
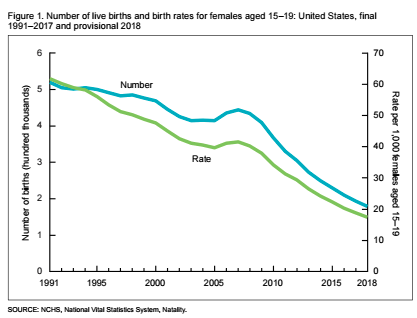
- U.S. Births Fell To A 32-Year Low In 2018; CDC Says Birthrate Is In Record Slump.
- The U.S. birthrate fell again in 2018, to 3,788,235 births — representing a 2% drop from 2017. It’s the lowest number of births in 32 years, according to a new federal report. The numbers also sank the U.S. fertility rate to a record low.
- Not since 1986 has the U.S. seen so few babies born. And it’s an ongoing slump: 2018 was the fourth consecutive year of birth declines, according to the provisional birthrate report from the Centers for Disease Control and Prevention.
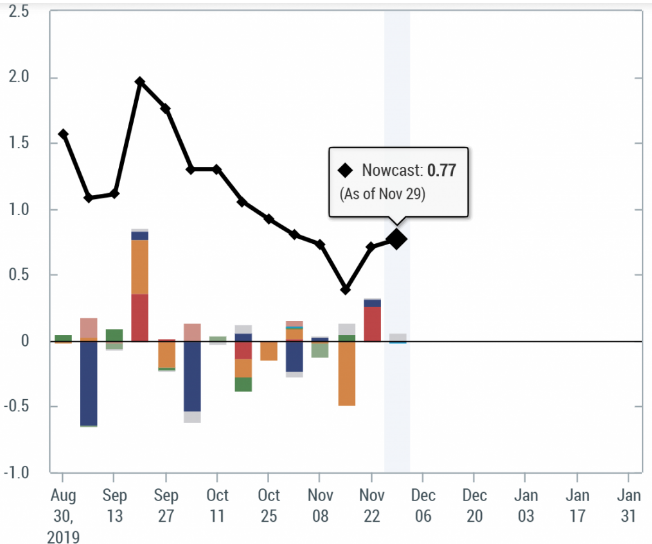
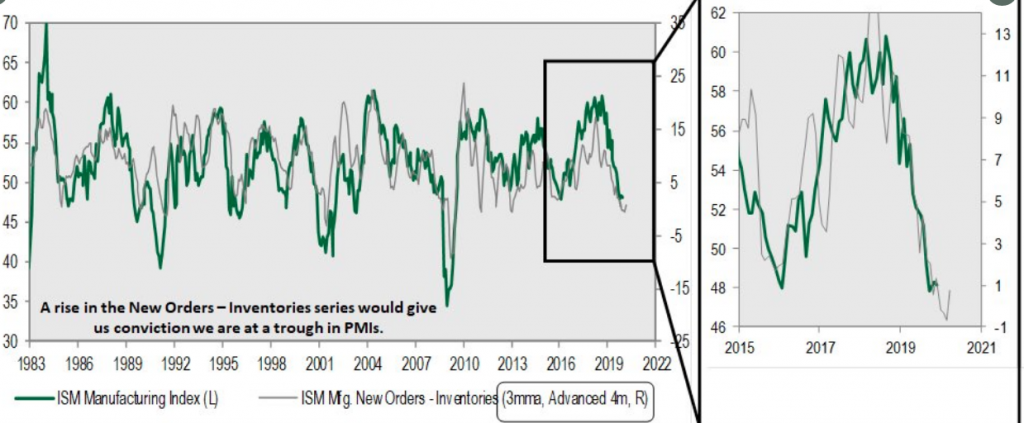
- U.S. economic growth is currently a tug of war between a still strong U.S. consumer and sluggish manufacturing/business confidence.
- The models for the Atlanta and New York Fed are 100% automated around economic data inputs or capital market signals and leave nothing to human judgment.
- The difference between the 2 models comes down to how much of an effect the ongoing manufacturing slowdown will have on Q4 GDP. Atlanta says “not much, but noticeable”. New York says “a lot”.
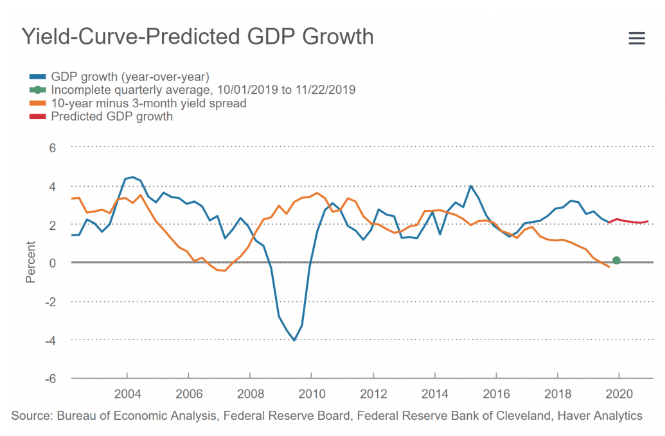
- Here is the Cleveland Fed’s model that, unlike the multi-factor economic data models at New York and Atlanta, just uses the difference between 3-month and 10-year Treasury yields.
- Looking back to 2002, the model does show that yield curve spreads broadly predict GDP growth. And the relationship is especially tight from 2010 – 2016.
- Since 2017, however, the two datasets have decoupled. Credit the 2017 change in tax rates that boosted US growth in 2018 along with negative long rates abroad and still-low yields at home for that dichotomy.
- Bottom line: the Cleveland Fed’s model seems to assume this trend will continue into 2020. That’s odd, considering that the NY Fed’s Recession Probabilities model uses the same data and currently gives the odds of a downturn in the next 12 months of 29%.
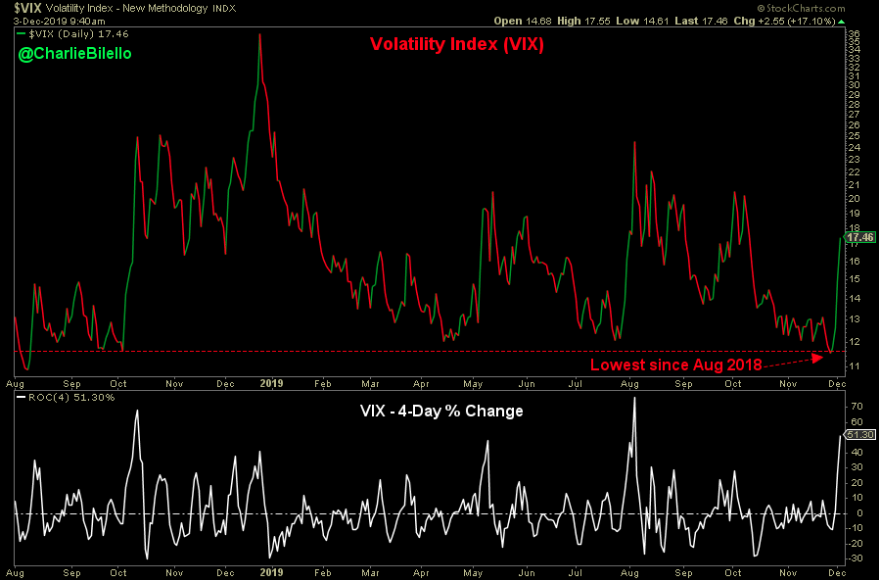
- Lowest close since August 9, 2018. 11.54.
- Volatility Index was up 51% over the past 4 trading days, largest spike since July/Aug.
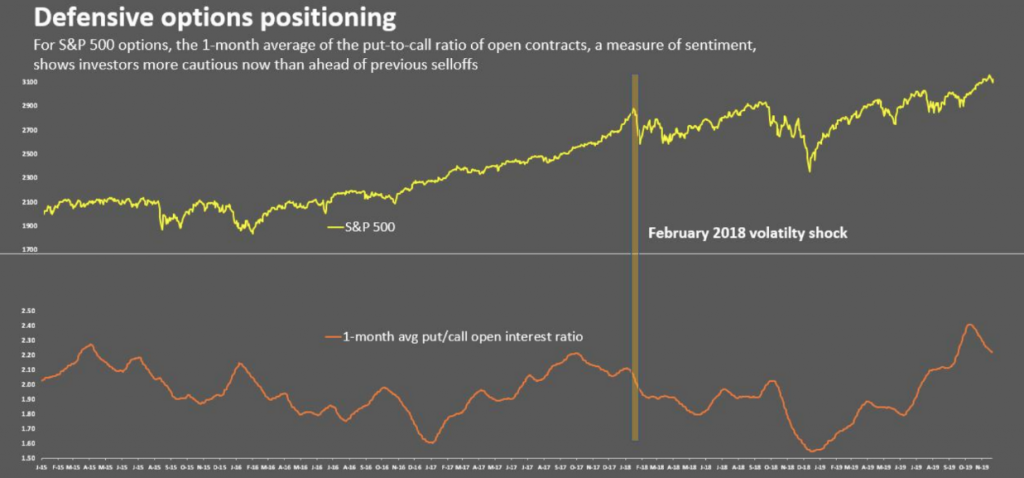
- “The market isn’t complacent,” said Stacey Gilbert, portfolio manager for derivatives at Glenmede Investment Management in Philadelphia. “We have seen shifts over this past month where investors have become more defensive.”
- The one-month moving average for the put-to-call ratio of open contracts on the S&P 500 is at 2.2, well above its level ahead of previous sell-offs, data from options analytics firm Trade Alert show. A higher ratio reflects greater demand for puts, which are often used to hedge against a decline in shares.
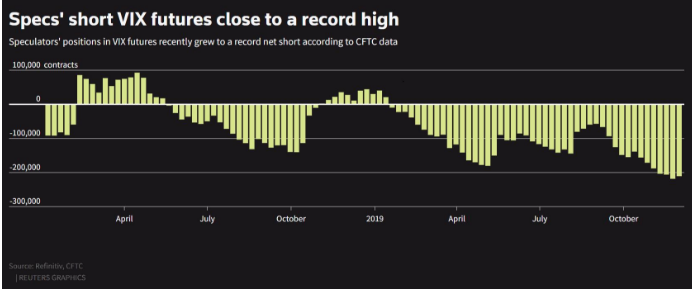
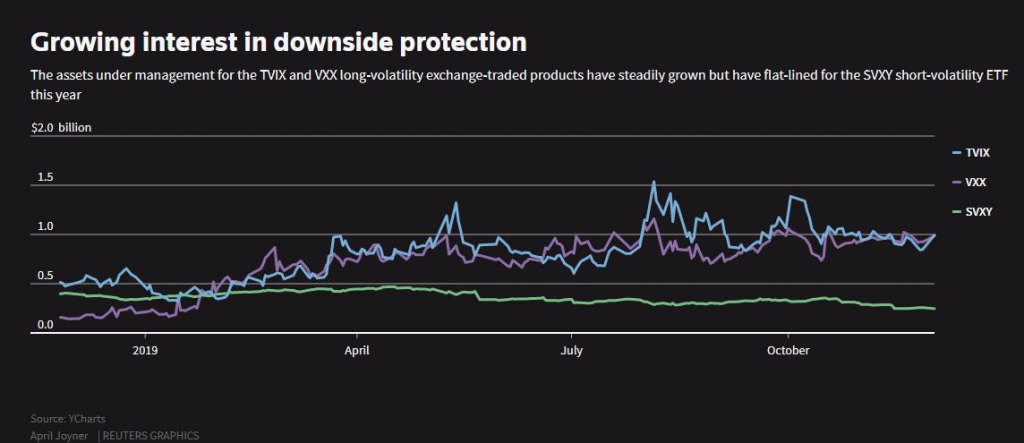
- As assets in long-volatility funds grow, their issuers must load up on VIX futures, which are being supplied by speculators seeking to generate income in a yield-starved environment, said Maneesh Deshpande, head of U.S. equity strategy and global equity derivatives strategy at Barclays in New York.
- Assets under management for one of the largest long-volatility VIX-linked exchange-traded products, the VelocityShares Daily 2x VIX Short-Term ETN, hit a record high of $1.42 billion in early August and have remained close to those levels. As of Tuesday, the ETN had assets of $1.09 billion, according to YCharts.
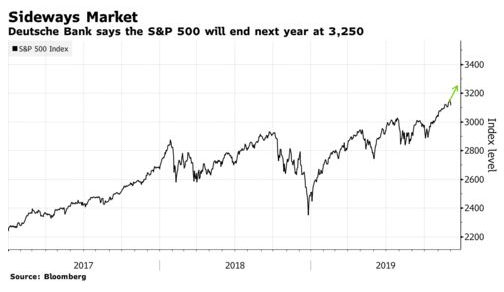
- Stocks will go nowhere in 2020, according to Binky Chadha, chief global strategist for Deutsche Bank Securities.
- “Valuations are high, higher than they’ve been 90% of the time over the past five years. The S&P 500 is trading at 19.1 times trailing earnings.
- One headwind will be what he expects to be a declining payout ratio, or the share of earnings that U.S. corporations return to shareholders in the form of share buybacks and dividends. He said that companies are returning about 90% of their earnings to shareholders today, but expects that number to fall down to 80% next year as the corporate sector reacts to slowing U.S. economic growth.
- Uncertainty about President Trump’s international trade policy has already taken a toll on the economy and will do so in the months to come, Chadha said. “The economic slowdown is clear, unambiguous and broad based,” Chadha said, pointing to declining growth figures, a downtrend in survey data for both the manufacturing and services sectors, as well as slowing job growth.
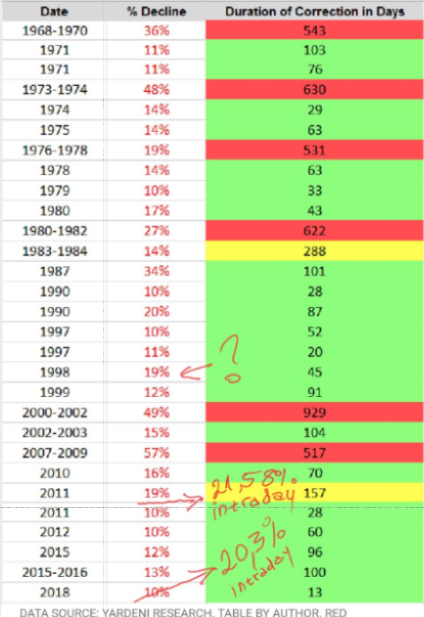
- We’re in the midst of the longest bull run for stocks without a major drop on record. Via Goldman:
- Chart does not account for intraday drop, but rather closing prices.
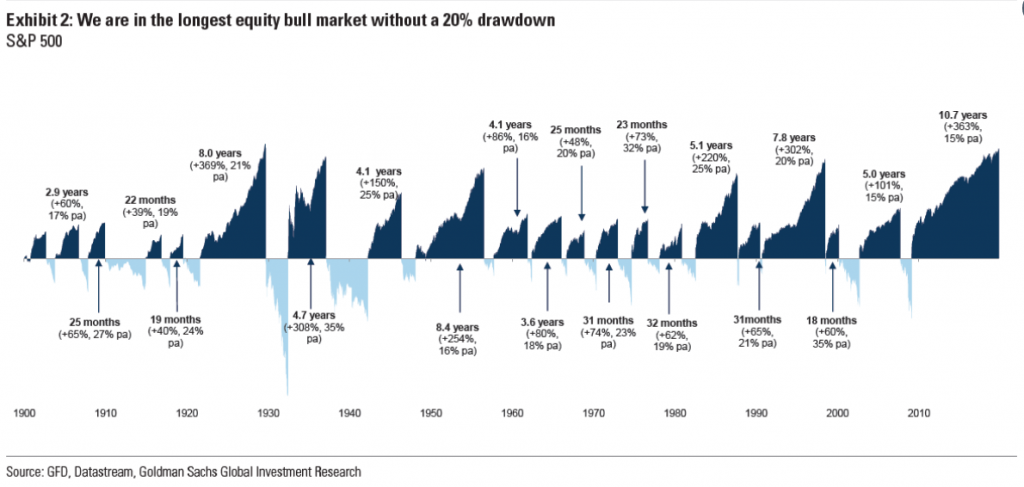
- For Goldman 19% drop is more than 20% in 1998, but 19% drops in 2011 and 2018 are less than 20%. Great research by Goldman analysts specialized in creative maths and sensationalism.
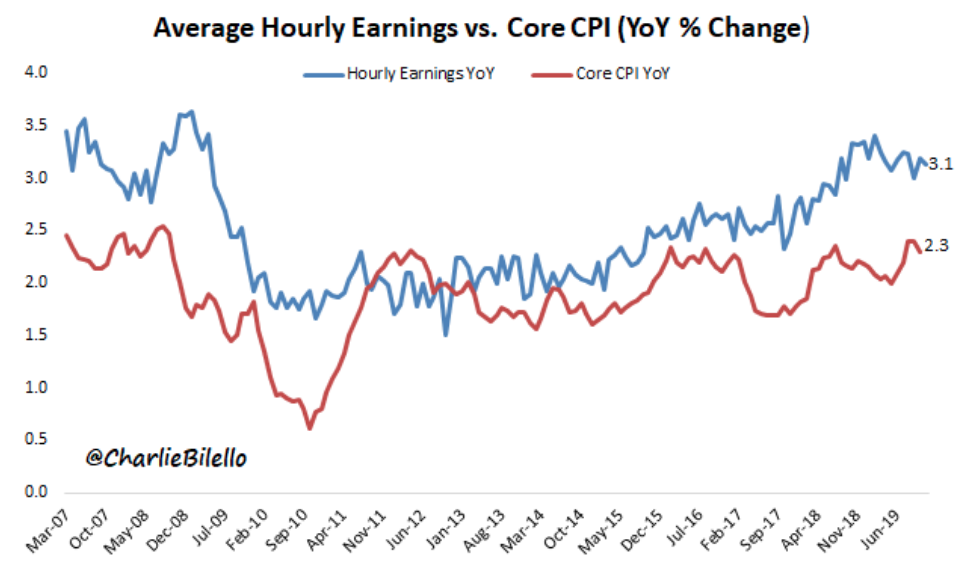
- US Hourly Earnings up 3.1% in the past year, outpacing core inflation (YoY) for the 84th consecutive month.
- U.S. Unemployment Rate moves down to 3.5%, its lowest level since December 1969.
- 110 consecutive months (9+ years) of jobs growth, by far the longest streak in history.
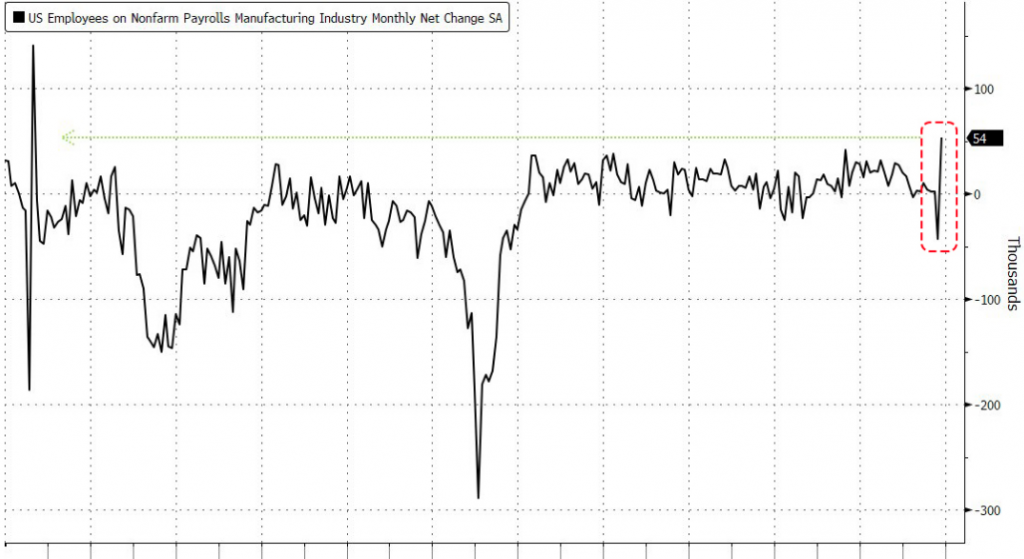
- Biggest increase in manufacturing workers since 1998 as striking GM workers return to work.
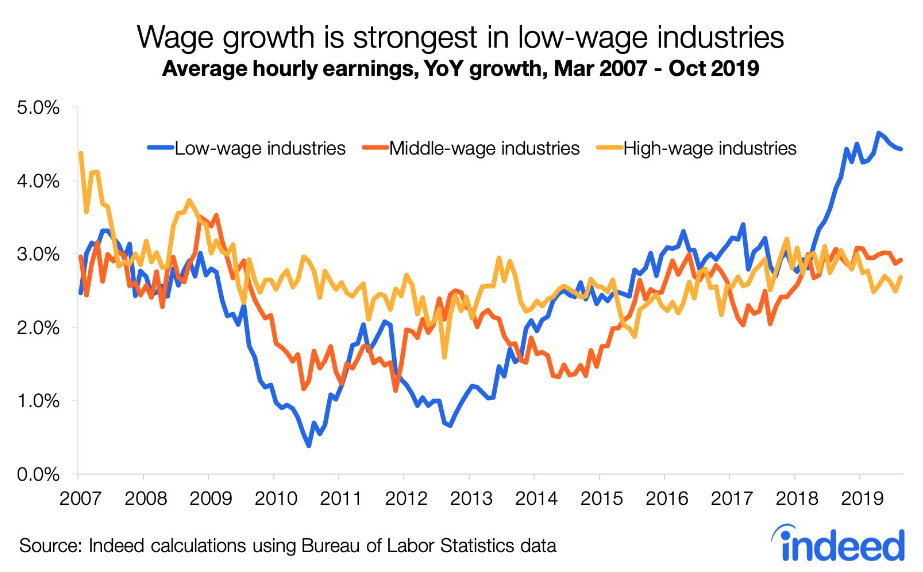
- Wage gains for workers in lower-wage industries has slowed down. But still higher than in middle & high-wage industries.
- Over the last three months, non-store retail employment is down 2,800.
- By contrast, general merchandise store employment is up 43,300. Talk about going against the conventional wisdom.