
Equity markets bounced back sharply on Wednesday and after three consecutive trading sessions found with selling pressure. The S&P 500 (SPX) managed to reclaim, hold above and close above the key 3,100 level Wednesday, even as economic came in worse than forecasted. Headlines continue to proliferate in the media from one day to the next and have been aimed squarely at U.S./China trade relations. It’s proven to be a very noisy trading week heading into the final two trading days of the week and with the S&P 500 shrugging off a mixed bag of sentiment, headlines, economic data and general market breadth readings. So what’s next?
The good news: Since WWII, the S&P 500 has gained more than 20% (total return) 26 times, however, it fell into a recession the following year only twice, according to a study by Ryan Detrick. Those two years were 1981 and 1990. Based on the study, a recession is always possible, but history would say stocks up nicely tends to suggest an economic expansion remains for the following year. With this in mind, recession fears have cooled over the last few months, based on various regional central bank forecasts and in lockstep with the surge in equity prices or indices.
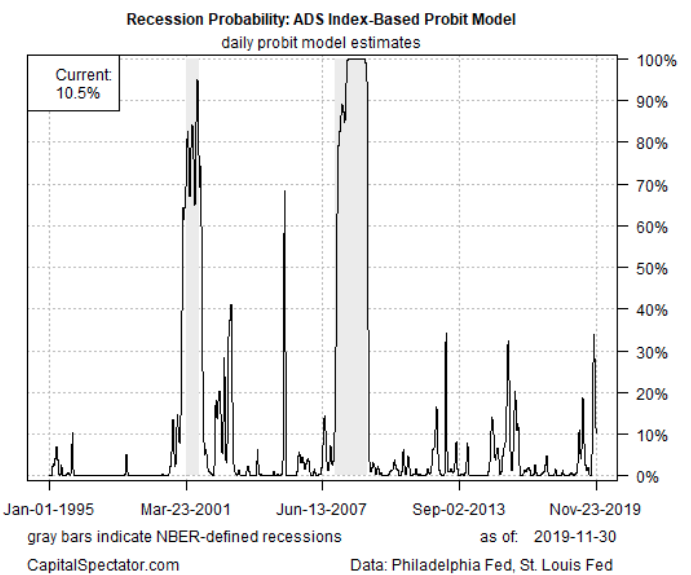
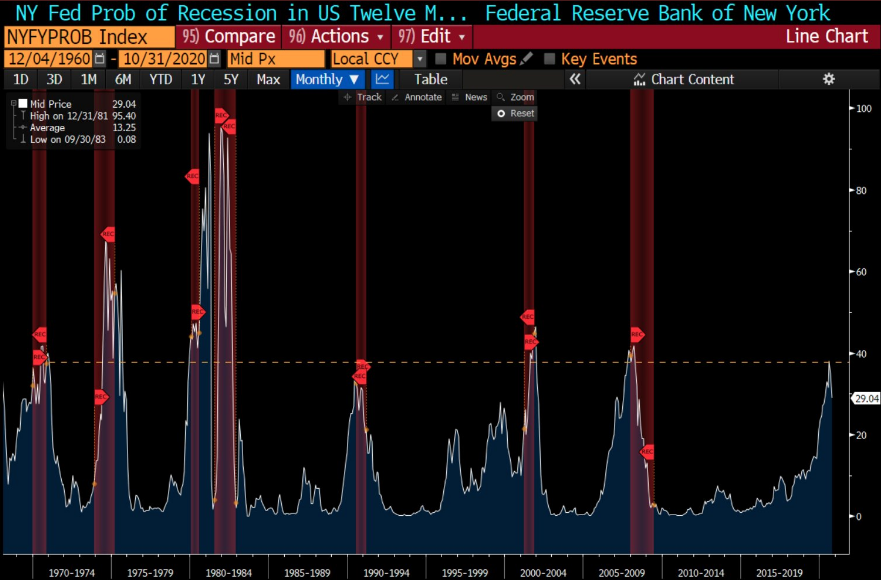
Although regional central banks identify a reduction in the probability forecast for a recession over the next 12 months, the New York Fed’s recession probability model, which takes note of the yield curve steepness and/or inversion conditions, had previously reached levels that identified and resulted in the past 7 out 7 recessions.
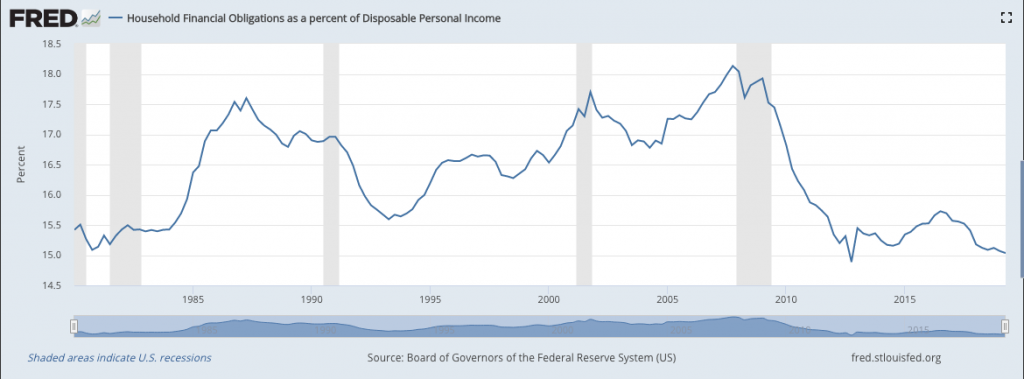
Finom Group is not of the opinion a recession will occur over the next 12 months, absent an exogenous shock to the economy. The consumer balance sheet remains at historically high levels as it pertains to household obligations as a percentage of disposable income. This is a byproduct of a record duration expansion period and bull market in equities as well as other assets such as housing. Consumer spending has been the backbone of the expansion cycle and remains at healthy levels given record low level unemployment rates and steadily growing wages.
And while our analysis on the consumer may sound like a “broken record”, it bears repeating given the relevance of an economy that is dependent and built on consumer spending. As the S&P 500 muddles through the early week of December trading, the consumer is now a focal point for investors with the holiday shopping season in full swing.
The headlines surrounding Black Friday shopping weekend aren’t difficult to find and have been widely anticipated. Coming into the holiday season, expectations were rather subdued, even though growth was anticipated.
The National Retail Federation said Black Friday’s shopping weekend found the average shopper spent $361.90, up 16% from the same period a year ago. In October, the NRF released its initial forecast, predicting that holiday retail sales in November and December will grow between 3.8% and 4.2% from a year ago.
On Cyber Monday alone shoppers spent a record $9.4 billion online, according to data released by Adobe Analytics on Tuesday. But as consumers shop more online, brick-and-mortar retailers may be having a more difficult holiday season it seems. Shoppertrak data found that sales for brick-and-mortar stores dropped 6.2% on Black Friday. Still, the NRF found that more than 124 million consumers shopped in stores during the holiday weekend.
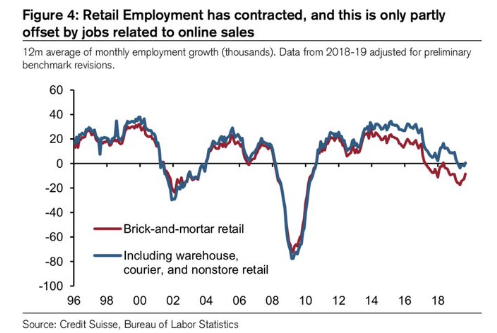
Speaking of those brick and mortar sales extrapolations, sales were up 2.3% on Thanksgiving, making total yearly growth in the 2 days combined -3 percent. Sales have been down on Black Friday for 3 straight years and down both days combined for at least 4 years at brick and mortar locations. It’s no wonder that retail sector job growth has recently come under pressure. As you can see from the chart below, the 12 month average of employment growth for brick and mortar stores has been mostly negative since 2017.
Unfortunately, we won’t get to see the full impact of the holiday shopping season until Friday of next week. What matters most to the market and GDP forecasts are monthly retail sales data. After October retail sales grew .2%, surpassing economists’ estimates, the Census Bureau will deliver the October retail sales revision alongside the November retail sales data. In between now and then, however, Redbook releases their weekly retail sales tracking data.
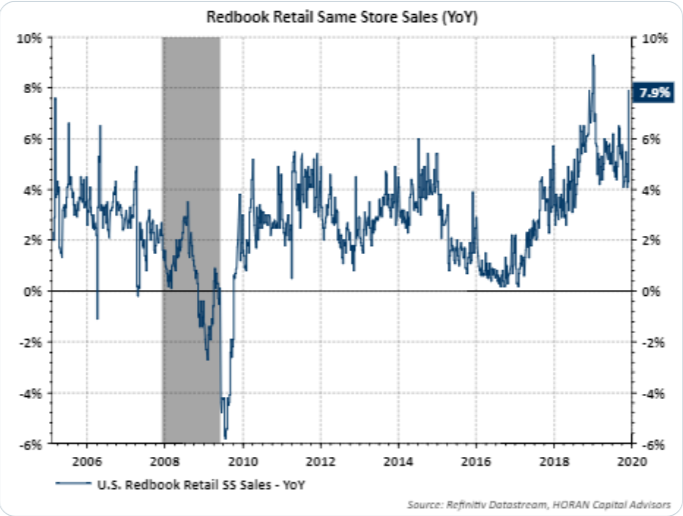
As we can see from the latest weekly reporting from Redbook, in the chart above, YoY Redbook retail sales turned shaply higher last week. This bodes well and resembles that which has been reported from the NRF and Adobe Analytics with regards to the holiday shopping season kick-off.
Beyond the strong start to the retail holiday season, the economic data of the week has already produced a mixed bag of results and some of those results are being met with consternation about the labor market. Labor and employment has been strong throughout the expansion cycle, but has also moderated lower since late 2018 and through much of 2019. Naturally, with unemployment near record low levels, the labor market will tighten and be found with slowing job growth. Having said that, slower job growth in and of itself is often characterized by a late market cycle or a cycle nearing its end of trend (expansion).
Private-sector employment slowed sharply in November, payroll processor ADP said Wednesday. Job growth rose 67,000 in the month., the smallest increase since May 2019. The gain was well below forecasts from economists surveyed by Econoday who expected a gain of 156,000.
The ADP data is often used to forecast the Nonfarm Payroll job growth, which will be delivered on Friday by the Bureau of Labor and Statistics. Prior to the ADP data, economists expected Friday’s government report will show 189,000 jobs created in November up from 128,000 in the prior month, but the increase will include workers returning to General Motors (GM) following the end of the four-week strike by the United Auto Workers. The ADP data is not impacted by the UAW strike.
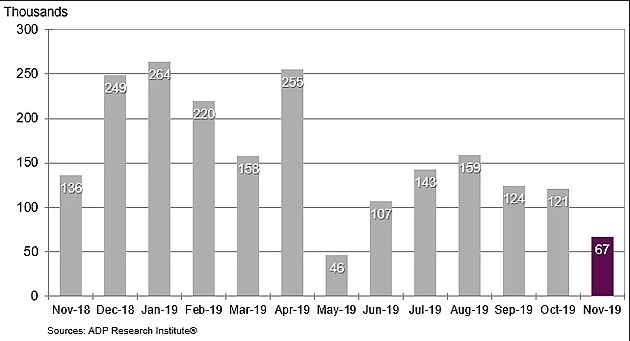
While the headline ADP payroll data was disappointing, the revisions were favorable going back 2 months. September was revised from 93k to 124k and October was revised from 125k to 121k. Net revisions over the last 2 months totaled a positive 27k and offset some of the headline weakness in the November ADP payroll report.
Overall, economists expect the labor market to cool down as economic growth is currently slowing. The government’s estimate of job growth has already moderated to 167,000 per month so far this year from 223,000 in 2018.
Alongside the slowdown in job growth, the latest reading on the service sector also cooled off a bit in the month of November. The Institute for Supply Management’s survey of service-oriented companies such as hospitals, retailers and restaurants fell to 53.9% in November from 54.7 percent.
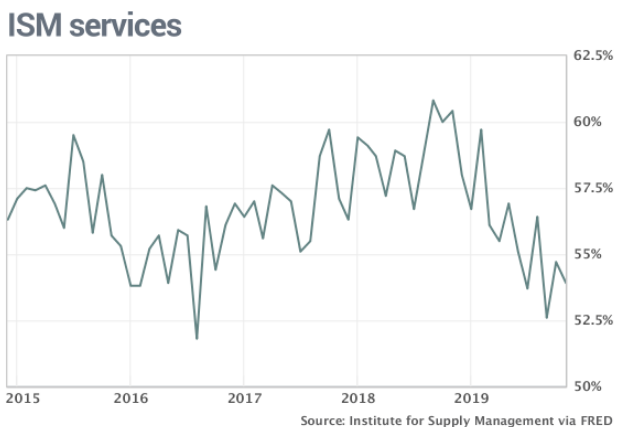
Although the ISM services index is showing itself to remain with growth even as the ISM Manufacturing index has remained in contraction territory for 3 months now, it is also below its 5-year average. Akin to the latest employment data, the ISM Services index is found with late cycle characteristics. Of course, these weakened economic data series are being impacted by a protracted trade war and the weakness can be traced back to the initiation and implementation of tariffs in July 2018.
As we’ve seen in the past and with the manufacturing data series between the ISM and Markit data, the latest services surveys are also found with disparity. The November U.S. Services Purchasing Managers’ Index conducted by Markit came in at 51.3%, up 1.0 from the final October estimate of 50.3 percent. The Investing.com consensus was for 51.6 percent.
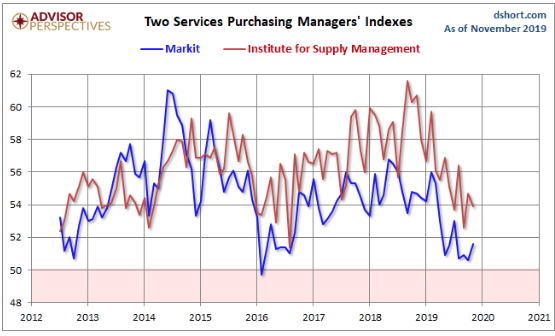
“With both services and manufacturing reporting stronger rates of expansion, the November PMI surveys indicate the fastest pace of economic growth for four months. The improvement is coming from a low base, however, and even at these higher levels the survey is merely indicative of annualised GDP growth in the region of 1.5%, said Chris Williamson, Chief Business Economist at IHS Markit.“
“Similarly, while reviving order book growth has encouraging more companies to take on extra staff after two months of net job losses being reported, the survey’s employment index continued to run at a level consistent with monthly jobs growth of only around 100,000.“
As it pertains to the labor market, investors will be eying the release of weekly Jobless Claims on Thursday.
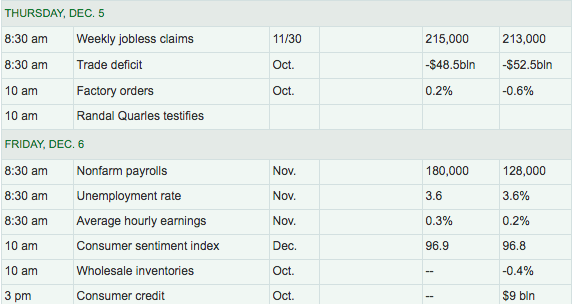
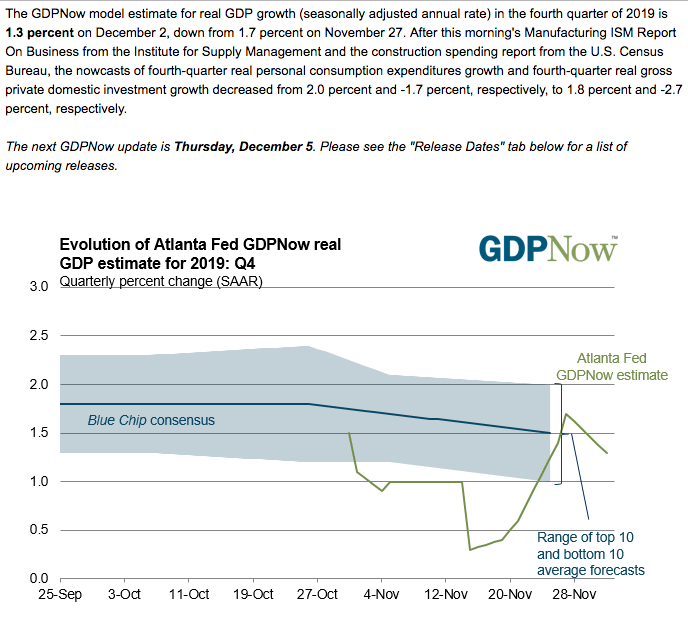
Combined with the trade deficit data and factor orders, the economic data scheduled for release on Thursday will aid in the Atlanta Fed’s Q4 GDP revision. The current Q4 GDP forecast from the Atlanta Fed stands at 1.3% growth, which was downwardly revised from a previous 1.7% GDP forecast.
Enough, enough with the economic data. The reality is that the economy has weakened on a YoY basis, but still does not point to a recession over the next 12-month period. At worst, the economy will simply continue to moderate at a lower rate of growth, but still with GDP growth around 1.7-2.3% over the next 12-month period. Unless, unless the December 15th tariffs are implemented.
On December 4, 2019, Finom Group outlined the reasons for sidestepping the December 15 tariffs. Our calculus suggested that implementing the tariffs would prove disastrous for the holiday shopping season, the economy going into 2020 and for the President’s re-election probabilities. Our rationale proves sound across 8 key points outlined within the article titled “Markets Roiled Ahead of December 15 Tariff Deadline“. The problem with the rationale, logic and/or calculus formulated and disseminated is that it is found with all the aforementioned characteristics, but possibly met with an impetus President that has often “gone against the grain”, as they say. Yesterday was just another example of the President’s uncommon behavior or decision making.
President Donald Trump on Wednesday abruptly canceled a press conference that was scheduled to cap a contentious trip to the U.K. for the North Atlantic Treaty Organization’s 70th anniversary meeting.
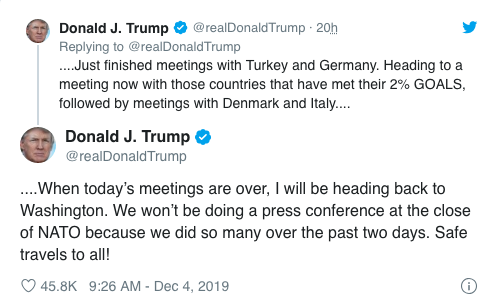
Later Wednesday, Trump explained that “There’s no reason to have press conferences because you had about eight of them,” apparently referring to his lengthy prior remarks to reporters. While Trump’s explanation was apparently enough to satisfy his person, it still flew in the face of the outlined schedule of media events and the customary press conferences. To wit and as we harken back to the topic of the December 15 tariffs, analysts and strategists can only err on the side of norms and best interest for the economy, but that may not be able to account for the President’s desires and decision making, for better or for worse. Speaking about the tariffs, once again, here is what Bleakley Advisory Group’s chief investment officer Peter Boockvar expects from the President on the subject matter:
“I do not believe that they will follow through with the December tariffs. If we do not have a [China trade] deal, I think they’ll couch it and we’re just postponing the tariffs. The administration knows how sensitive we are to the possibility of those extra tariffs particularly hitting the consumer.
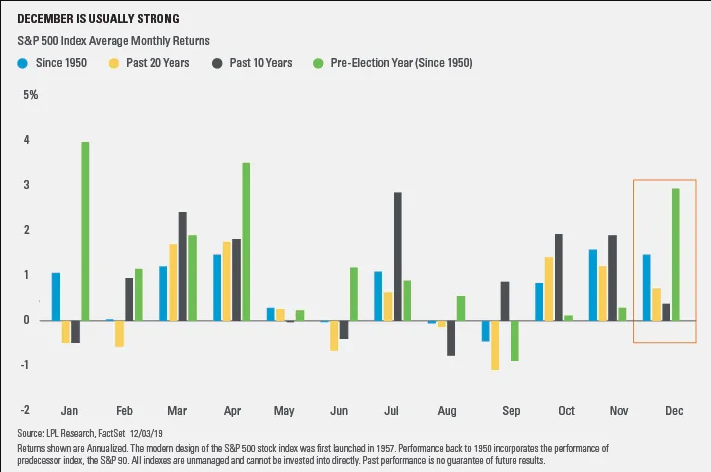
As if the end of the month and a super strong year for the S&P 500 bear disruption from tariffs? Nonetheless we continue to look forward to the final trading weeks of the year… and the decade. The rocky start to December, which is typically a strong month for equities, is forcing investors to recall the December 2018 debacle, whereby the S&P 500 fell some 9 percent. Stocks have also overcome volatile starts to December in the recent past. The S&P 500 was down four days in a row in December to start 2013 and 2017, but the gauge still managed to gain 2.4% and 1%, respectively, in those years.
December has been the second-best month of the year for stocks going back to 1950. Stocks have historically been strong in pre-election years also, and December has never been lower 2 times in a row during a pre-election year, according to studies conducted by LPL Financial and identified in their chart below.
After a brief drawdown in the S&P 500 and rise in volatility to kick-off the month of October, the market bounce back on Wednesday came with a decline in market volatility as well. One percent moves in the S&P 500 have been hard to come by during 2019 and in recent months especially. DataTrek recently identified the trading day frequency found with 1% daily moves by quarter and for the calendar year, as follows:
- Q1 2019 (below average). 11 days when the S&P had a daily return of +/- 1% versus Q1’s average of 13 since 1958 (first full year of data). Three of those 1% days were negative, while the balance were positive.
- Q2 2019 (well below average). 7 one percent days in the second quarter (4 down, 3 up), versus Q2’s average of 13 over the last six decades.
- Q3 2019 (above average). 14 one percent days (5 down, 9 up) in Q3, over the quarterly average of 13 by one. That was largely due to August, which had 11 one percent days. By contrast, there was only one 1% day in July and two in early September.
- Q4 2019 QTD (well below average). There have been 6 one percent days so far this quarter compared to the Q4 average of 14 (3 down, 3 up). October accounted for all those 1% days, as November had none.
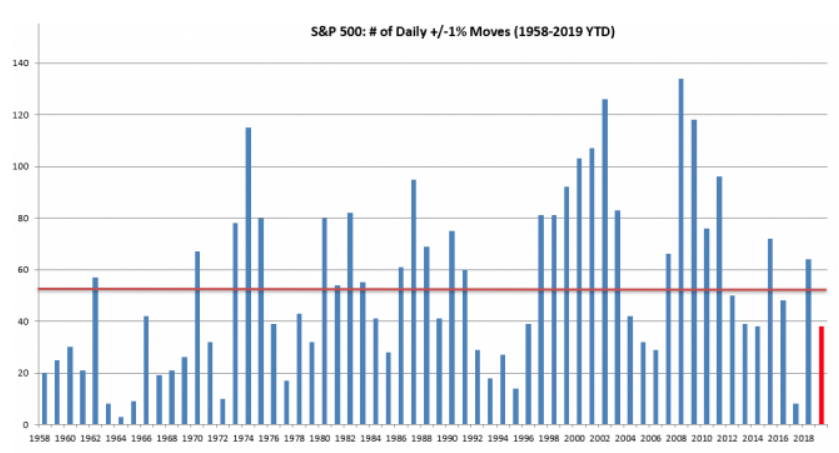
The bar chart above identifies the total number of 1% days per year over the past 60 years.
- There has been a total of 38 one percent days so far this year compared to the annual average of 53 over the past 60 years. Volatility is therefore running below pace in 2019.
- Our bar chart of annual S&P 1% days before this note shows a clear pattern over the last six decades. Big market swings happen during the start of a bull market, abate and then rise again towards the end of annual sequential gains in U.S. stocks.
U.S. equity futures are pointing toward a continued rally from Wednesday and ahead of key economic data releases. The VIX is also pointing toward a more complacent market with greater confidence that tends to characterize the typical December volatility. December is typically the least volatile month of the year. The VIX has bottomed eight times for the year in December since it was created in 1990, which is the most of any month. That said, the VIX has peaked once during the last month of the year back in 1996, so while uncommon, it’s not unprecedented. Worth noting: this year’s low-to-date on the VIX was on November 26th, at 11.54.
With this in mind, Finom Group’s most recent short-VOL position is likely to be covered for a quick profit on the week. On Wednesday, Finom Group took advantage of continued share price appreciation in shares of Coca-Cola (KO) by closing out a long trade initiated in the past week.

Subscribe to Finom Group’s Premium Membership and take advantage of our daily, weekly and long-term trade ideas and offerings. Join us daily in our live Trading Room where we discuss all matters of the economy and daily trading activity in and around the market place. We look forward to what December has in store! Happy trading folks!


