Research Report Excerpt #1
That’s right. This past trading week was strong, but it wasn’t “uber” strong, as the kids say! In late May, the S&P 500 had a weekly gain of greater than 6%, as outlined below:
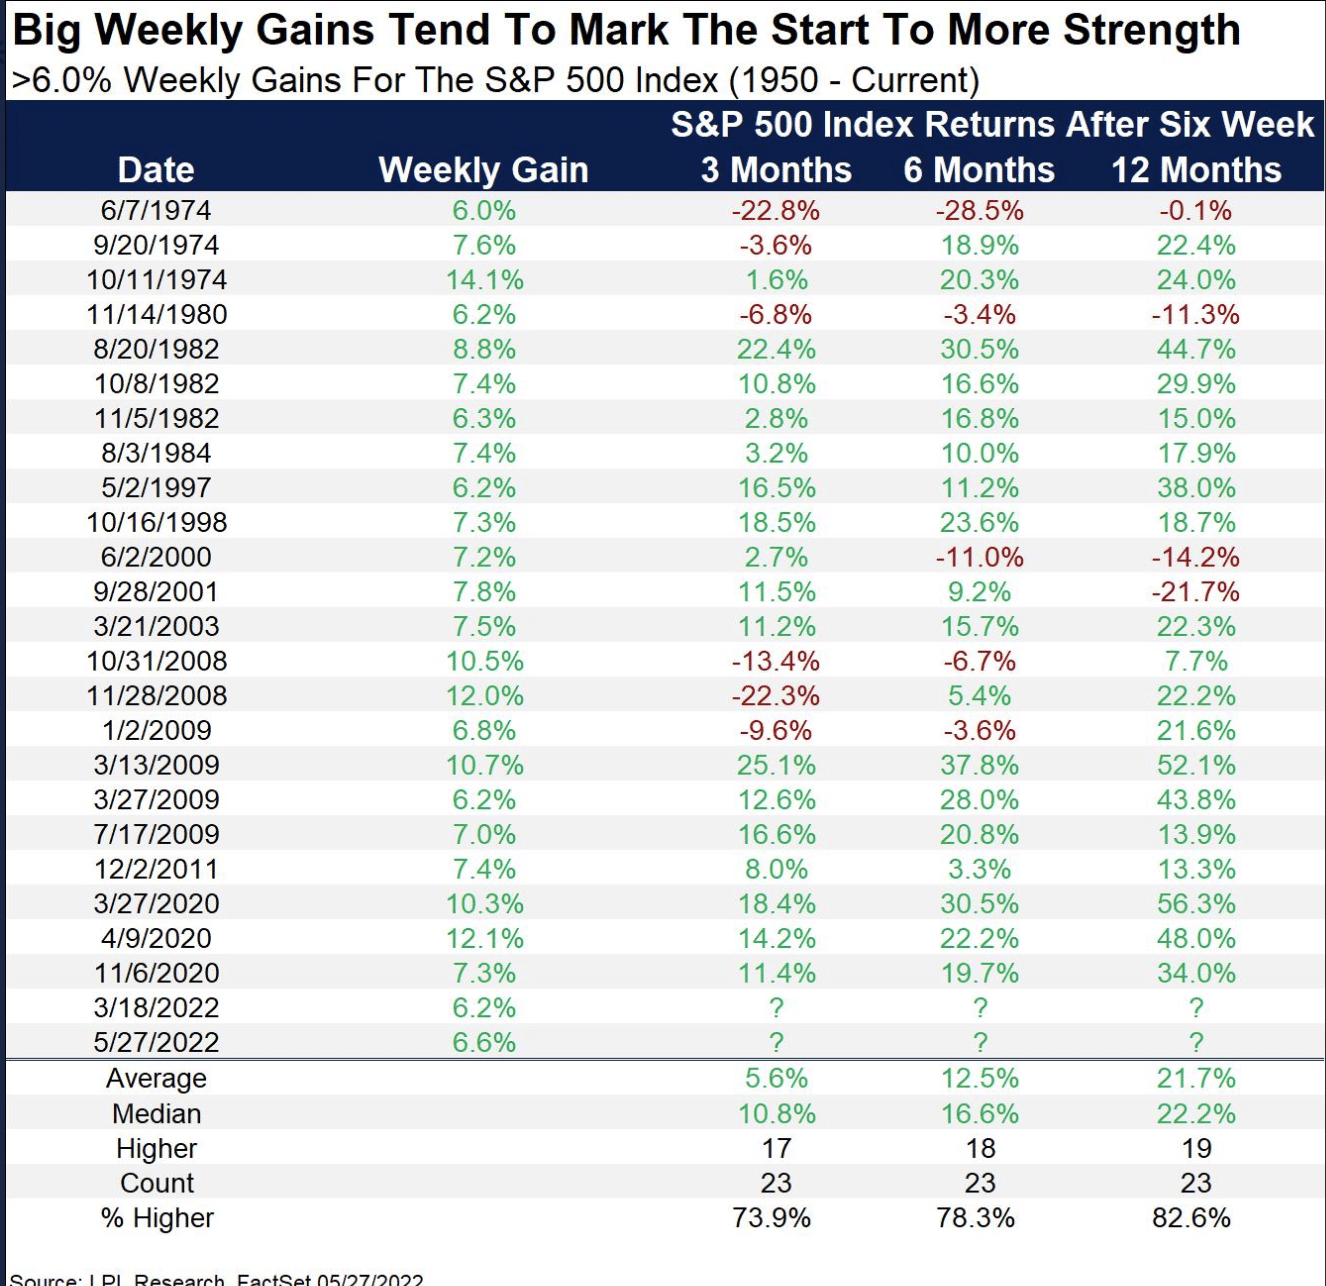
- From May 20th to May 27th, the market rallied greater than 6%.
- One step forward, but unfortunately that resulted in 2 steps backward and new lows for the major averages in June.
- Nonetheless, these types of outsized weekly gains usually hold strong forward returns out 3-12 months.
- The key seems to be avoiding a recession, otherwise negative returns were found in 1980 and 2008.
On May 27th, the S&P 500 closing value was 4,158. That was before the Jamie Dimon “economic hurricane is coming” comments, whereby the major indices all plunged to their mid-June lows. With the data in-hand, there is still another month before the 3-month data begs to be approved by August 27, 2022. After a weekly gain of 6% or greater, the average 3-month return is 5.6%, and the positivity rate is almost 74 percent. We can’t be certain that the average or median (which is much higher than the average) gain will be achieved, but unless the current macro-regime proves to be a 1974 or 2008 situation, we would anticipate higher prices (above 4,158) by August 27th. Given the data above, the S&P 500 has an 74% probability of being above 4,158 as of August 27th. 
Research Report Excerpt #2
When July is up in the mid-term election year, August is up 77% of the time. The following study was delivered by Bank of America, depicting August and September returns when July was positive during a mid-term election year:
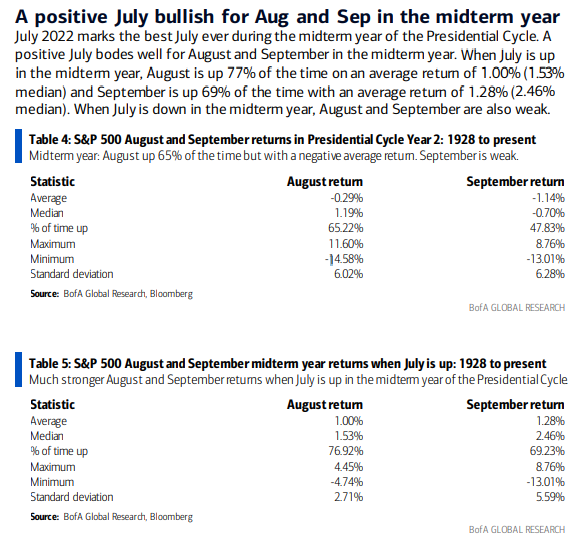
Be sure to look at the bottom study for the stated criteria. Based on the data above, September is also stronger than any year when July is positive, with an average return of 1.28% and up 69% of the time.
Research Report Excerpt #3
As for continuing claims, the latest week saw a 25K decline to 1.359 million. While that does mark some deterioration from the strongest levels, unlike initial claims, continuing claims are still well below levels from prior to the pandemic indicating a still very healthy labor market the likes of which has not been seen in decades as the insured unemployment rate (continuing claims as a percentage of the number of those covered by state insurance programs) continues to hover near 1%. (Bespoke Investment Group)

- Fun facts: In the first 6 months of the 1981-82 recession, we lost 1,046k jobs. In the first 6 months of the 1990-91 recession, we lost 690k jobs. In 2001 we lost 761k jobs. In 2007-09, we lost 705k jobs. In 2022 we gained 2,740k jobs. Do you really think the current macro-economic backdrop is consistent with recessionary conditions?
Research Report Excerpt #4
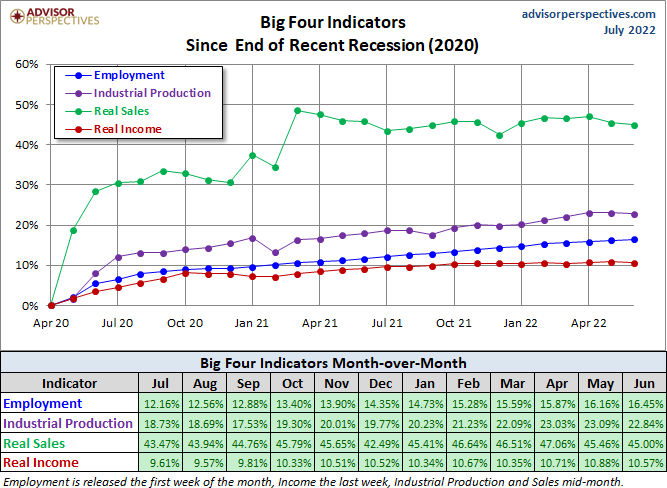
The chart and table below illustrate the performance of the generic Big 4 with an overlay of a simple average of the 4 since the end of the most recent recession (2020). The data points show the cumulative percent change from a zero starting point for April 2020.
Not to belabor the point, as Finom Group has remained of the belief that the economy is not in a recession or would find itself with conditions expressing an imminent recession, but only 2 states within the Union are currently experiencing contracting GDP; Alaska and Montana which are the least populous states in the Union.
Research Report Excerpt #5
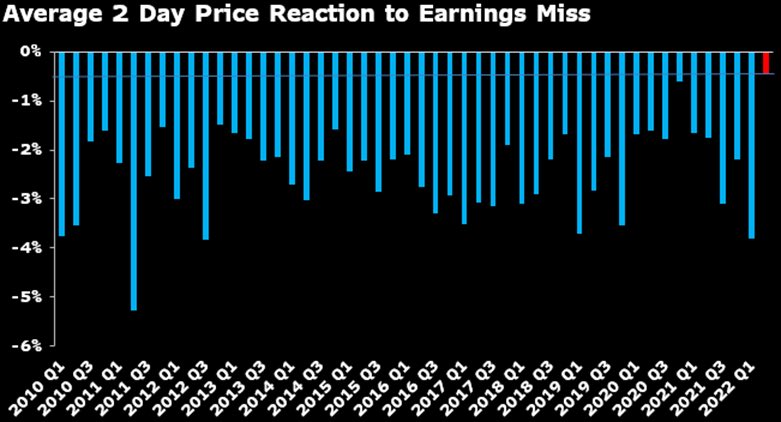
This has been a repeated trend thus far through earnings season, whereby bad news or results have been treated favorably. Stock price reactions to earnings misses in the S&P 500 are now the lightest on record. Clearly sentiment got too bearish in front of this earnings season.
Research Report Excerpt #6
There were many signs that a market bottom was near and/or forming over the prior couple of months. Recall that the Monthly Williams %R and Normalized ATR were both at their -.80/80 extremes in late May:
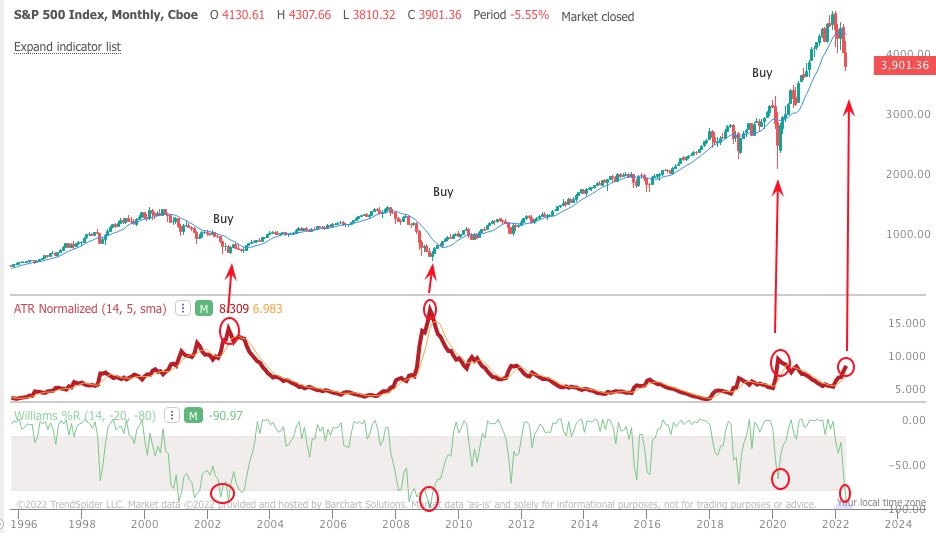
Historically, when these 2 stochastics are at such extremes, the market is within months of a bottom and investors have been well-rewarded for buying since the 2000s. This was just one technical signal suggesting the bottom was in or near, and why we follow it during steep market drawdowns and bear markets. After sustaining a durable bear market in 2022, and witnessing stochastic and breadth extremes, a new bull market signal was the next objective.
Research Report Excerpt #7
The breadth thrust that was signaled was founded by Jeff deGraaf (yes that is how it is spelled out) of Renaissance Macro Research. The breadth thrust fires when the percent of S&P 500 stocks trading at their 20-DAY High reaches 55% or greater. This happened as of Thursday this past week and is indicated in the chart below.

Thrusts can, and often do, signal strong & sustainable upward momentum for stocks that can last up to a year.
Research Report Excerpt #8
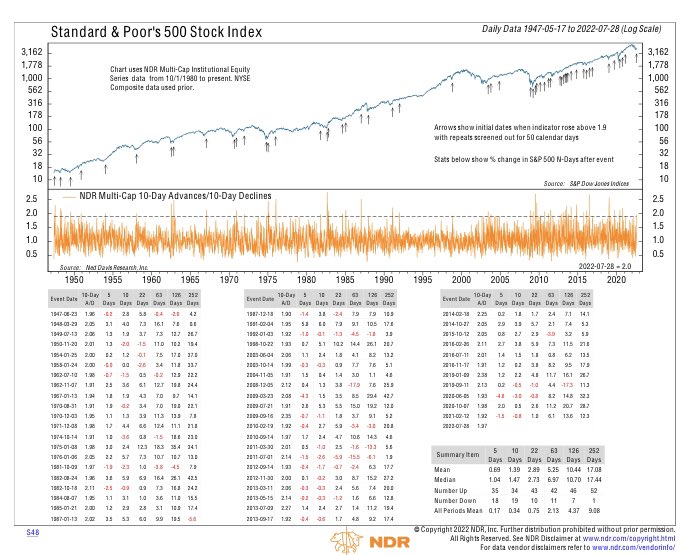
The other breath thrust that signaled on Thursday was the 10-day advances/10-day declines. This measure of market breadth is more short-term oriented, as it constitutes 10 days, but it is equally significant in the way of forward returns. This breadth measure rose above 1.9 for first time since Feb 2021, and we all know what happened after this signal fired in February 2021. It may prove difficult to see the forward S&P 500 return legend in the lower right-hand corner, so we blew it up, just below:
Research Report Excerpt #9
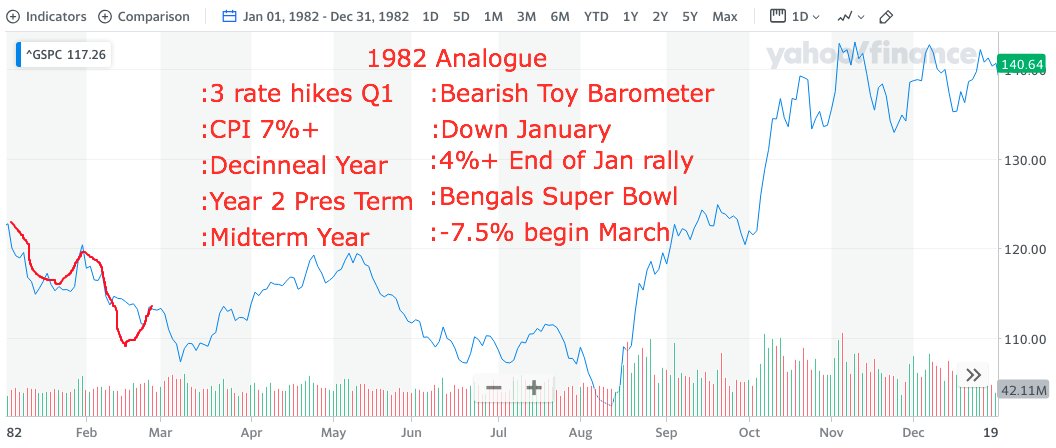
There remain a litany of likeness between 1982, when Paul Volcker pivoted from an extremely hawkish monetary tightening cycle given the battle against inflation of 8.2%, to an easier monetary policy in the second half of 1982. There are many market participants whom believe that the Fed will begin to slow the pace of rate hikes by the September FOMC meeting, with the prospects of a disinflationary cycle taking shape.