Is the market solidifying a bottom with a new uptrend having commenced since late June? Today’s conversation offers several indicators and historic technical guide posts that suggest investors should be looking to increase equity market exposure in the coming weeks and months if the historic probabilities repeat, if not rhyme. To watch the corresponding video narration with Seth Golden, click the provided link!
How Did We Get Here: My TOYS Suck!

- Nov. 19 – Jan. 19.
- Bullish if >3% SPX return during this time period.
- n=36
- Forward 12-month SPX returns = 16.4% on average
- % positive rate= 96%
- Down in 1987 & 2018 only
- Fired bullish in 2021, up 26%+
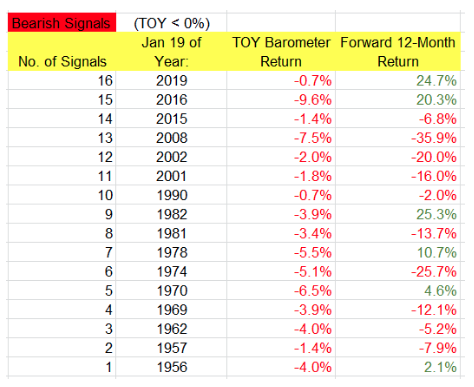
- TOY Barometer bearish for 2022 (Wayne Whaley)
- TOY covers Nov. 19 – Jan 19 New Year
- < 0% SPX return during time period is bearish
- n = 16 previously
- up = 6, down = 10
- Fwd 12-month SPX average return -14.6%
- Previous 2 bearish signals produced above average returns
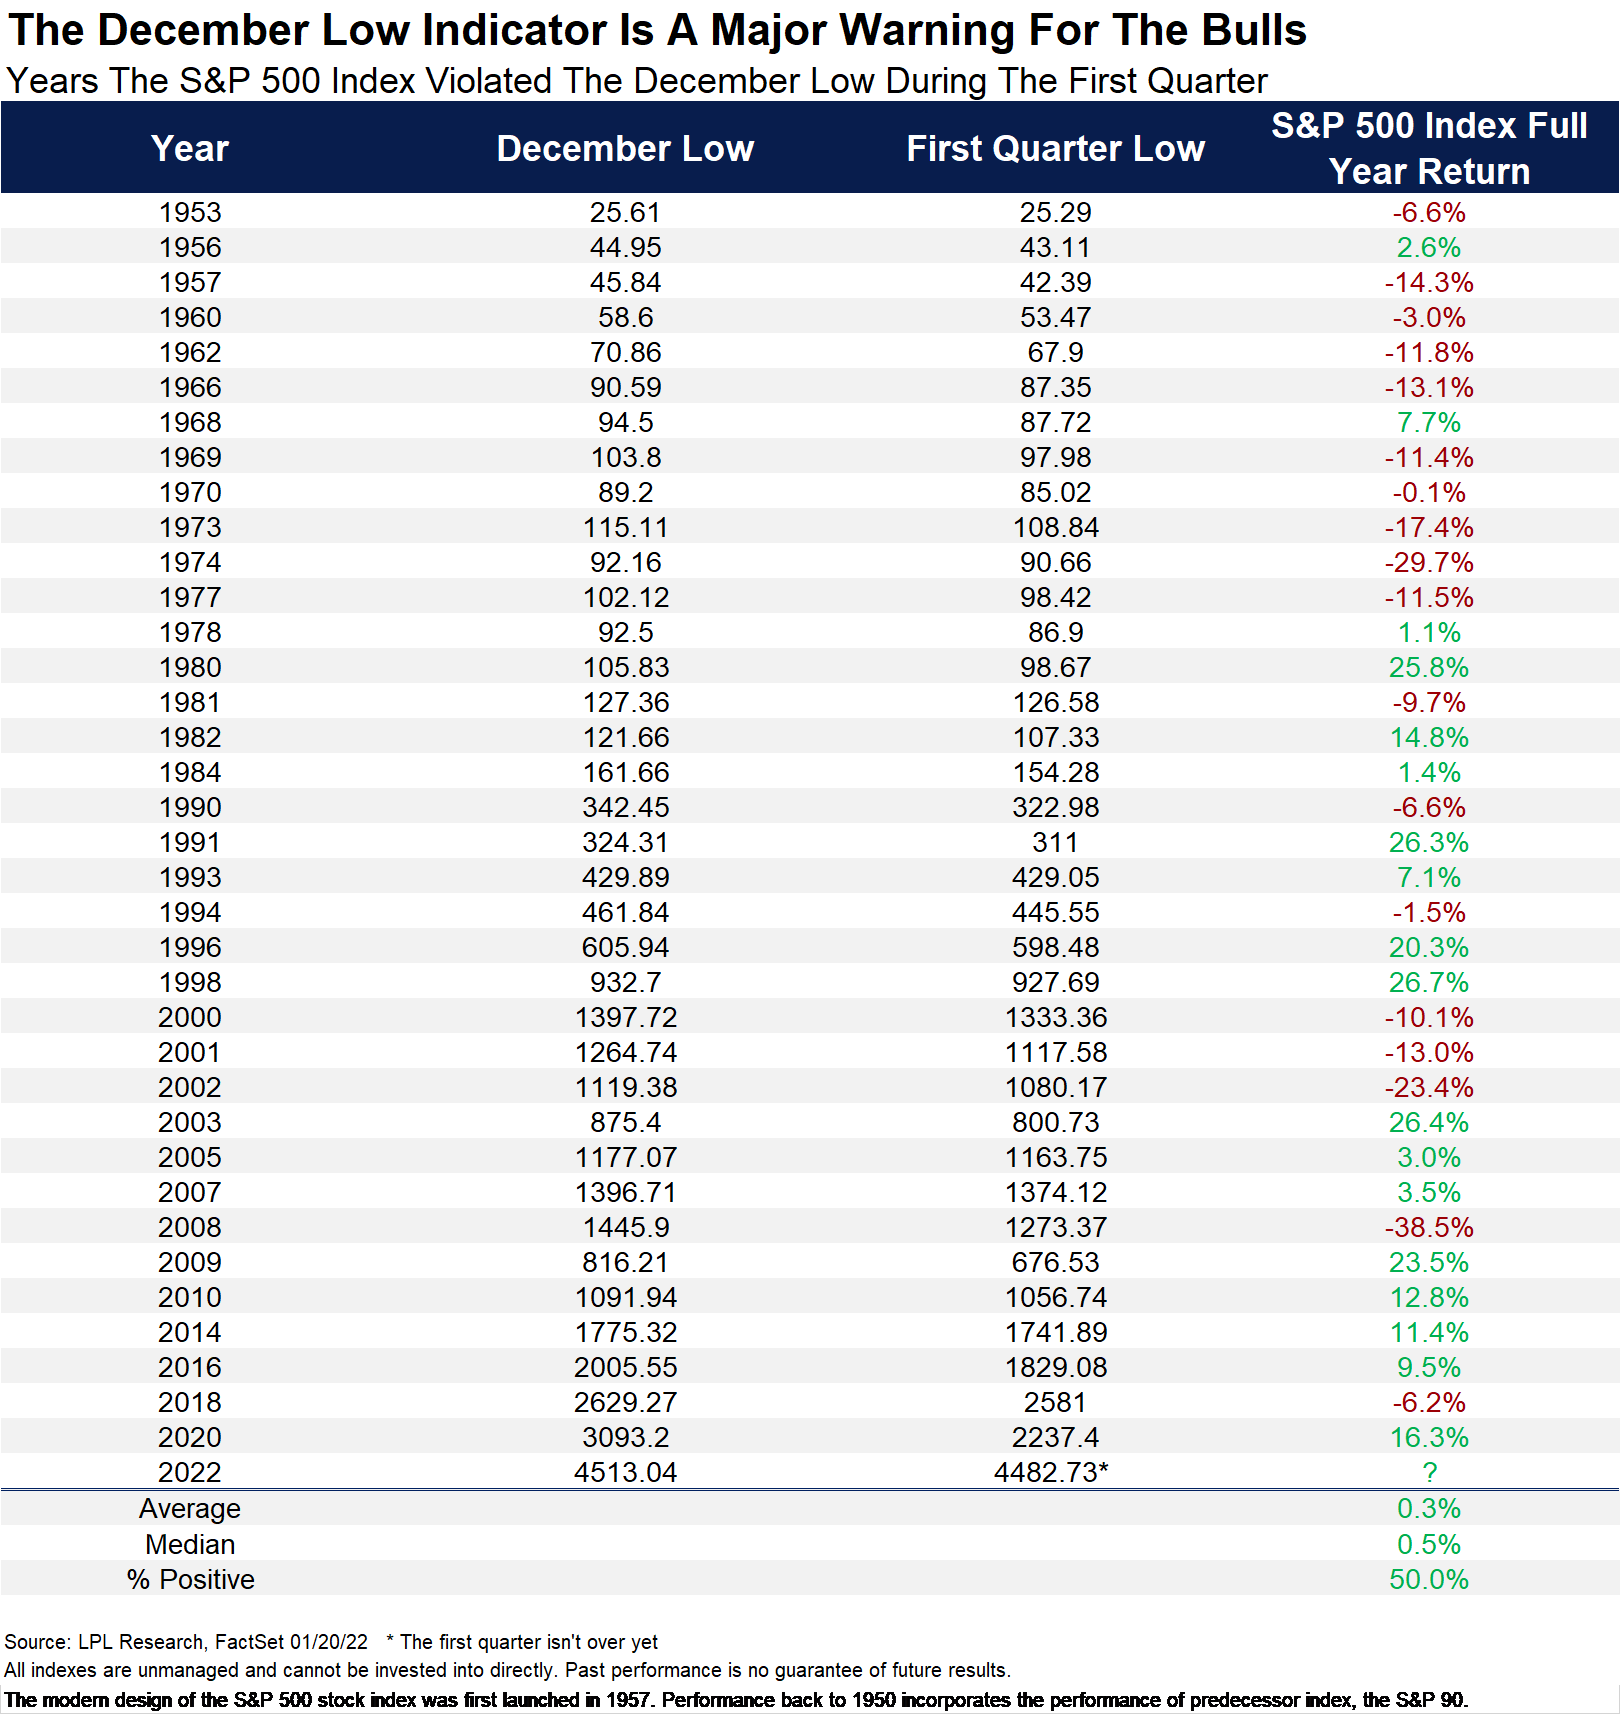
- You don’t want to close below the December Low of the previous year in Q1 of the current year.
- December Low close during the first quarter happened 36 other times since 1950.
- Full year up 50% of time, but up only 0.3% on average.
- Makes for tough sledding.
- Majority of negative 1-yr returns were also mid-term election years.
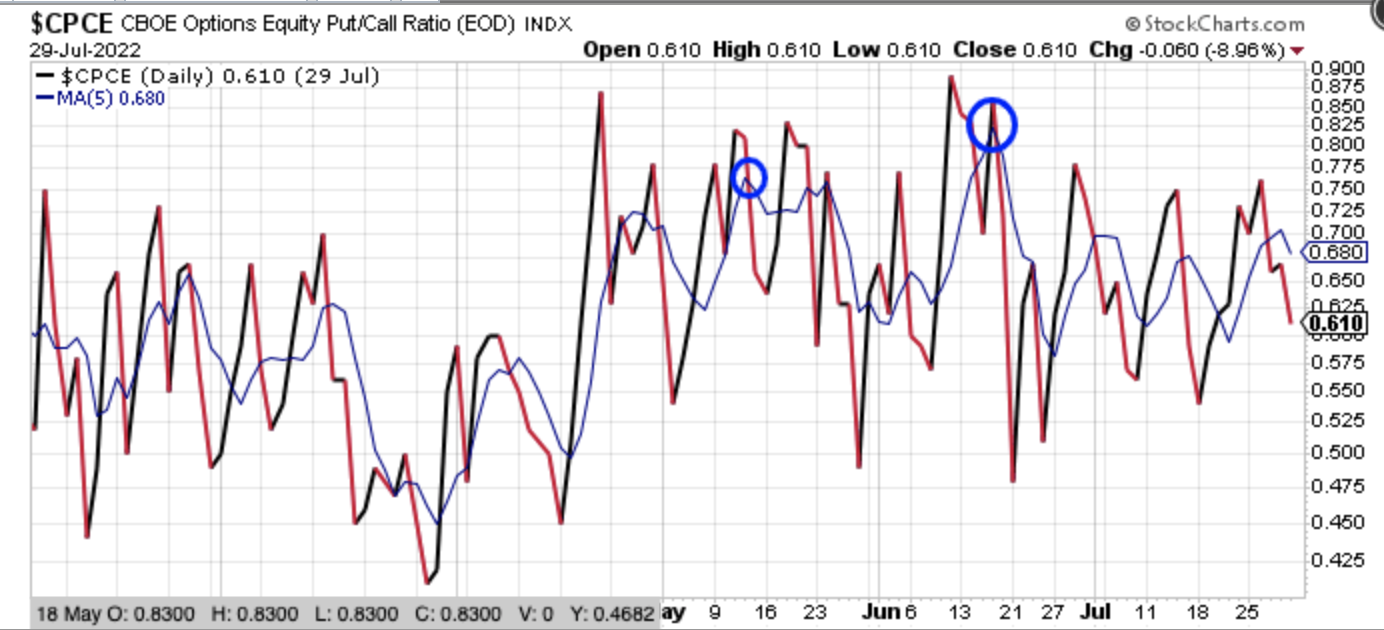
Put/Call Signals Cyclical Low
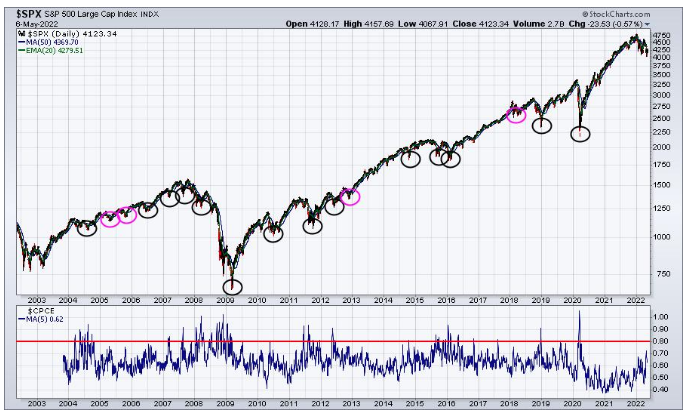
- N = 18
- 15/18 above .80
- 3 pink circled .75
- .76 on May 13, 2022
- peaked at .85 on June 17
- EVERY, single, market bottom has been signaled by the 5-day moving average Equity Only P/C ratio of .75 or better since 2004.
QQQ Relative to SPY Formed a Cyclical Low
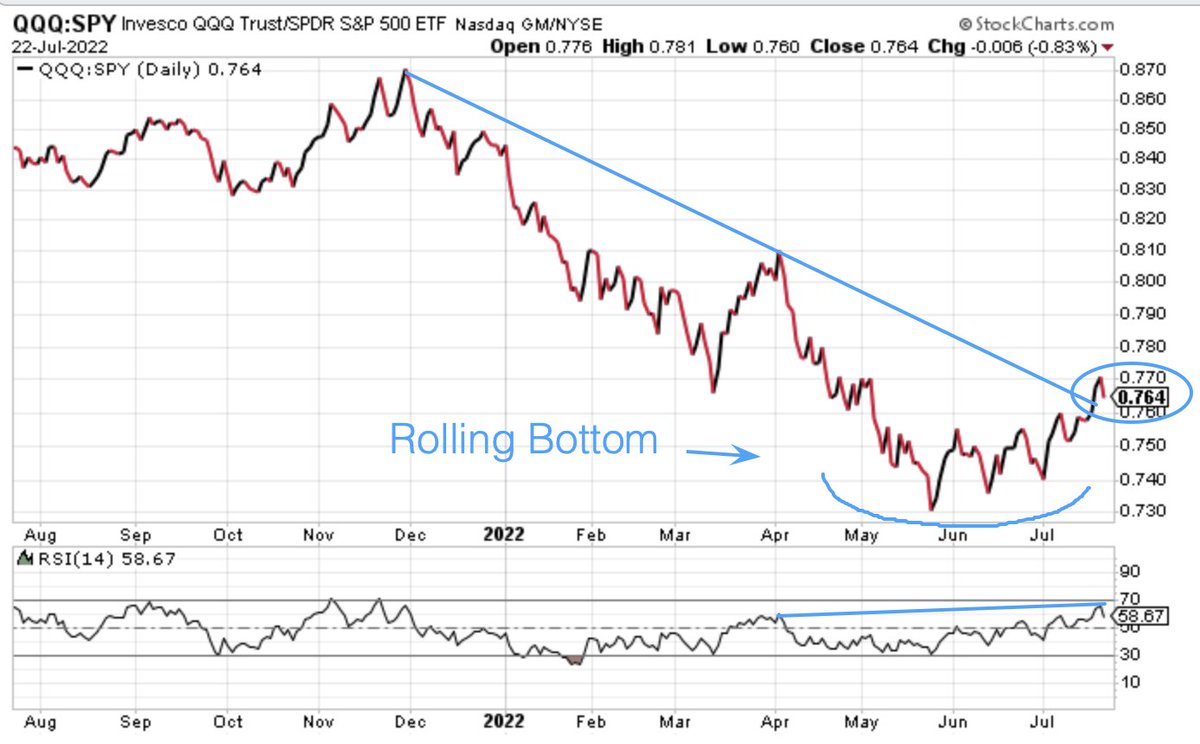
- Since 2008, *every time QQQ broke trend line of underperformance to SPY (minimum 5months), it has marked RELATIVE bottom in the market. NO RETESTS!*
- 2008: Aug -Jan 2011
- Jan-June 2015
- Nov-June (2016)
- 2018: Jul-Dec
- 2020: (*lockdown exclusion)
Williams %R & ATR Achieved a Cyclical Low
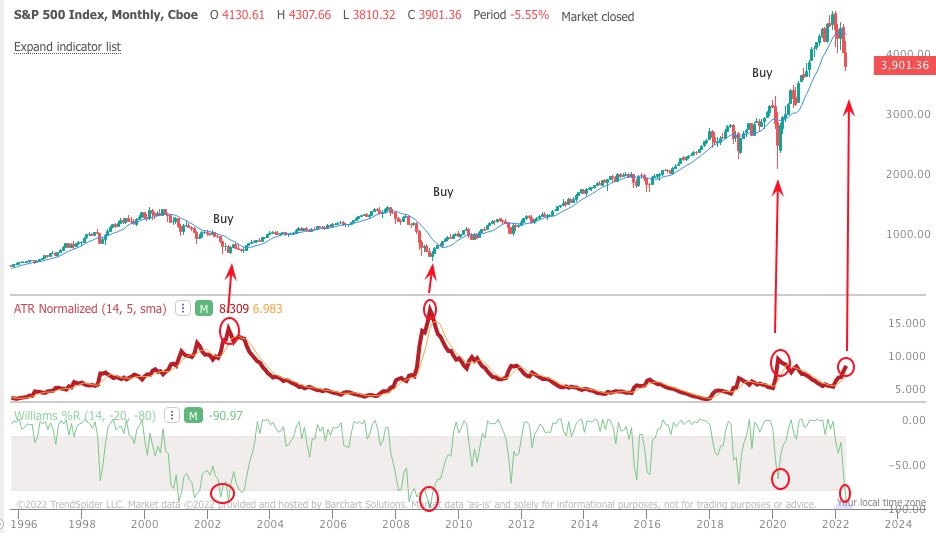
- There were many signs that a market bottom was near and/or forming over the prior couple of months. Recall that the Monthly Williams %R and Normalized ATR were both at their -.80/80 extremes in late May:
- Historically, when these 2 stochastics are at such extremes, the market is WITHIN MONTHS OF A BOTTOM, and investors have been well-rewarded for buying since the 2000s. This was just one technical signal suggesting the bottom was in or nearing, and why we follow it during steep market drawdowns and bear markets.
Nasdaq 100 % Above 150-DMA Cyclical Low
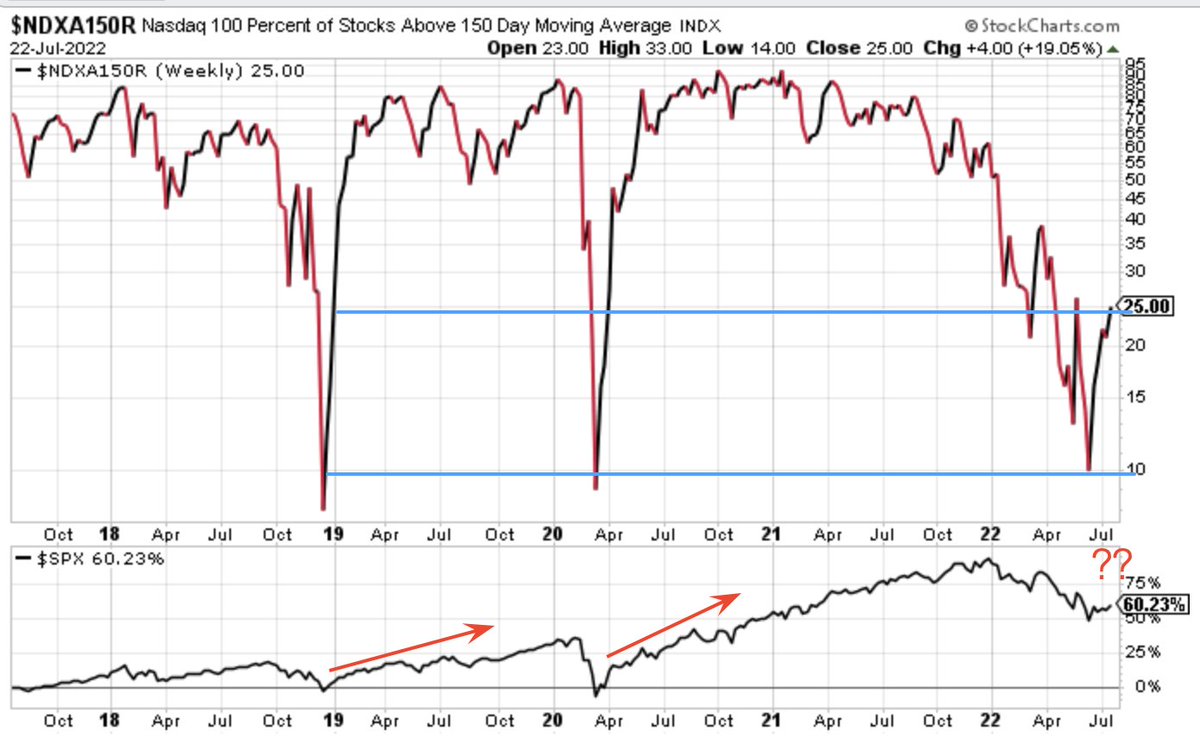
- When Nasdaq 100 cycles fewer than 10% of stocks above their 150-DMA to 25% above their 150-DMA, the BOTTOM has been made.
- S&P 500 was higher 1-year later 100% of the time
- Average 1-yr return = 27%
- Max drawdown = 11%
- Average drawdown = 5%
- Average days in drawdown =30

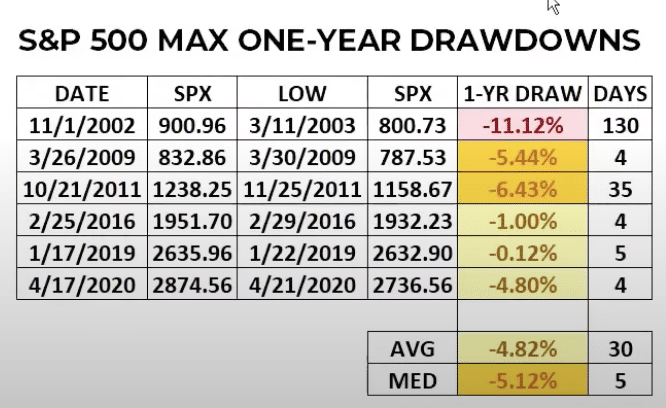
- Unfortunately or fortunately, depending on your capital allocation plans, while the low has been in for every occurrence, that doesn’t mean there wasn’t some “back-n-filling” that occurred.
- The 1-year maximum drawdowns for each occurrence are noted in the chart above from Chris Ciovacco.
NYSE % Above 200-DMA Cyclical Low

- Typically see NYSE % of stocks above their 200DMA drop below 20% before the bottom in the market is achieved. Got to 15% in June 15, 2022.
- Historically, forward S&P 500 returns are quite strong.
- 1-month = 3.7%
- 3-months = 8.6%
- 6-month = 12.2%
- 12-month = 16.6%
The NYSE Summation Index Cyclical Low

- Historically, when the NYSE Summation Index cycles from below -750 to UNCH, a Bull Market formed.
- Negative -750 in March and rallied back up to -100.
- Dropped to a low of -850 in May and has been rallying ever since.
The Smart Money & Institutional Money Buying
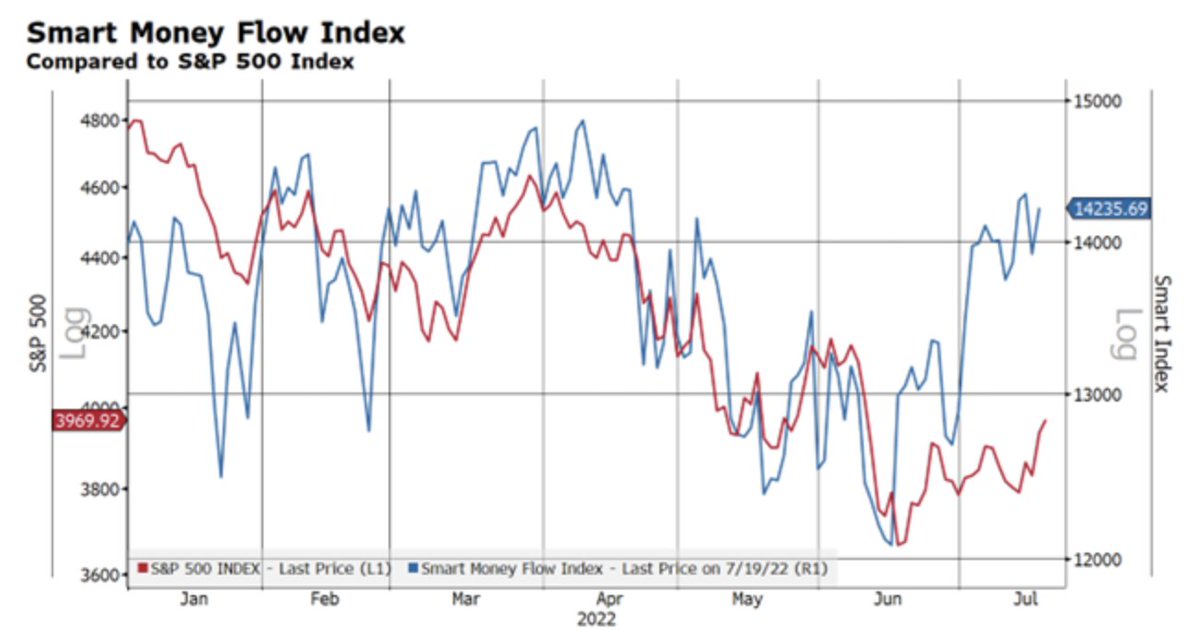
- Smart Money Flow Index (SMI) measures trading in 1st and last hour of day.
- When rising it is generally consistent with rising market, as it informs institutional investors are buying into the market.
- Off the June 17 low, SMI surged, and continues to rise.
55% of S&P 500 Stocks at 20-Day Highs

- The Fed day came and went with a bang, but a good bang!
 Gaining more than 3.5% on top of what had already been a month-long rally gave the S&P 500 that extra boost to express a breadth thrust. The breadth thrust that was signaled was founded by Jeff deGraaf (yes that is how it is spelled out) of Renaissance Macro Research. The breadth thrust fires when the percent of S&P 500 stocks trading at their 20-DAY High reaches 55% or greater. This happened as of Thursday this past week and is indicated in the chart below.
 - Thrusts can, and often do, signal strong & sustainable upward momentum for stocks that can last up to a year. The emergence of a new breadth thrust is strong evidence that the market environment is back to rewarding risk-on behavior. Now let’s look at the table of forward S&P 500 returns after this breadth thrust fires. The data goes back to 1979 and is offered by All Star Charts.
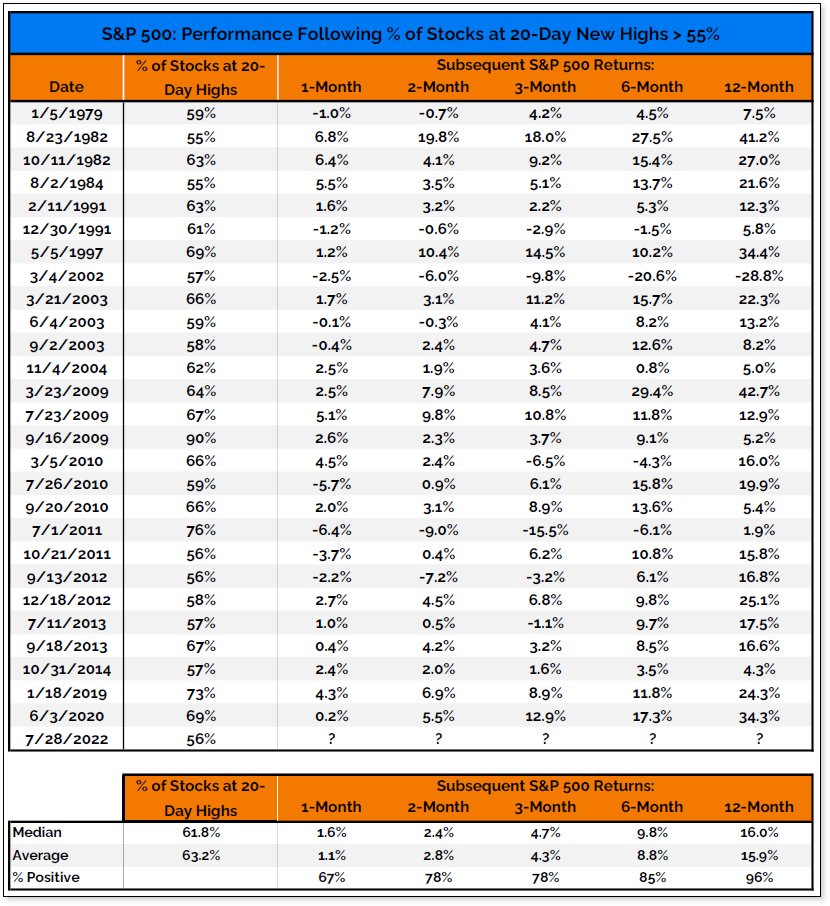
- As we can see from the quantitative data, the forward returns are increasingly positive and more probable as time progresses.
- The 12-month average and median returns are roughly 16% and the positivity rate is 96%.
- Essentially, something really significant or exogenous has to take place in order for the S&P 500 not to be higher 12 months from July 28, 2022, when the breadth thrust fired. (All Star Charts)
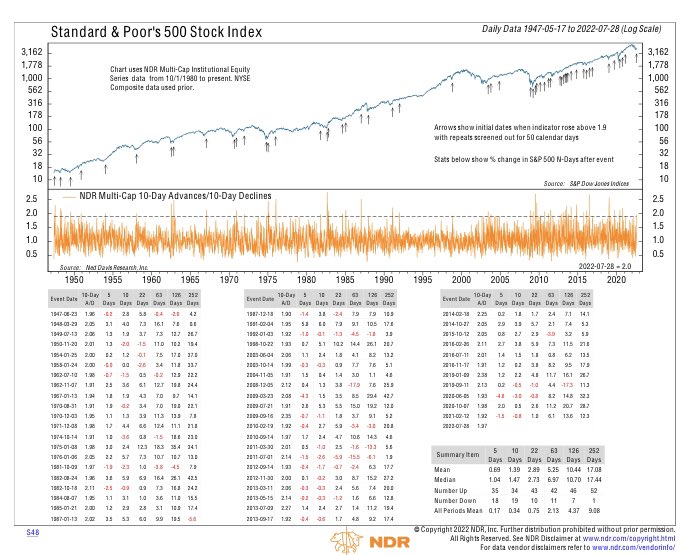
- The other breath thrust that signaled on Thursday of last week was the 10-day advances/10-day declines. This measure of market breadth is more short-term oriented, as it constitutes 10 days, but it is equally significant in the way of forward returns.
- This breadth measure rose above 1.9 for first time since Feb 2021, and we all know what happened after this signal fired in February 2021.
- It may prove difficult to see the forward S&P 500 return legend in the lower right-hand corner, so we blew it up, just below:
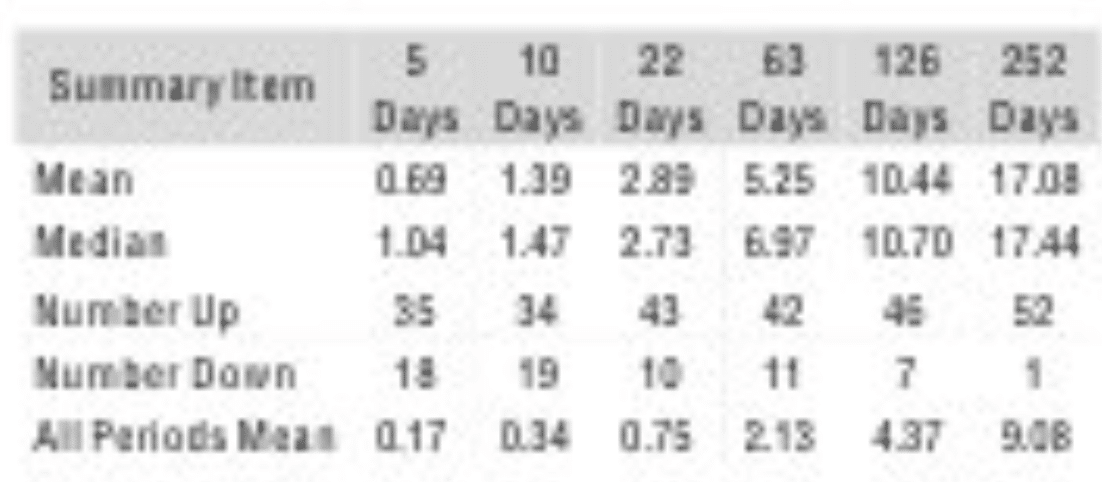
- Akin to the previously outlined breadth thrust, this one issued negative returns only once, going all the way back to 1947. The forward 12-month S&P 500 median return is roughly 17 percent.
- As a reminder, 2 weeks ago we witnessed considerable market breadth via NYSE Up Volume.
- Again, this helps us to rightly place relevance on market breadth, as a means for capital allocation decisions.
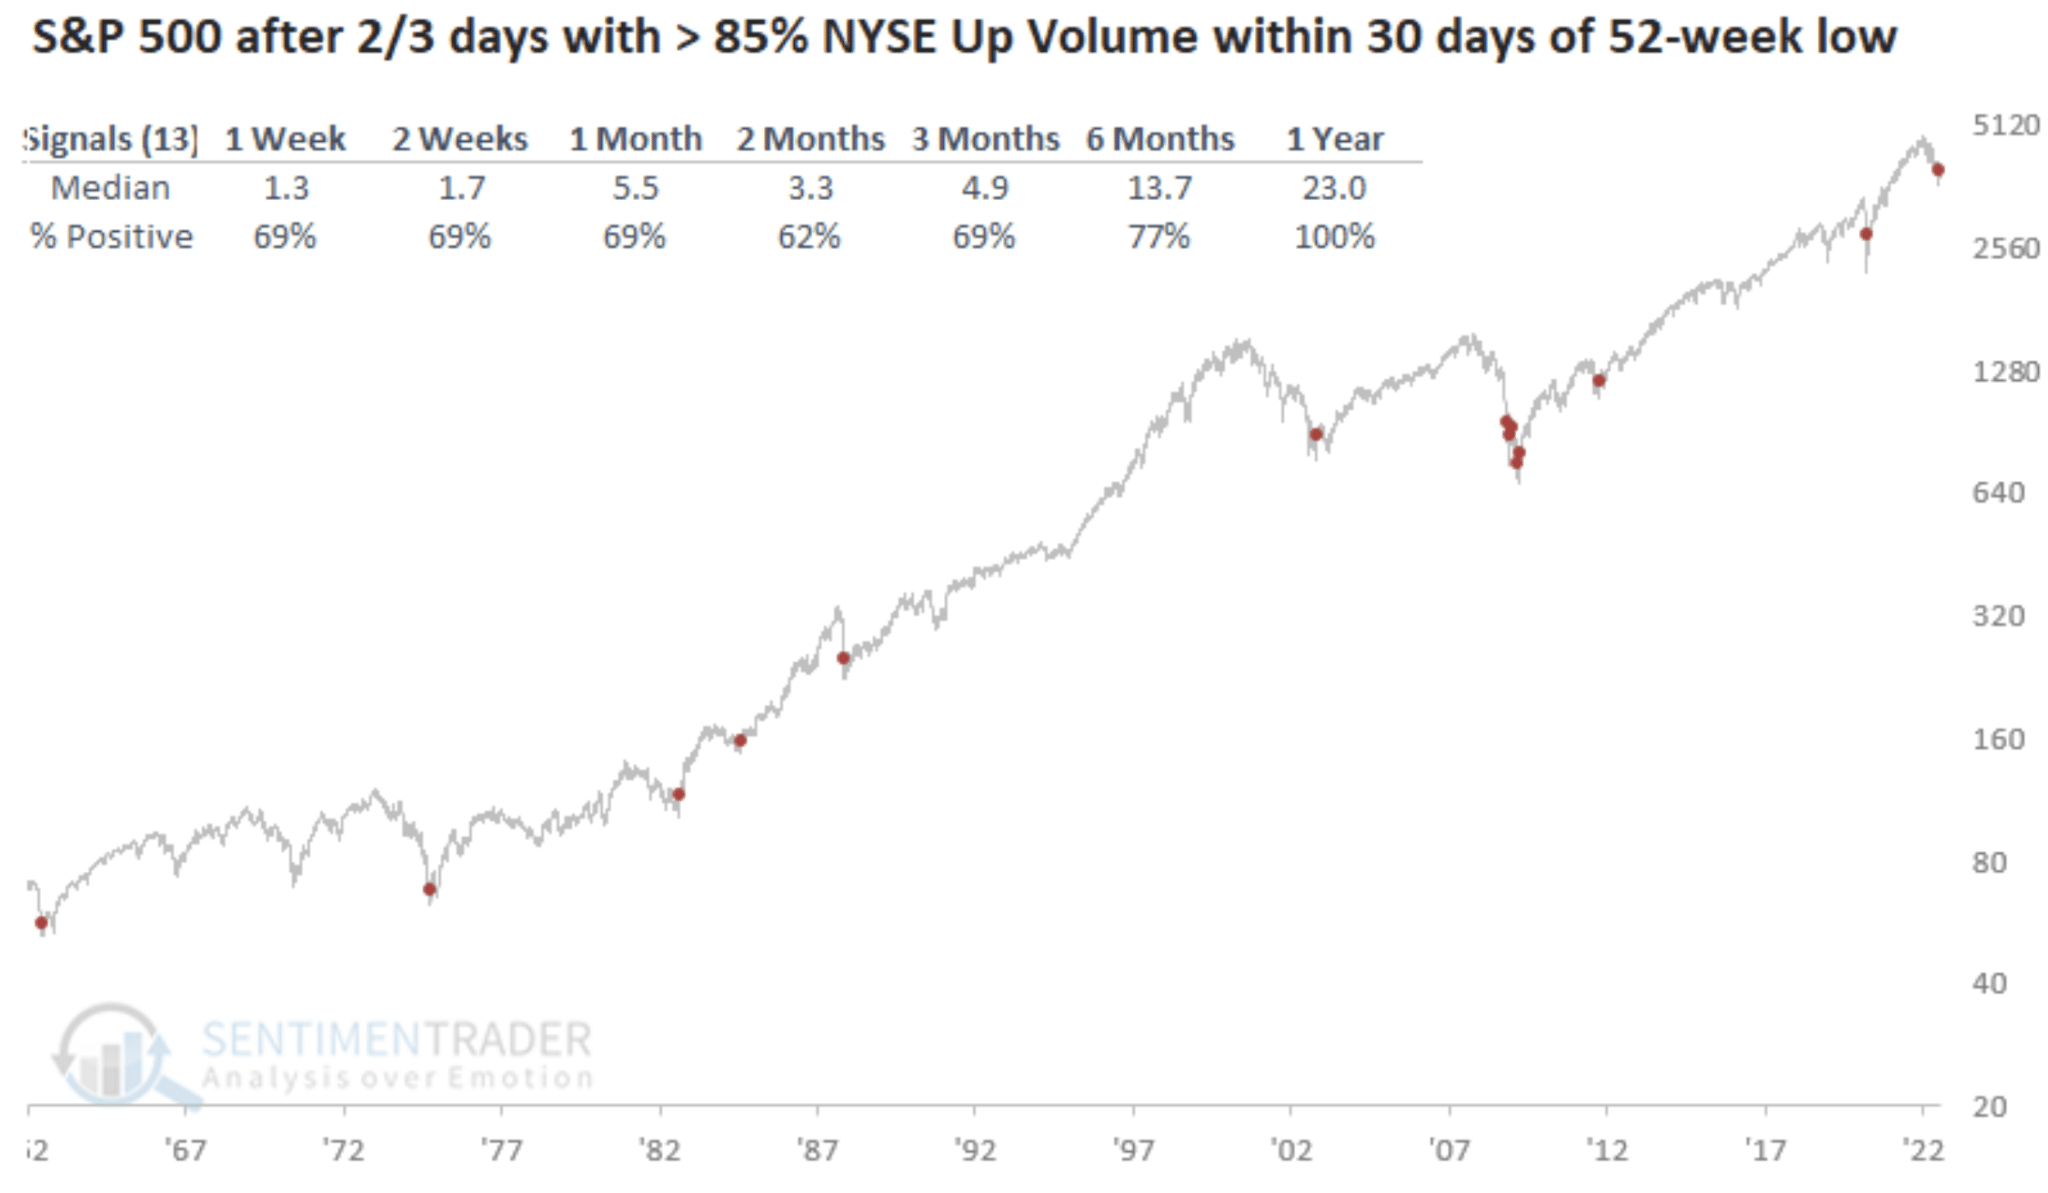
- In modern markets, the S&P 500 has never lost ground over the following year when advancing volume was 87% or more of total volume for 2 out of 3 days coming off a 52-week low. (Friday of last week and Tuesday of this week; 2/3 trading days)
- It has a perfect track record.
- The S&P 500 just posted a gain after a 2%+ up day for the first time since March.
- Pretty stark change given there were 3-4 instances earlier this year when the S&P 500 would post a 2%+ gain, only to give it all back the next day.
90%+ Up Day or 10:1 Days by Ned Davis
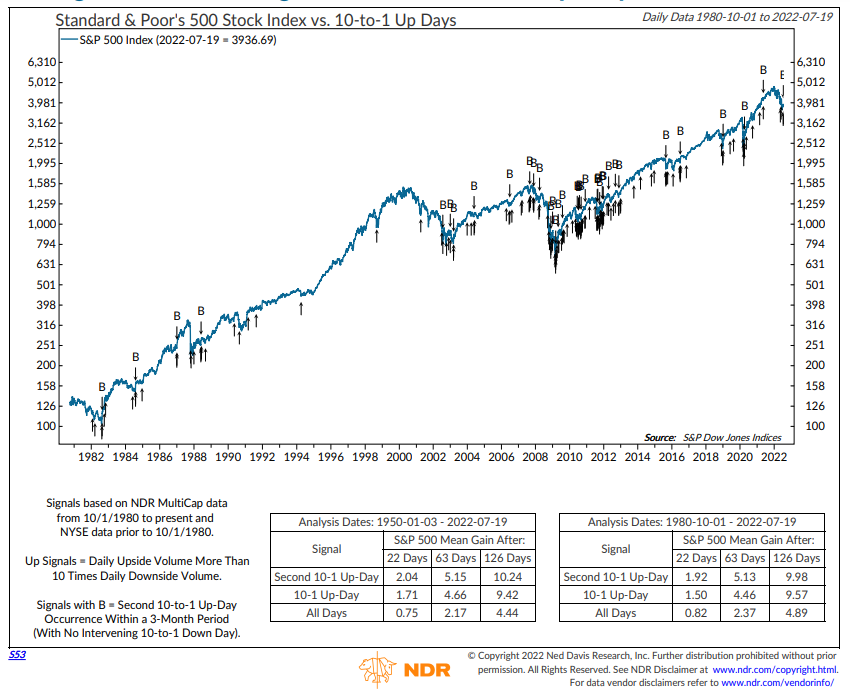
- After 2, 10:1 up days within 3 months, without a 10:1 down day in between, the S&P 500 has more than doubled its long-term average gain 1, 3, and 6 months later, on average.
- This is what a Thrust-Day looks like.
- They are buying bigly!
- Ned Davis Research

- S&P 500 has been down 15%+ in a single quarter 9 times since 1940.
- Sep.1946
- Jun. 1962
- Jun. 1970
- Sep. 1974
- Dec. 1987
- Sep. 2002
- Dec. 2008
- Mar. 2020
- Jun. 2022
- It was only negative in the next quarter 1 time. (2008)
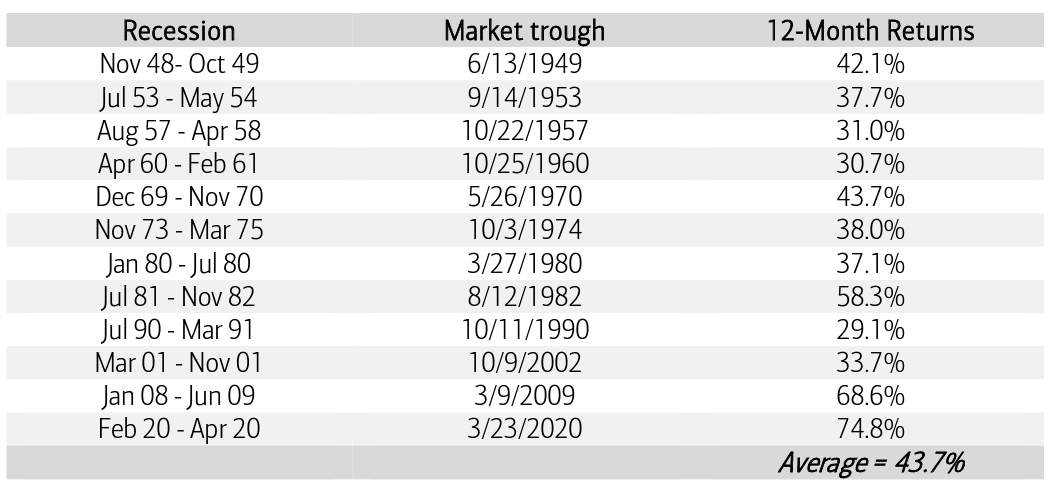
Larry Williams Cyclical Low & Retest
- One of the reasons we restarted our trading regiment in April of 2020 was because the S&P 500’s April rebound.
- From the lows, the S&P 500 rallied double-digits, signaling a new bull market.
- Since 1972, every bear market that has achieved a 50% retracement off of the lows has signaled a new bull market. Moreover, the lows were never retested.

- If it feels like this time is different, it’s not.
- The above bar chart identifies the market corrections during midterm election (in blue) years since 1962.
- The chart also shows the S&P 500’s return in the following year. Every single time, the market was higher 12 months later.
- Incredibly, the S&P 500 has been higher a year after every midterm election going as far back as 1950. That is 18 out of 18 years, with the average gain a year later a very solid 14.5%.