
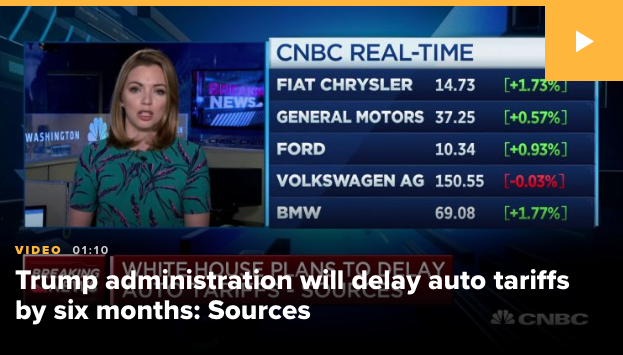
A rather unexpected scenario presented itself for investors on Tuesday, a relaxing of trade feuds and tariff expectations. It was previously anticipated that the U.S. would be making a decision on EU auto tariffs on or by May 18, this coming Saturday. On Tuesday, however, the Trump administration announced it plans to delay auto tariffs by up to six months, stopping itself for now from widening global trade disputes. Equity markets quickly reversed their early morning losses on the headline. The Dow had been lower by as much as 175 points before the headline and finished the trading day higher by over 110 points on the day.
The trend of the market presently is that there is no trend and it has become a difficult traders’ market. The whipsaws from trade headlines may be rapidly producing a “new normal” of sorts. The markets are widely constructed of algorithms and those algorithms are tuned to the key verbiage surrounding tariffs and trade.
“I can’t overemphasize the importance of this leaked news,” Cramer said. “In one fell swoop, [President Donald] Trump went from being a hated protectionist, know-nothing to someone who might be cleverly assembling a coalition of the willing in the trade war against the Chinese, at least in the eyes of Wall Street.”
In addition to the positive trade announcement with regards to EU tariff delays, the U.S. appears close to removing steel and aluminum tariffs on Canada and/or Mexico near-term. The Trump administration is nearing a deal with Canada and Mexico to remove U.S. steel and aluminum tariffs as part of discussions about a new trade agreement among the 3 countries, U.S. Treasury Secretary Steven Mnuchin said on Wednesday.
“I think we are close to an understanding with Mexico and Canada” on removing steel and aluminum tariffs, Mnuchin told a Senate appropriations subcommittee hearing. U.S. Trade Representative Robert Lighthizer is in “active discussions” over the issue, he said.
U.S. officials have insisted they will only lift the tariffs if Canada and Mexico accept quotas or other mechanisms that would avoid them becoming a conduit for cheap steel entering the U.S. from other countries including China. Both Canada and Mexico have so far resisted such a plan.
Up until Wednesday and after a nasty spill in the major indices on Monday, the economic data had a “who cares” feeling to the releases. Essentially, all eyes, ears and end-game decision making was linked to the possibility of increased tariffs on China and the ongoing trade feud. But with yesterday’s more amicable trade headlines outside of China implications, investors may become more data dependent, akin to the Fed becoming more data dependent in 2019. And with that the data came into greater focus Wednesday with several economic data releases.
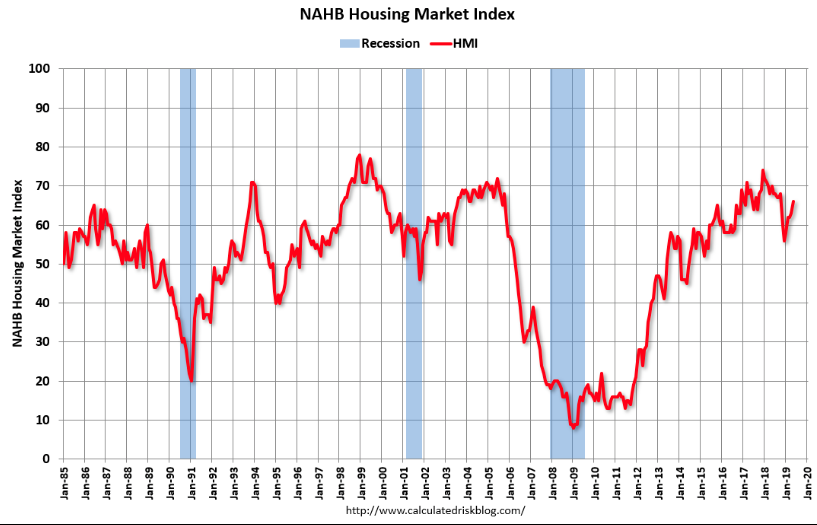
The National Association of Home Builders’ monthly confidence index jumped three points to 66 in May, the trade group said Wednesday. That was the highest reading since October.
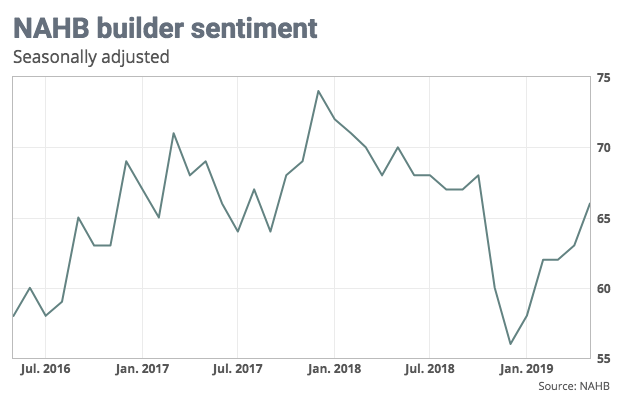
In May, the index sub-gauge that tracks current sales conditions jumped three points to 72, the component that measures expectations over the next six months ticked one point higher to 72, and the index of buyer traffic rose two points to 49.
Builder sentiment still has some ground to make up: the 2019 average for the index is 62, down sharply from 2018’s 67. Indeed, in March, builders started the fewest homes in nearly two years. The Commerce Department will report on April starts and Building Permits Wednesday.
“Builders are busy catching up after a wet winter and many characterize sales as solid, driven by improved demand and ongoing low overall supply,” said NAHB Chairman Greg Ugalde, a home builder and developer from Torrington, Conn. “However, affordability challenges persist and remain a big impediment to stronger sales.”
“Mortgage rates are hovering just above 4 percent following a challenging fourth quarter of 2018 when they peaked near 5 percent. This lower-interest rate environment, along with ongoing job growth and rising wages, is contributing to a gradual improvement in the marketplace,” said NAHB Chief Economist Robert Dietz. “At the same time, builders continue to deal with ongoing labor and lot shortages and rising material costs that are holding back supply and harming affordability.”
With housing data further in focus Wednesday, we also find the latest mortgage application data slipping on a week-to-week basis, but fairing much better than a year ago. Mortgage application volume dropped 0.6% last week from the previous week, according to the Mortgage Bankers Association’s seasonally adjusted index. Volume was 10% higher than a year ago, when interest rates were higher.
“Purchase applications declined slightly last week but still remained almost 7 percent higher than a year ago,” said Joel Kan, MBA’s Associate Vice President of Economic and Industry Forecasting. “Despite the third straight decline in mortgage rates, refinance applications decreased for the fifth time in six weeks, albeit by less than 1 percent.”
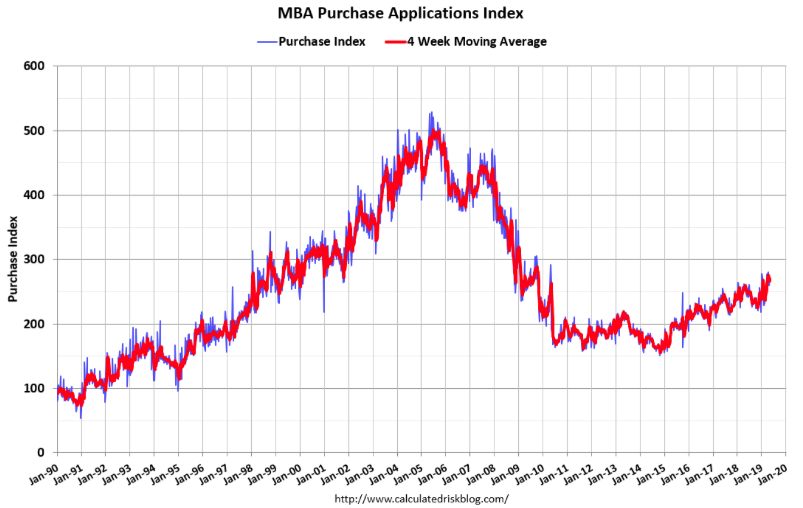
Added Kan, “It’s worth watching if ongoing global trade disputes lead to increased anxiety about the economy, which could cause some potential homebuyers to put off their home search until the uncertainty is resolved.
As noted by Joel Kan, the ongoing trade feud is seen as impacting mortgage application, even as mortgage rates continue to slide and hover around their lowest average level of 2019. Given the 10-year Treasury has only slid further in the current week, the expectation is that rates on the 30-year fix rate mortgage will continue to edge lower in the coming weeks.
The key concern surrounding the housing market remains with higher material costs that are eventually finding their way into the price of a new home, which is also incurred by new homebuyers.

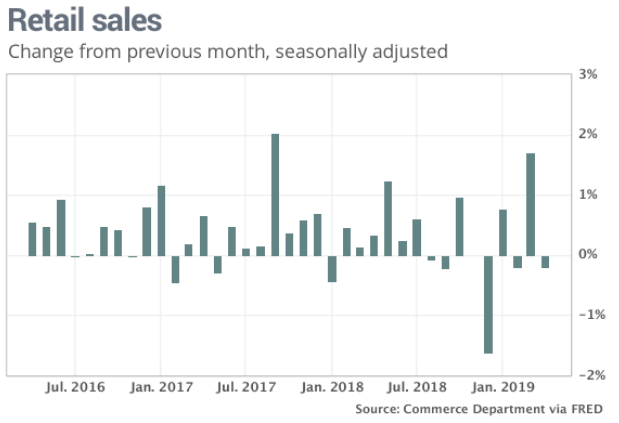
The next piece of economic data released on Wednesday was somewhat disappointing, when viewed through the most narrow and short-term lens. Sales at U.S. retailers fell in April for the second time in three months, a sign that Americans are exercising caution over how much they spend with the economy facing increased headwinds.
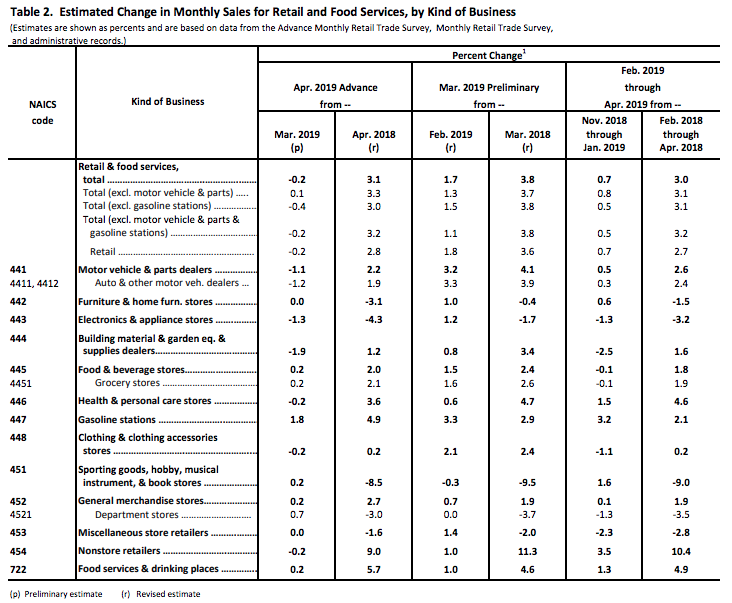
Retail sales dropped 0.2% last month, the government said Wednesday. Sales declined in most major segments including automobiles, home centers and Nonstore channels. Economists were expecting a .1% rise in retail sales. Stripping out automobiles and gas, sales also fell 0.2% to reflect broad weakness in the retail segment.
While the MoM numbers left something to be desired, the YoY growth rate for retail sales came in at a gain of 3.1%, showing continued strength in consumer spending. The following chart identifies the longer-term trend in retail sales highlighted by the smaller graph in the encapsulated 1-year chart.
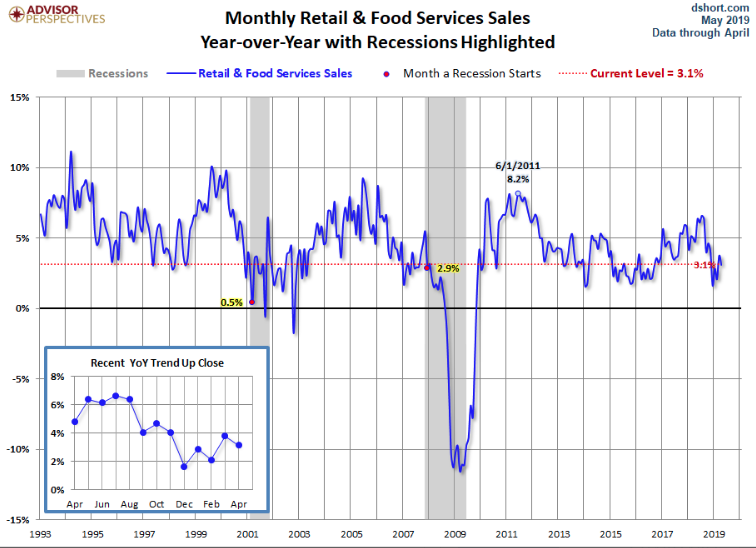
What we can see in the 1-year chart is the positive stimulus boost from tax reform in 2018, boosting GDP to above trend-growth and above trend-growth for retail sales. The economy is clearly witnessing the sugar high from last year now wearing off and the economy resuming trend-growth characteristics.
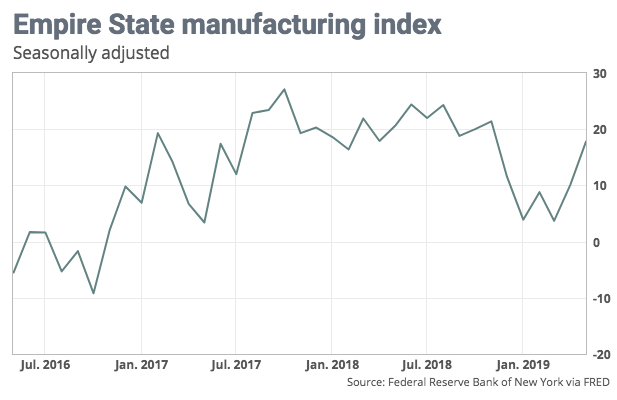
In addition to retail sales, the Empire State manufacturing index surprised to the upside, rebounding to a six-month high of 17.8 from a reading of 10.1 in April, the New York Fed announced Wednesday.
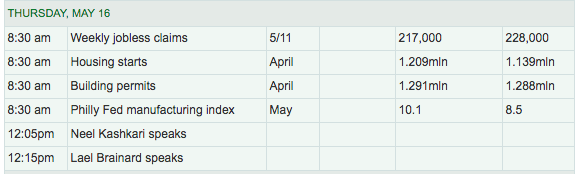
On Thursday, the economic calendar is more subdued but still found with relevant reports to be delivered as identified in the table below from MarketWatch:
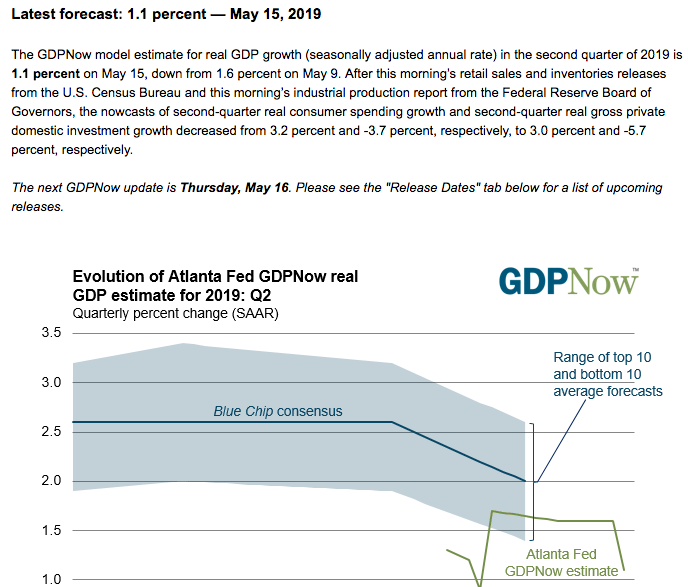
With the economic data rolling in this week, certain firms have adjusted their Q2 GDP forecast. Bank, of America Merrill Lynch: “data sliced 0.3pp from 2Q GDP tracking to 1.8%, while 1Q tracking edged down a tenth to 2.9%.” Goldman “we lowered our Q2 GDP tracking estimate by two tenths to +1.7% (qoq ar)”
The Atlanta Fed also reduced its Q2 GDP forecast sharply, as it tracks the week-by-week economic data releases.
Equity market Futures are pointing to a higher open on Wall Street and with Wal-Mart (WMT) set to report earnings results before the opening bell. With regards to what investors might expect we turn to FactSet estimates. Wal-Mart has an average overweight stock rating and average target price of $109.32, according to 31 analysts polled by FactSet.
Earnings: FactSet is guiding for earnings per share of $1.02, down from $1.14 last year. Wal-Mart has exceeded FactSet earnings expectations the last five quarters.
Sales: FactSet expects sales of $125.17 billion, up from $122.69 billion last year. Wal-Mart has missed sales expectations two out of the last eight quarters. FactSet expects same-store sales growth of 3.1%, with Wal-Mart U.S. growth at 3.4%.
Wal-Mart will report Q1 2019 results a day after Macy’s (M) turned in a mixed bag of Q1 2019 results. The department store retailer reported earnings of $.44 that beat estimates by roughly $.12 per share. But the company narrowly missed sales expectations, coming in at $5.5bn, down -.7% year-over-year. Comp sales rose by .7% YoY as well. Gross margins fell for the second straight quarter and from 39% to 38.2 percent. Higher inventory receipts were not offset by merchandise margins during the quarter. Macy’s FY19 guidance was left unchanged. Macy’s shares fell on the trading day, upon releasing results.
As investors await Wal-Mart’s Q1 2019 results, the trade war concerns remain at elevated levels, as has ben witnessed through fund flows and hedging activity over the last 9 trading days. This has resulted in the cost of hedging becoming imprudent and expensive.

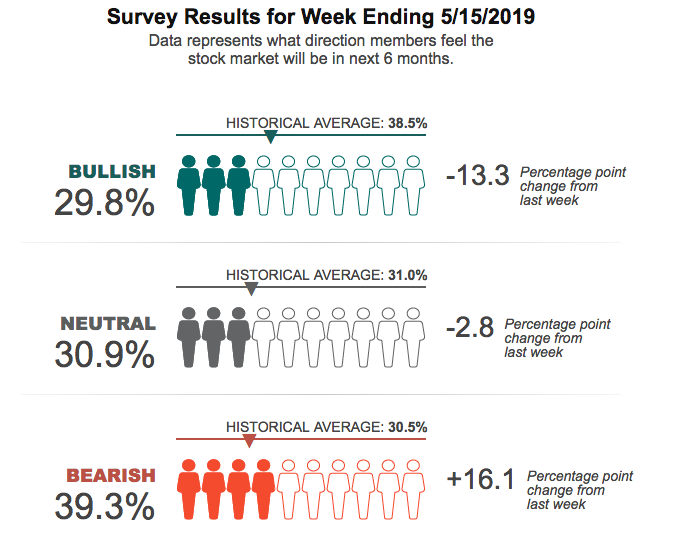
The side effect of the recent stock market decline has also found its way into the latest AAII survey results, which show a sharp decline in bullish market sentiment.
With a 2-day rally in place and what appears to be another S&P 500 rally on Thursday in the premarket, the S&P 500 is aiming to reach back above its 50-DMA.
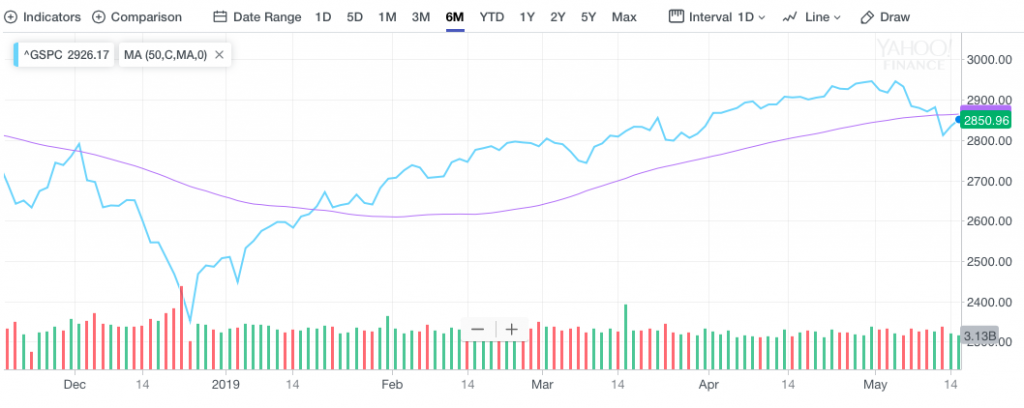
It remains to be seen if the S&P 500 can achieve this feat of strength today and can finish above the 50-DMA for the week. As a reminder, the weekly expected move for the S&P 500 is $34/points, which had already been achieved and breached to the lower bounds on Monday.
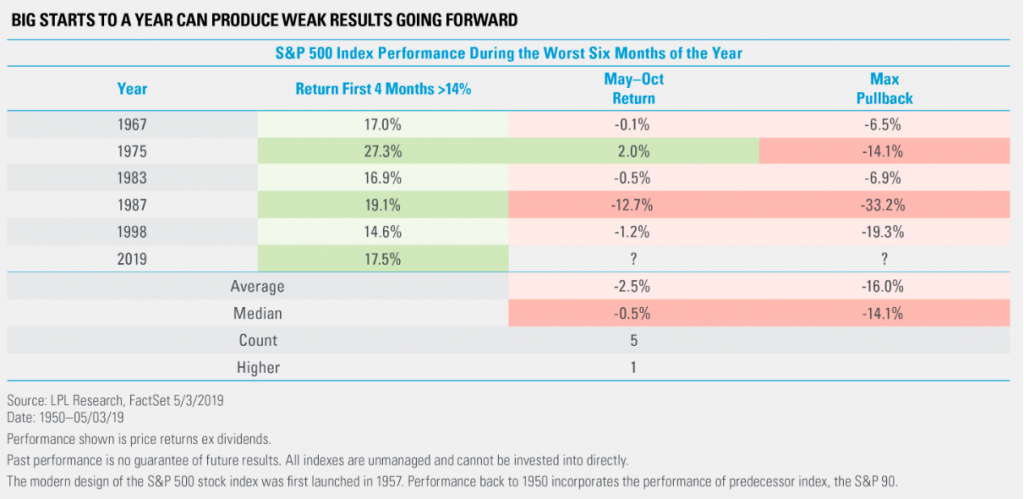
With respect to the upheaval in equity markets of late, investors/traders would be well serviced to rationalize the downturn within its historical context. This has been on of the best starts to a year ever for equities, which historically has led to modest returns the next six months, with an above average chance of a large correction.
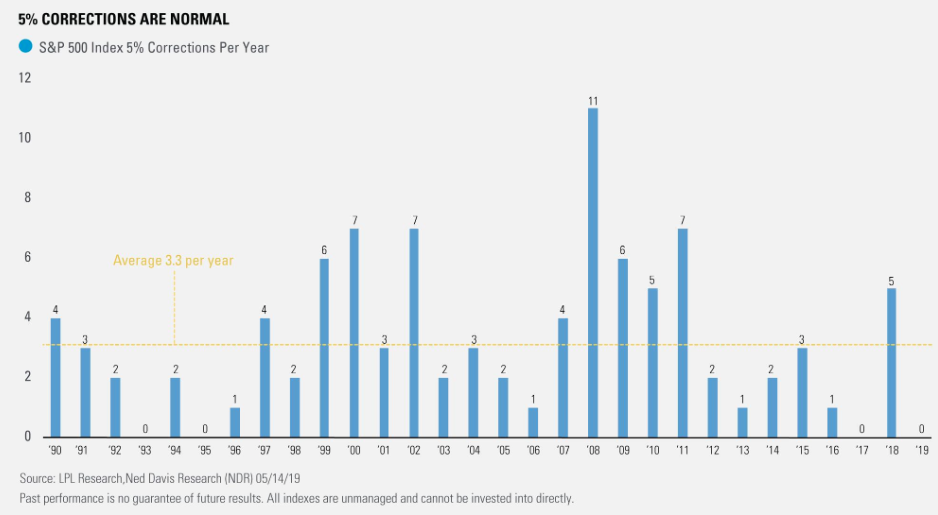
As the LPL Financial chart below shows, there has been an average of more than three separate 5% declines for the S&P 500 per year going back to 1990. Given there hasn’t been a 5% pullback yet this year, investors/traders should consider the odds are quite strong that we see multiple 5% drops the rest of this year as the economic cycle ages and volatility picks up. Of course, history doesn’t always repeat itself, but setting forth expectations and plans can level set the emotional psyche of a trader should such drawdowns come to pass.
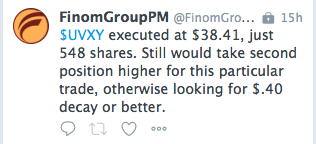
With that being said, done and put forth, Finom Group continues to trade what the market delivers, defining risk as the market ebbs and flows. Yesterday’s trade alert to our Premium Members resulted in another short-VOL, profitable trade as depicted in the following screenshots from our private Twitter feed. (Premium Membership access)

Subscribe today and access all of Finom Group’s weekly Research Reports, our Live Daily Trading Room, our Forums and our profitable Trade Alerts/Investment Thesis. Happy trading to all!


