
The S&P 500 (SPX) hasn’t been down more than 0.7% on the first trading day of December since 2008. And then came December 2019, whereby the benchmark index fell by more than .85% on the first trading day of December for the calendar year. So what caused the market hiccup on December 2, 2019 that came to pass in an otherwise remarkably strong uptrend for the better part of 2019? We can propose any number of reasons to validate all 3 major indices falling prey to selling pressure and can just as easily suggest there is no single reason at all. How so you might be asking? Well, let’s take a look back at the day that was and what proved the strongest down day for the major averages in the last couple of months.
What made the first trading day of December 2019 that much more ominous is not only the heights for which the market had climbed, but the significant pre-market/futures reversal ahead of the opening bell on Wall Street. Equity futures were up more than 140 points for the Dow Futures before U.S. President Trump announced that the Administration would be imposing tariffs on steel and aluminum products from Argentina and Brazil. Finom Group has often said and repeats that the market cares not against or in favor of a trade deal with China or any other nation. What it cares mostly for is the imposition of tariffs. Regardless of the negative headlines surrounding the probability of a trade deal with China, the market has done little less than achieved record high levels. It’s only when tariffs are imposed, be them on China or other nations, that markets spasm. December 2nd was just another validation or evidence of the aforementioned assertion on trade relations and market correlated moves. No trade deal, don’t care! Imposing tariffs, market spasm!
“Brazil and Argentina have been presiding over a massive devaluation of their currencies, which is not good for our farmers. Therefore, effective immediately, I will restore the Tariffs on all Steel & Aluminum that is shipped into the U.S. from those countries.”
The immediate announcement of tariffs sparked a complete reversal in the equity futures market. As such, we can certainly suggest the market did not treat the announcement favorably. But was this really the reason for the markets declining on the first trading day of December 2019? After all, if the market really valued this tariff imposition and found it a factor that would damage the macro-outlook and general economic outlook for the United States, would bonds have moved higher, as investors sought the safe haven asset class? That didn’t happen at all on Monday for U.S. treasuries. Moreover, the precious metals complex and namely Gold was also bid slightly lower on Monday and after the tariff announcement. Gold is usually a safe haven asset that investors flee to when fear is looming and uncertainty surrounding the economic outlook is found populating. Sooo…?
When U.S. indices opened for trading, they opened lower, but only modestly. Shortly after the opening bell rang, the ISM Manufacturing Index was released and found wanting for improvement that didn’t arrive in the month of November. The Institute for Supply Management said its manufacturing index fell to 48.1% in November from 48.3% in October. Economists surveyed by MarketWatch had forecast the index would register a reading of 49.2 percent.

This is the fourth straight sub-50 reading. Readings below 50% indicate business conditions are getting worse. The key new orders index dipped to 47.2 from 49.1 in October. Orders haven’t been below this level since April 2009. Inventories dropped to a 42-month low as well, which actually drove an improvement in the orders/inventory ratio.
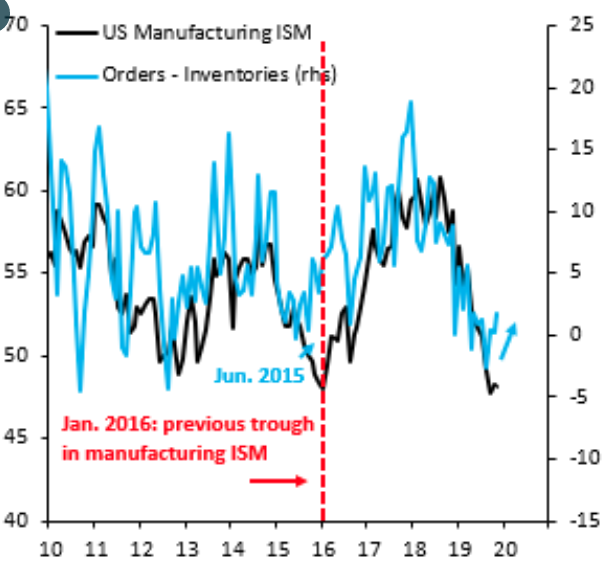
This is probably the key ratio or metric to monitor during the trade war period, as it denotes a reduction and/or bottoming of the inventory overhang that has been present since the start of the trade war. Orders/inventories are rising, with the improvement driven by inventories, as depicted in the chart above from Robin Brooks (lhs, blue). The inventory overhang has largely played out.
Aside from the ISM Manufacturing Index Monday was the release of the Markit PMI data that, unlike it’s peer manufacturing index, showed a MoM improvement. The IHS Markit PMI survey registered 52.6 in November, up from the previous month’s reading of 52.2.
These two business surveys sent conflicting signals on the health of the U.S. manufacturing sector since September 2019. But dig deeper and the survey divergences can be explained, says Chris Williamson, Chief Business Economist at IHS Markit.
“Our analysis highlights how the IHS Markit PMI has outperformed the ISM survey in providing more accurate indications of actual manufacturing trends in recent years,” he says, “most likely due to differences in panel structure and questionnaire design.
Both surveys use diffusion indices whereby 50 denotes no change on the previous month. Both headline PMIs are also composite indicators derived from five individual survey questions relating to output, new orders, employment, inventories and suppliers’ delivery times.
Note however that ISM uses a straight average of its five components whereas IHS Markit uses a system such that forward-looking components carry a higher weight. These weights can therefore lead to divergences between the two PMIs.
Regardless of which survey is more accurate than the other, the market took a decisive leg lower after the release of the ISM Manufacturing Index was released. So was this the reason for the market selloff on December 2, 2019? Seems to be, but again we refer to the fact that safe haven assets didn’t respond to what the equity market was found responding.
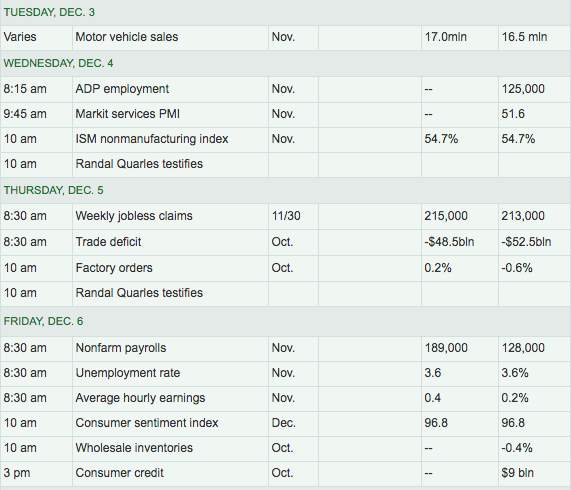
Economic data will continue to rollout through the trading week and culminate with a key gauge of the strength or weakness on the economy delivered Friday. The BLS will release the monthly Nonfarm Payroll report on Friday, which is expected to show significant improvement from the previous, October reading on job creation.
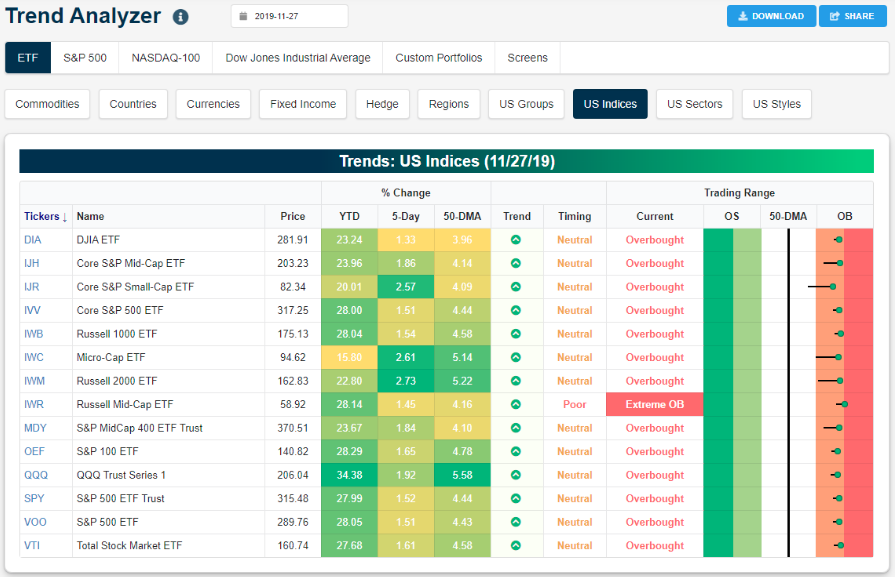
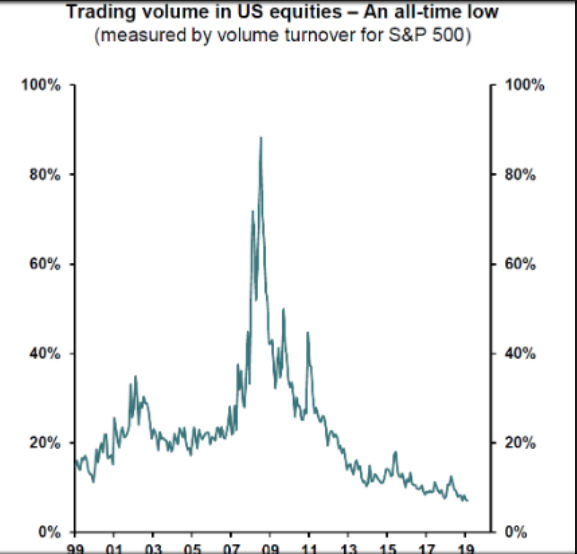
We can certainly ponder the question of why the market actually succumb to selling pressure on Monday through the remainder of the trading week and contemplate any number of reasons. Sometimes, yes sometimes there’s no real reason for a market to drawdown, but rather excuses. The aforementioned reasonable means for the market’s reaction may have simply provided the market a natural excuse to selloff. Keep in mind, the market has been in overbought, frothy territory for the last several weeks. The CNN Fear & Greed Index had been found in “Extreme Greed” territory for the last 2 weeks and all index ETF’s have been in Overbought territory for the same duration.
When markets are this overbought, found with extremely positive sentiment and with near-term outlooks that are increasingly revised more positively, all the market needs is an excuse to selloff.
FUNDSTRAT: “.. we are now starting to suspect that the highs of the year (3,200 or 3,300?) might take place soon, like in the next week or so. Our conviction is not high on this, .. but [we] suspect this could be the high for the year.”
Anything that can be perceived as a negative will be found reason enough by investors who aim to lock-in profits, as equity indices have achieved numerous record highs through the month of November. The market received enough excuses to selloff on Monday, least of all was the unheralded 100% gain in the S&P 500. 100% gain in the S&P 500?? Yes, 100% gain in the S&P 500!
If you still don’t believe algorithms play a significant role in the markets, listen up! During Monday’s drawdown, the bulls actually won a battle. Algorithms are very tuned to technical levels and gap fills are a favorite algorithmic tune! The S&P 500 had created a gap up on November 25, 2019 from 3,111. It took a millisecond for the S&P 500 to go from 3,117 down to 3,111 on Monday, filling the aforementioned gap before bouncing thereafter.
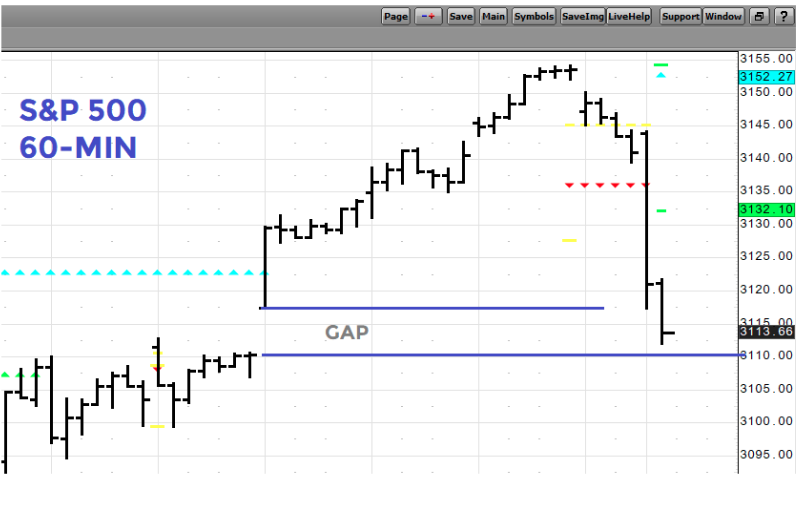
And now let’s refer to the prior statement of the 100% gain for the S&P 500. The S&P 500 peaked in 2007 at 1,576.09. A 100% move from 1,576.09 puts the S&P 500 at 3,152.18. The S&P 500 record high was achieved at 3,154.26 in November, a roughly 100% advance. Algorithms love levels and round numbers folks, algorithms!
Can we example a time when the market was very overbought, so overbought that a simple prediction for the future of the market brought about a market hiccup? Absolutely we can provide such an example. Let’s harken back to 2017 for more recent example and when the VIX spiked more than 30% in a single trading day.
On August 8, 2017, Doubline Capital’s billionaire bond fund manager Jeffrey Gundlach was interviewed, live and on-air by CNBC. He called for the VIX to double and outlined that he had bought .SPX puts.
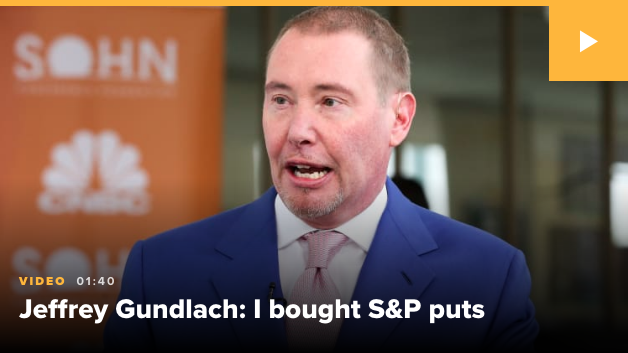
“I think going long the VIX is really sort of free money at a 9.80 VIX level today,” Gundlach said. “I believe the market will drop 3 percent at a minimum sometime between now and December. And when it does I don’t think the VIX will be at 10.”
Gundlach was wrong on both calls, for the SPX puts and VIX prediction. The S&P 500 did not have a 3% decline at any point in 2017 and it actually surged through the entirety of December with the VIX actually falling below 10, again in December 2017. Nonetheless, the day of this interview on CNBC, the market did fall based on this bet and VIX forecast dissemination. The market was quite frothy ahead of the August interview with Gundlach. In fact, from April to August, the S&P 500 had tacked on 162 points or nearly 6% without a pullback of even 1.5% in between. Again, the market just needed an excuse back then to work off some of the frothiness, as it does presently. Did Gundlach’s bets, which failed to generate the predicted outcome, change the macro-outlook or earnings outlook? Nope! Nonetheless, markets were frothy and used the highly recognized Gundlach reputation and bet as an excuse to work off overbought conditions. The VIX spiked just over 30% then while the VIX spiked roughly 18% on Monday’s market drawdown. Trade feuds do have a more macroeconomic impact than a bond fund manager’s bet on the market and yet the market had a less volatile reaction to trade headlines on Monday? Does that fit with the narrative suggesting the market was solely reacting to trade headlines, tariff imposition or the weak ISM Manufacturing Index to boot? Excuses and algorithms folks, excuses and algorithms!
And the algorithms seem to be triggered again on Tuesday with the latest trade headlines coming out from a meeting with NATO members in London.
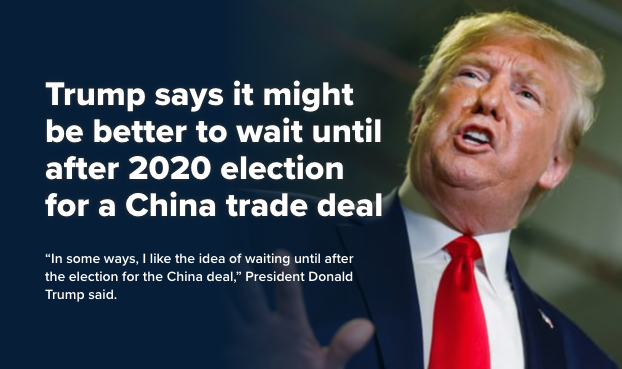
“In some ways, I like the idea of waiting until after the election for the China deal, but they want to make a deal now and we will see whether or not the deal is going to be right,” Trump told reporters in London. The U.S. general election is set to take place in November 2020.
This is only the 100th (probably a low estimate) time the President has offered this statement and more often than not the market has shrugged off the deal postponement. Nonetheless, this time the equity futures have once again reversed early market gains in favor of a sharp down turn for a second consecutive day. “But the last time he said this the market had no negative response.” It’s the difference between overbought conditions, risk/reward potential and algorithms already set in motion to complete a task in an otherwise illiquid marketplace absent volume.
Wow, this doesn’t sound terribly optimistic near-term now does it? Admittedly, it doesn’t. But we wouldn’t consider the near-term weakness an opportunity for longer-term investing. The questions investors might ask themselves is whether or not the macro-outlook has changed based on any of the economic data delivered or the headlines surrounding trade.
Finom Group is of the opinion that the only things that would change the macro-outlook would be an escalation of the U.S./China trade war through the imposition of December 15, 2019 tariffs. Kind of a looming deadline outlined previously by the White House Administration. Reason enough for the near-term market weakness as investors take precautionary measures; don’t ya think?
We’re not of the opinion the December tariffs will be implemented, as such tariffs are aimed squarely on consumer packaged goods. U.S. corporations would be forced to either absorb the impact of the tariffs that would otherwise dent sales and/or profits or they will have to pass along the cost increase from said tariffs to the consumer, which would also likely curtail demand that would otherwise dent sales and/or profits. There’s no good outcome for the U.S. economy in either scenario mentioned. This is the calculus we believe the White House Administration understands and why simply kicking the can down the road is the optimal approach and in keeping with the President’s continued remarks on the timeline for achieving a trade deal. Having said that, there are no guarantees that the seemingly impetuous President won’t make a errand decision with regards to the December 15th tariff deadline.
CNBC’s Mad Money host Jim Cramer isn’t terribly optimistic on the market or the President’s near-term decision on the aforementioned tariff deadline. On his Monday evening show, Cramer discussed the probability for the market downturn to continue with the VIX continuing to move higher, as investors seek to cushion their portfolio from the potential market fallout from trade headlines and the relieving of overbought conditions.
“The charts as interpreted by Larry Williams suggest that the market’s animal spirits are turning from bullish to bearish, at least for the next few months, and he thinks you should try to sidestep the pain here.
Right now, based on the volatility cycle, he’s anticipating a sustained upturn in the VIX, which tends to be very bad for the S&P 500. Based on his forecast, the volatility index should keep rising through Feb. 11. In other words, investors are starting to turn bearish here, and Williams expects them to stay that way for the next couple of months.”
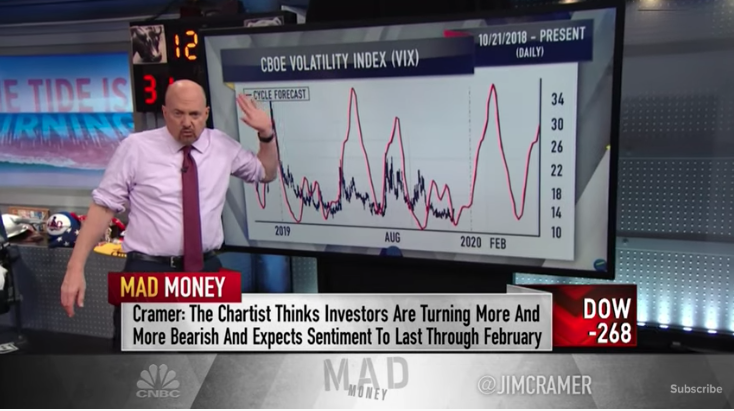
Williams, Cramer said, also projected that the S&P 500 could undergo tough trading during much of the first quarter of 2020. He used the Dollar Index, which compares the strength of the U.S. currency to foreign money, as a stock price indicator to forecast a downward trend in equities.
“Based on his cycle forecast, you’d expect the S&P to peak right about now. The strongest short-term cycle here has lasted for about 80 days, and it suggests the market will be under pressure through the beginning of March.
We could have one more bounce before the negativity fully takes over, but he thinks you should use any strength to ring the register. I agree with him that we were due for a shakeout … and since I expect the president to raise his tariffs on China in two weeks, it might take a little while for the pain to unfold.”
Doesn’t sound good does it, and Cramer has a pretty vast audience to boot. While he leans on other experts who like Jeffrey Gundlach, have wins and losses or achieved and failed predictions, others offer a different outlook on the near-term weakness in equity markets. Jeff Saut of Capital Wealth Planning, a frequent guest on CNBC offered the following remarks during the markets’ downturn Monday:
“Tis the season for buying opportunities! The recent pullback in equity markets has created an opening for investors to buy some stocks at a value. I think you’re getting an early Christmas gift with this sell-off right here on Friday and today.”
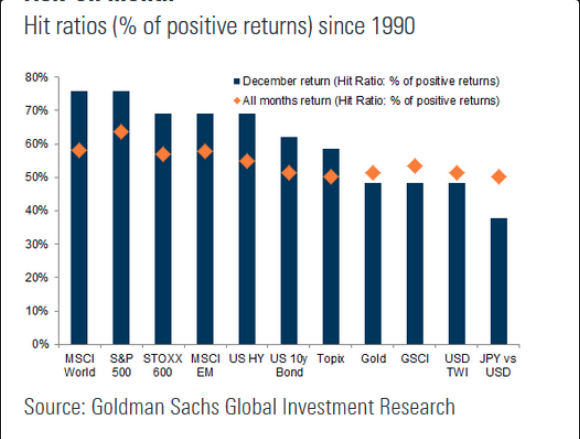
Historically, December has been the strongest trading month of the year, but last year the S&P 500 sank more than 9% during the final month. But the market has expressed a 2019 rally, with the S&P up around 24% year to date.
Jeff Saut said that he believes the market can continue to rise in December, even if a phase-one trade deal between the U.S. and China is not struck. In fact, he said he doesn’t think there will be a deal by the end of the year, arguing the talks have “hit a stall” due to President Donald Trump signing laws in support of the Hong Kong protesters.


