
Currency devaluation, purposeful or not, causes panic around the world. We’ve seen such concerns regarding the devaluation of the Chinese yuan in recent months. Such devaluation causes imbalances in trade and hyperinflation possibilities, otherwise making it more difficult for the correlated debt of the currency to be repaid. Therefore, contagion concerns spread from the currency under pressure outward. This was largely the reason behind global equity market declines on Friday, even as the U.S. has negligible exposure risk to the Turkish lira or its national debt.
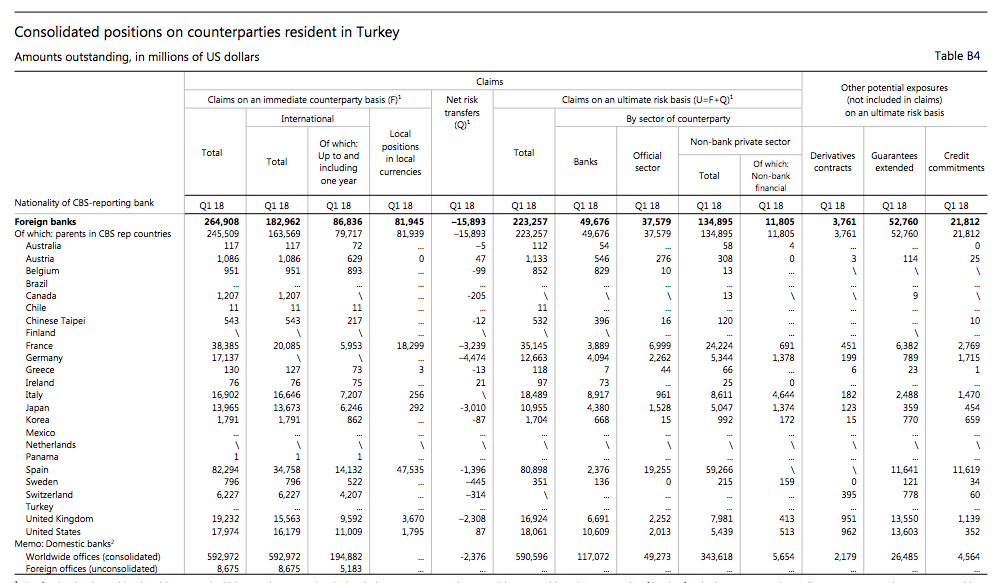
In terms of U.S. exposure to the Turkish “crisis”, the BIS cross-border figures also show that Japanese banks are owed $14 billion, U.K. lenders $19.2 billion and the United States about $18 billion.
There really is no significant risk to the U.S. economy or financials as it pertains to the Turkish fall-out. Given the discussion concerning Turkey, Friday’s market sell-off and currencies let us now take a look at the USD. It’s no secret that the USD has become a safe haven instrument in 2018 and as emerging markets have faltered to one degree or another.
The bottom line is that central banks have been withdrawing from their Quantitative Easing programs and easy monetary policies. This has not only created less liquidity in the global markets, but also found investors returning capital to safe haven instruments such as the USD. The U.S. Dollar Index has broken out from its resistance due to the weakness in foreign currencies and foreign stocks.
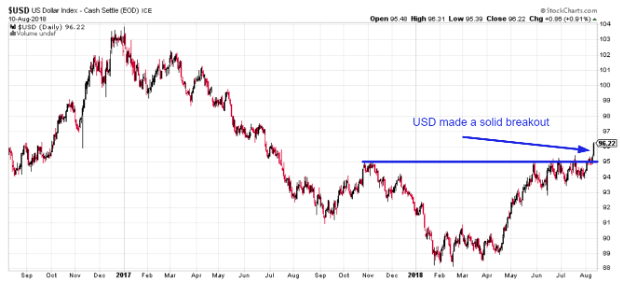
The U.S. Dollar’s weekly RSI is now at 69. So what does this currency devaluation around the globe and USD appreciation mean for U.S. equities you might be asking yourself? A rising U.S. Dollar is not consistently bearish for the U.S. stock market, as shown in a recent study by Troy Bombardia of Bullmarkets.com.
“Contrary to what financial media would have you believe, “contagion” from emerging markets to the U.S. stock market is unlikely. The financial media always seems to be afraid of “contagion”. For every 10 of these fears, contagion actually occurs 1 in 10 times (i.e. a 10% accuracy rate). Don’t bet on low probability events.”
Here’s what happens next to the S&P 500 when the USD Index’s 14 weekly RSI exceeds 69 for the first time in 1 year.
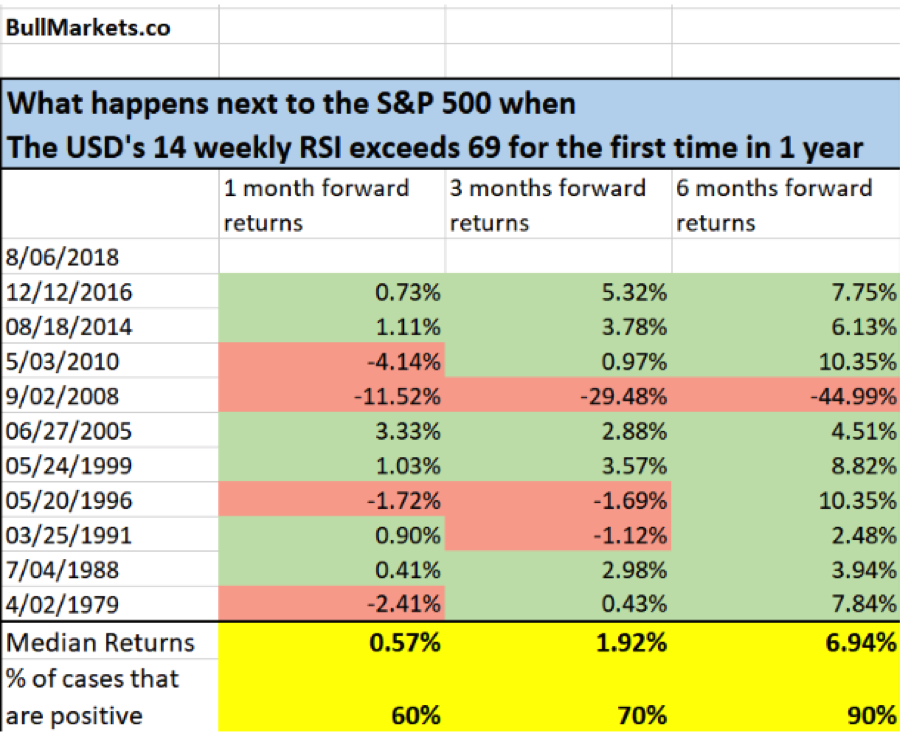
We can clearly see in the table above that the S&P 500 has a greater chance of rising than falling due to the strength of the USD going forward. More importantly, for longer-term investors, when we expand the time horizon beyond 3 months, the median return is relatively strong at nearly 7% for the S&P 500.
With that said let us look at what may correlate to the S&P 500 moves in the coming week. Firstly, we take a look at last week’s Put/Call ratio, which spiked to 120% on Friday. (See chart below depicting Put/Call ratio and correlated move in SPX underneath. The far right side of the chart identifies Friday’s spike to 120% and subsequent SPX decline)
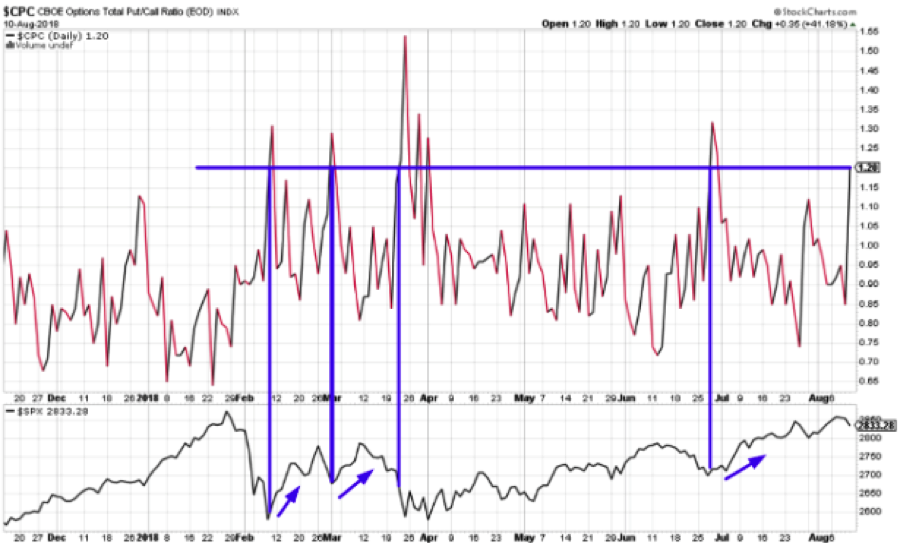
Interestingly enough, what we come to understand is that the spike in the Put/Call ratio is also coming with a lesser decline in the SPX. This can be correlated to subdued market volatility over the last several months. The SPX is actually falling less, but calculating greater fear that ultimately needs to be reconciled. As such, it’s likely that we can draw a conclusion based on the chart and YTD Put/Call ratio spike that occurred Friday. Year-to-date in 2018, the stock market was either at a short-term bottom or close to making a short-term bottom when the Put/Call ratio reached 120 percent, as shown in the chart above.
Moreover, last week’s expected move for the S&P 500 was roughly $28. That’s comparatively small vs. previous weeks. Nonetheless traders are definitively looking for a much larger move this week, a move of roughly $42 in the S&P 500.
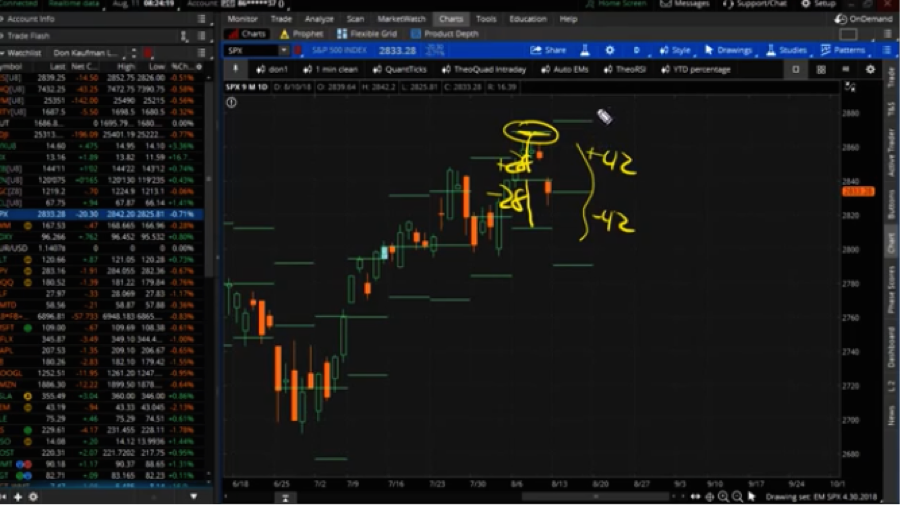
The expected move takes the SPX to roughly 2,875 or around 2,790 on the downside. Again, this expected move for the coming week is rather sizable and will either be found with increased or decreased volatility depending on the rapidity of the move or how the move occurs.
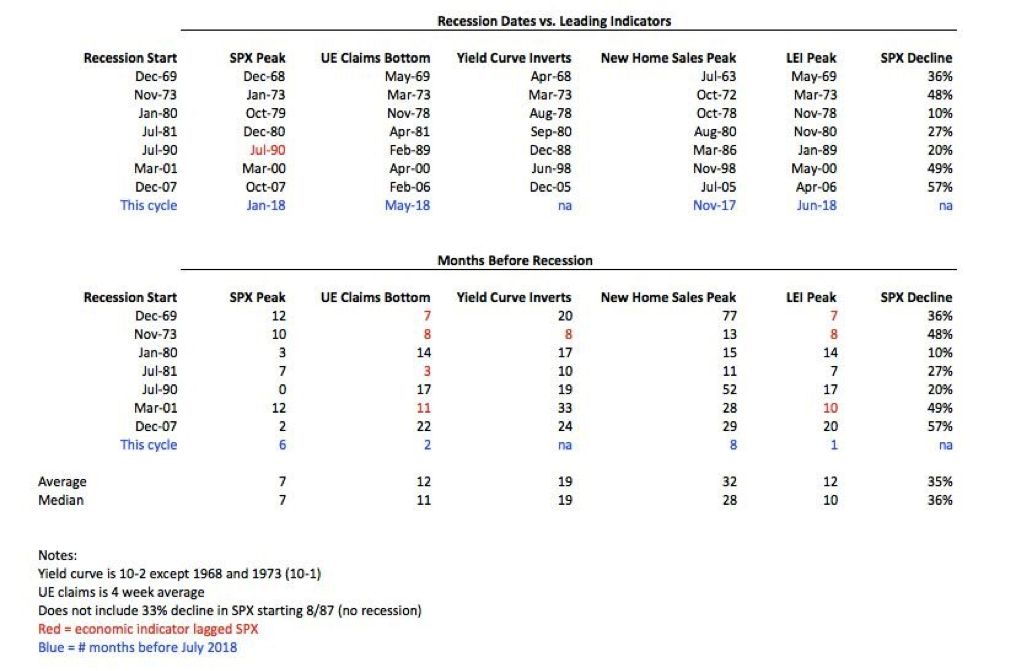
This coming week’s economic data is hopefully found with consistently improving economic conditions. Some of the latest economic data has shown signs of weakness outside of the labor market. Last week’s jobless claims report showed that claims fell from 219,000 to 213,000, another strong report. Given the strength of the labor market, highlighted by jobless claims, we can accept that a recession is not imminent. The table below (compiled by John Galt of TheoTrade) looks at the troughs in a few indicators to determine the current recession risk. The S&P 500 and unemployment claims are in the leading indicator series, so there is some overlap in those metrics. None of the leading indicators presently forecast a near term recession.
This coming week, investors will be bombarded with more economic data of relevance. Some of the more important pieces of economic data for the week will come via retail sales. Retail sales (July), productivity (2Q18, preliminary), industrial production (July) and the NAHB housing market index (Aug) are on tap Wednesday.
With retail sales accelerating and the labor market expanding, two of the greatest components of the U.S. economy are on sound footing. On Friday, we’ll get a reading on consumer confidence as well as the latest reading on Leading Economic Indicators.
The coming week will also be highlighted by retail reports from the likes of Wal-Mart (WMT), J.C. Penney (JCP), Macy’s (M) and Home Depot (HD) just to name a few. The biggest tech name to report this coming week will be Nvidia (NVDA).

Despite the retracement in equities last week and the subsequent volatility surge to end the week, Finom Group remains constructive on the S&P 500 for the remainder of 2018. Several tailwinds for the S&P 500 persisting include:
- Strong economic activity resulting in above 2.75% annualized GDP.
- A strengthened labor market with record low levels of unemployment, sub 4% presently.
- Consumer spending rising across multiple facets of the economy and more resoundingly in retail sales.
- Subdued inflation even as rates rise nearer to the Fed’s neutral target rate.
- Wages rising modestly.
- Corporate earnings growth accelerating YOY alongside accelerating net profit growth
- Record level buybacks announced
As we highlight the record level of buybacks being announced, here’s a really interesting chart from Driehaus Capital.
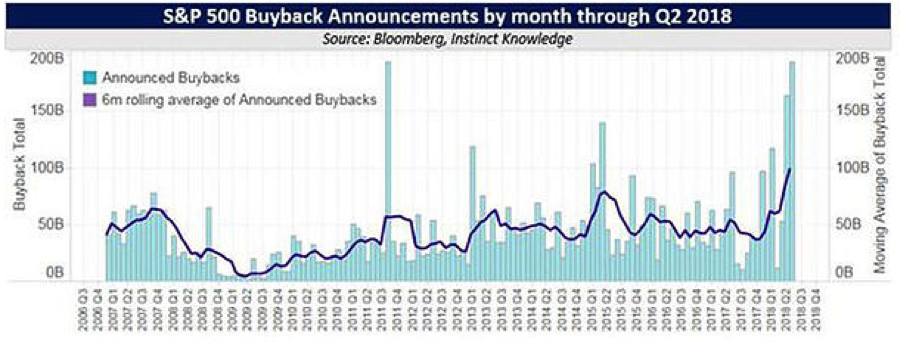
The chart shows the pace of buyback announcements for the S&P500 and the last two quarters have seen a surge in buyback announcements. While buybacks are a strong tailwind for the markets, investors still need to consider the liquidity risk to the market longer-term and due to large outflows from mutual funds in 2018.
We remain of the opinion that August and September will prove turbulent for the market, but ultimately give way to both economic and corporate fundamentals, which are improving. As such, Finom Group will look for opportunities to deploy capital. We believe the ultimate guidance for markets comes from corporate earnings and those earnings are strengthening week-to-week and year-over-year. The latest Thomson Reuters forecast for Q2 2018 S&P 500 earnings shows a near 1-percentage point leap in the firm’s forecast.
Aggregate Estimates and Revisions
- Second quarter earnings are expected to increase 24.4% from Q2 2017. Excluding the energy sector, the earnings growth estimate declines to 21.3%.
- Of the 454 companies in the S&P 500 that have reported earnings to date for Q2 2018, 78.9% have reported earnings above analyst expectations. This is above the long-term average of 64% and above the average over the past four quarters of 75%.
- Second quarter revenue is expected to increase 9.3% from Q2 2017. Excluding the energy sector, the revenue growth estimate declines to 8.2%.
- 3% of companies have reported Q2 2018 revenue above analyst expectations. This is above the long-term average of 60% and below the average over the past four quarters of 72%.
- For Q3 2018, there have been 53 negative EPS preannouncements issued by S&P 500 corporations compared to 28 positive, which results in an N/P ratio of 1.9 for the S&P 500 Index.
- The forward four-quarter (3Q18 – 2Q19) P/E ratio for the S&P 500 is 16.9.
- During the week of Aug. 13, 14 S&P 500 companies are expected to report quarterly earnings.
As Ed Yardeni of Yardeni Research recently noted: “Positive economic signs keeping investors on a straight, though narrower, path.”


