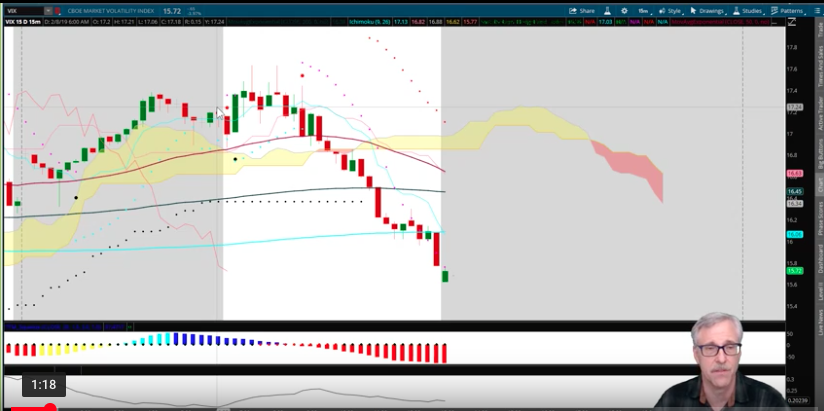
If all that you paid attention to on Tuesday was the S&P 500 (SPX) moving above and closing just above its 200-DMA, that might be a good thing. Why do we suggest that? Most plainly, some of the trickling economic data isn’t in keeping with the market’s move higher. Nonetheless, the S&P 500 closing above it’s 200-DMA is a strong achievement in and of itself. The milestone was also achieved with President Donald Trump suggesting that he doesn’t like the bipartisan continuing resolution to fund the government.
“The answer is no. … I’m not happy” about the agreement, Trump said during a Cabinet meeting. However, he added, “I don’t think you’re going to see a shutdown.”
Whether or not President Trump signs the deal by Friday remains a wildcard, but the market is of the opinion he will as it proves politically expedient and appropriate. Regardless of the uncertainty, the market rallied significantly on Tuesday and is looking to move higher on Wednesday with equity futures higher in the 6:00 a.m. EST hour.
Statistically speaking, here’s what happens next to the S&P 500 when it breaks out above its 200-DMA and after being more than -14% below its 200-DMA sometime over the past 3 months.

With a focus on the table above from BullMarkets.co and a long-term perspective, 3-12 months later and using the criterion noted, the market is higher 100% of the time. Let’s hope history proves to guide the market once again in 2019 given the results. But it’s going to take some improving economic data to do so in our opinion, not to mention a little bit of market symmetry near-term; a pull back to set up newer, higher support levels. Pullbacks are supportive and healthy folks.
In terms of the economic data, two key pieces of data were delivered on Tuesday and both highlighted concerns within the economy, but in a limited fashion. The number of job openings reached a series high of 7.3 million on the last business day of December, the U.S. Bureau of Labor Statistics reported Tuesday. Over the month, hires and separations were little changed at 5.9 million and 5.5 million, respectively. Within separations, the quits rate was unchanged at 2.3% and the layoffs and discharges rate was little changed at 1.1 percent.
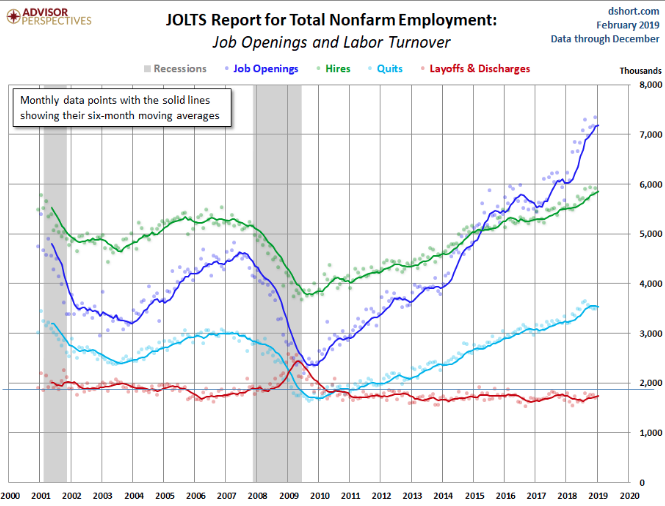
The number of job openings has hit another cyclical high and identifies the need for workers in an economy that is expected to continue to grow in 2019, albeit at a slower pace than 2018. The JOLTS survey proved to be the more bullish piece of economic data Tuesday, but it was muted by the latest NFIB small business survey. The NFIB headline number for January came in at 101.2, down 3.2 from the previous month.
“The NFIB Small Business Optimism Index slipped 3.2 points in January, as owners continued hiring and investing, but expressed rising concern about future economic growth. The 101.2 reading, the lowest since the weeks leading up to the 2016 elections, remains well above the historical average of 98, but indicates uncertainty among small business owners due to the 35-day government shutdown and financial market instability. The NFIB Uncertainty Index rose seven points to 86, the fifth highest reading in the survey’s 45-year history.
“Business operations are still very strong, but small business owners’ expectations about the future are shaky,” said NFIB President and CEO Juanita D. Duggan. “One thing small businesses make clear to us is their dislike for uncertainty, and while they are continuing to create jobs and increase compensation at a frenetic pace, the political climate is affecting how they view the future.”
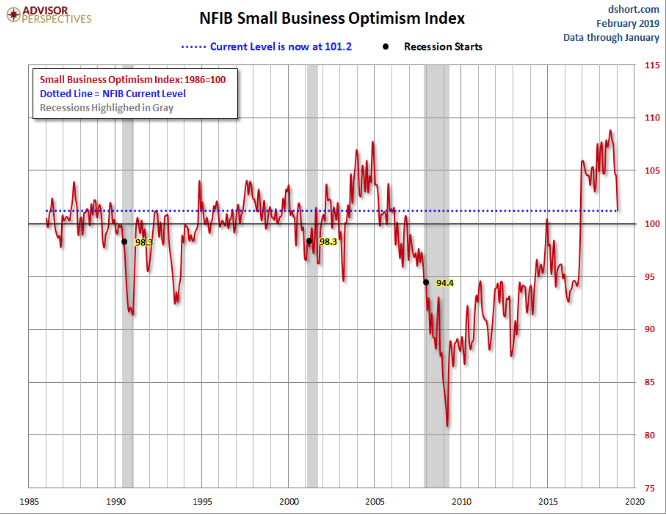
While the NFIB is still at lofty levels and above the long-term median average, business optimism fell more significantly than desired to see. Much of the reduced optimism can be blamed on the government shutdown. The next chart is an overlay of the Business Optimism Index and the Conference Board Consumer Confidence Index.
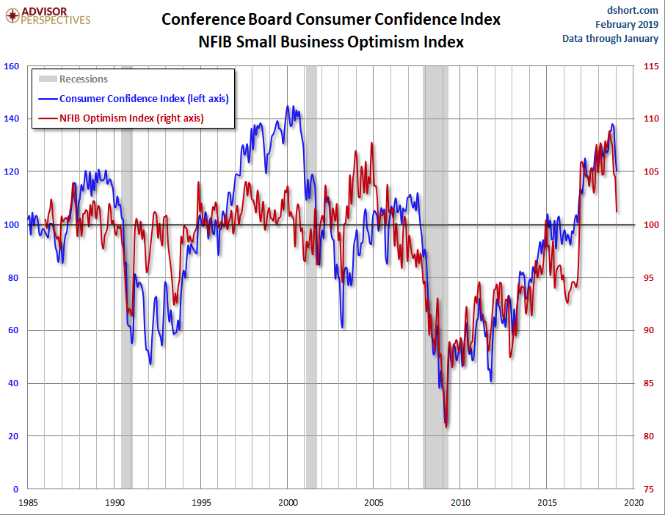
What’s concerning about the NFIB data are not only the business sentiment component but also the consumer confidence component. It may be foreshadowing some softer spending to come by way of the retail sales data, which is due out later this week.
The economic data calendar is light on Wednesday. CPI data will be released before the opening of trade on Wall Street. There are expected to be a number of Fed speeches on Wednesday and through the remainder of the week. And by the way, those monthly retail sales from December will be released on Thursday at 8:30 a.m. EST. Plan prudently as the data has been highly anticipated.
The market rally that begin after Christmas Eve 2018 has been a remarkable rally in that it has climbed a wall of significant worries. Additionally, it has done so with very little investor participation as we’ve seen nothing but equity market ETF outflows in 2019. With that in mind, Bank of America Merrill Lynch’s latest fund manager survey, which gauges where global pros are positioning, showed the biggest net overweight position in cash since January 2009. Remarkable! During the month of January, the survey showed that 34% of the 173 respondents said they think the S&P 500 peaked in 2018 at 2,931. The bank lays out the slump in equity exposure in this chart of the day:

It’s clear from the Bank of America fund manager survey that some investors have been happy to miss out on the New Year rally, or maybe they are just consoling themselves. Hayman Capital Management founder Kyle Bass says, “So be it.”
“Markets will rejoice to the extent we get to a win on a trade deal. It’ll be short lived. My guess is by the end of the year the U.S. market will be lower than it is today,” Bass told Bloomberg in an interview that aired Monday. Bass earned his street cred back in 2007 making winning bets on subprime loans and the collapse of the U.S. housing market.”
Bass doubled down on a prediction that he made last year that the U.S. will face recession by 2020, citing headwinds such as global growth. He explains Chinese data, such as industrial production is looking shaky, while Italy entered recession last week and he gives Germany three to six months before its own downturn.
“The U.S. has this positive stimulus coming from the tax cut that we believe had a $250 billion impact last year, and it’ll have a $400 billion positive impact in total this year, but next year it will only be $150 billion,” Bass says, adding that the deltas, or differences, here are important.
“The deltas from this year to next is minus $250 [billion] so I think economic activity will begin to wane in the back half of 2019, and by the middle of 2020 we’ll most likely be in recession,”
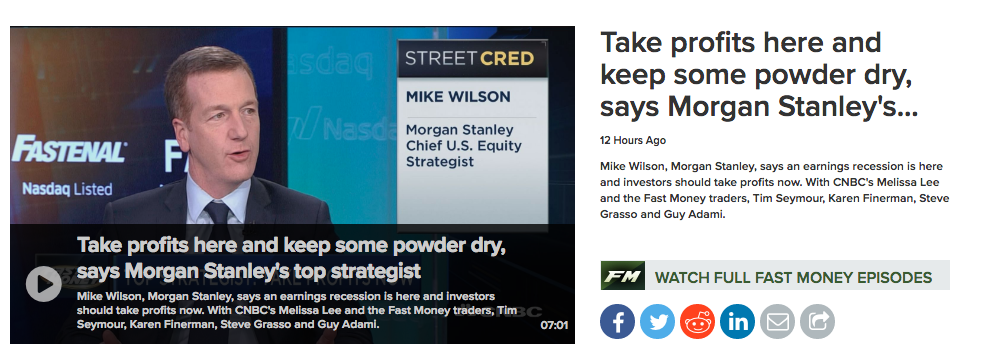
In the face of naysayers, doomsdayers and pessimism, the market has achieved significant feats of strength, the most recent being closing above the 200-DMA. But what now; that’s the question investors have to decide for themselves. Finom Group’s Seth Golden has outlined his thoughts on how investors might position through the persistence of the market rally. Finom Group’s Wayne Nelson identified the chart patterns and forecasted the S&P 500 would seek out and find it’s 200-DMA. Now that we are here, Clarity Capital’s Lance Roberts and Morgan Stanley’s Mike Wilson suggest it’s time to lighten up. Roberts uses the follow chart to suggest the noted actions investors should take.
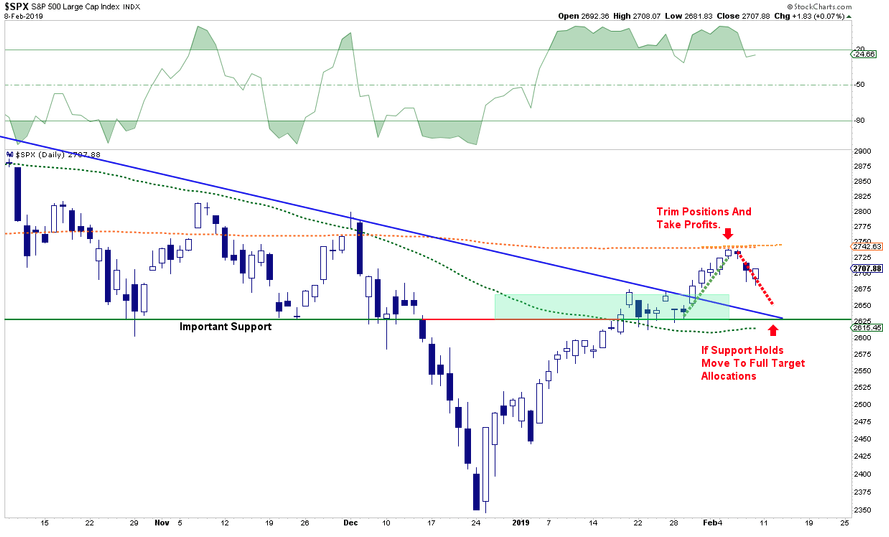
“What will be critically important now is for the markets to retest and hold support at the Oct-Nov lows which will coincide with the 50-dma. A failure of that level will likely see a retest of the 2018 lows.”
“A retest of those lows, by the way, is not an “outside chance.” It is actually a fairly high possibility. A look back at the 2015-2016 correction makes the case for that fairly clearly.”
Morgan Stanley’s chief U.S. equity strategist echoes the thoughts of Roberts by suggesting that investors/traders should “get off the bull” now. Mike Wilson appeared on CNBC’s Fast Money just last night, urging investors to consider the trajectory of FY19 earnings estimates may continue to be revised lower and through the current earnings season.
Huge cash positions, equity market ETF outflows, bearish sentiment in abundance and even the possibility of an earnings recession in the first half of 2019 and yet the market is up roughly 16% from its Christmas Eve 2018 bottom. How did this happen? Liquidity matters and when central banks are increasing liquidity within the financial system, it tends to have a beneficial impact on equity markets.
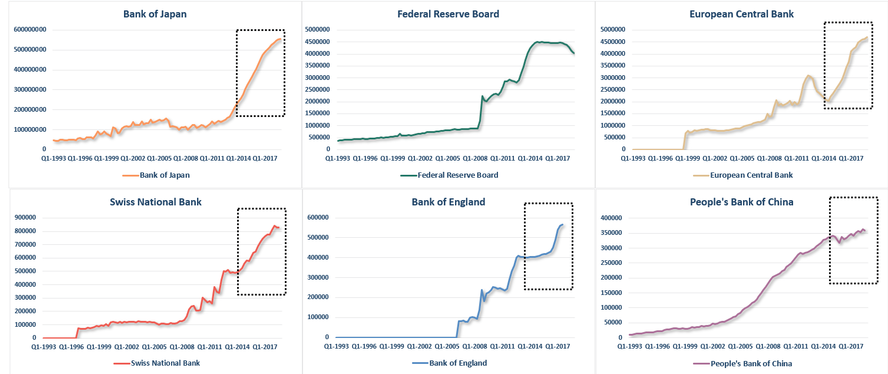
As shown in the charts above, all but the United States FOMC is pumping liquidity into the financial system. Even the FOMC/FED has moved off and away from the notion of rate hikes until inflationary pressures arise. When coupled with an increase in global liquidity, the FOMC’s newly dovish rate hike position has proved to bolster equity market sentiment. Nonetheless, markets do move in straight lines and we’d expect a hiccup (or maybe hic-down) near-term. With that in mind, let’s take a look at what Wayne Nelson has to say about the markets from a technical perspective (click link to view) and with respect to “the one trade that got away”.