Is it a bear market bounce or a bull market rally? That seems to be the ongoing debate and depending who you ask; the answers will be vastly different. With Wednesday’s market rally, the S&P 500 (SPX) has rallied 15%+ over the past 33 days, with just 2 days in which it fell more than -1 percent. Such dips were obviously bought, dispensing with the myth that “buy the dip” was gone. The fact is, the market moves higher over time, that is the natural order of the market and as such all dips are eventually proven to be buying opportunities; it’s just a matter of time. Referring to our opening remarks though; 33 days, up over 15 percent. That’s a massive rally and one that finds the major averages OVERBOUGHT!
Now certainly we’ve mentioned that the market has been overbought in the more recent past. We’ve also mentioned that the market, just as it can stay oversold, can remain overbought for longer than people think. Nonetheless, all good things do come to an end. Recall what happened in January of 2018 and as the S&P 500 rallied throughout January and achieved its highest RSI on record? Recall what happened shortly after the calendar turned from January to February and resulted in the largest 1-day drop on the Dow Jones Industrial Average (DJIA) ever? No, we’re not trying to scare anybody out of the market, but rather articulate how the good times seem to make us forget about the bad times and even breed bad behaviors. And so it’s with all of this rehashing and central focus on the market production in 2019 to-date that we simply urge caution on the part of the investor/trader. The good times… appreciate them for what they’re worth, but don’t lose touch with discipline.
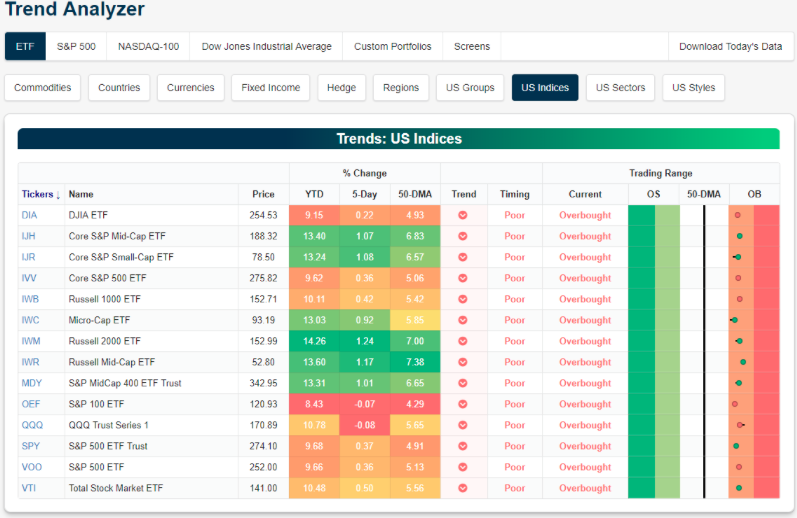
In looking at the market place and with respect to the substantial market rally already produced in 2019, we review how to best decipher overbought conditions by looking at three charts and indexes. First up is Bespoke’s Trend Analyzer. As we can see from the table below, every major U.S. index ETF is back in overbought territory after teetering between neutral and overbought territory to begin the week.
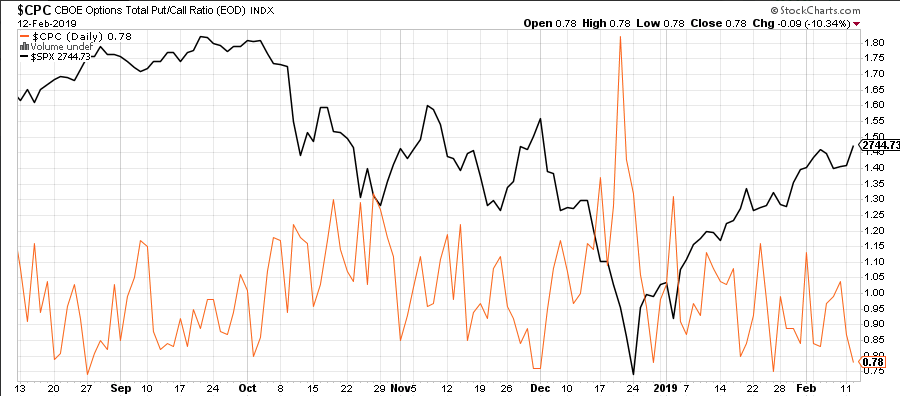
The next indicator/index we will look at comes from the CBOE. The CBOE Options Total Put/Call Ration Index is expressing very complacent levels. As we can see from the Index, every time the options market comes down to such levels, it eventually bounces higher and in tandem with an S&P 500 pullback.
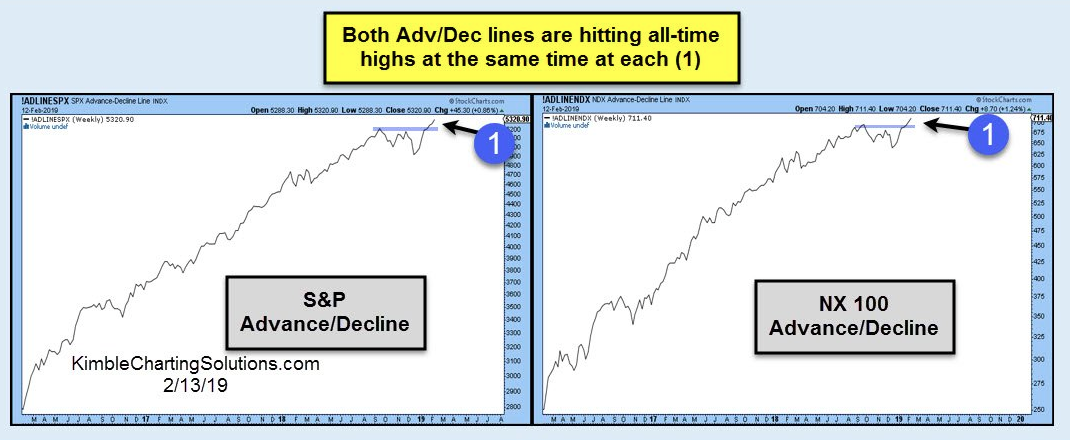
Last, but certainly not least we can see that both the S&P 500 and Nasdaq (NDX) Advance/Decline lines are at record levels.
Simply put folks, by most anyway one can review it, the markets are overbought. Does this mean you sell everything and wait to buy everything back on a dip? Not necessarily! What it means is that there will be opportunities to buy good companies at cheaper prices in the future. Not every stock will fall with the broader market either. But more importantly is the consideration of a strong market rally that has produced strong profits. Do you really want to pass up double-digit realized profits? It’s something to consider! Peter Boockvar says this rally is likely to end badly and is fundamentally flawed.
“I would be fading this rally thinking that it’s more of a bear market bounce rather than this is the beginning of a bull market,” the Bleakley Advisory Group chief investment officer. The higher the market goes [and] the lower earnings estimates go, the more expensive the market is getting.”
Boockvar was a bear in 2018, too. Last summer, the CNBC contributor told “Futures Now” the U.S. market would get swept up in a wave of corrections. By October, his forecast began unfolding.
“If you look at the actual underlying economic fundamentals, they’re deteriorating, particularly overseas. With respect to corporate earnings, we’re seeing a decline in earnings expectations for this year. Earnings declining are a risk because it’s happening in the context of stalled monetary tightening.
“At some point, the market is going to ask itself, ‘Why is the Fed done raising interest rates?’ It’s not because they’ve achieved their objective of getting around 3 percent [GDP growth]. It’s because the data, particularly overseas, caused them to take a step back.”
It’s not a pretty picture being painted by Boockvar, but paintbrushes can differ and the picture itself can be interpreted differently by the many Wall Street analysts and strategists. Goldman Sachs CEO David Solomon said Wednesday the chances of a recession in the U.S. are quite small, even though the rate of economic growth is slowing.
“There is no question that the momentum of growth in the United States has slowed. That said, economic activity in the United States is still chugging along pretty well. I think we’re in a position, at the moment, where we should see reasonable growth during the course of the year.”
Whether it will prove to produce an economic recession or an earnings recession in 2019 will take the element of time to bear out. But either way, absent an economic recession the markets still tend to stabilize and move higher historically and as they prepare for easy comparisons in the forward 12-month period. To some extent, that is what the market prepared for in Q4 2018, slowing earnings in 2019 due to slowing economic growth and very difficult YOY EPS comparisons. The bottom line is that WHEN a market pullback occurs; know why it is occurring and what the probabilities are post the market pullback. Knowledge is power and strength and within that knowledge one can be provided with the courage to see the pullback for the opportunity that it is instead of fearing it for how deep a pullback it may or may not produce. The concept of fearing a pullback was recently highlighted by Canaccord Genuity’s chief market strategist Tony Dwyer. Tony is predicting the S&P 500 will end the year at 2,950, about 9 percent higher than Thursday’s close.
Having said that, he also expects stocks to drop around 3% first and providing the buying opportunity.
“If you don’t expect that the market can correct, you get scared when it does,” Dwyer said Thursday on CNBC’s “Fast Money.”
Tony Dwyer’s main reason for the 2019 rally: Federal Reserve monetary policy. The central bank has been gradually raising interest rates and drawing down its balance sheet. However, in January it opted not to raise rates and indicated it would take a “patient” approach going forward. In addition to the FOMC monetary policy, Dwyer often denotes that absent the inversion of the yield curve, which produces a credit crunch/crisis, a recession is highly improbable. As long as credit is flowing, the economy will likely plod along even if at a slower pace.
Some scary headlines broke on Wednesday related to economic data points, that without appropriate context may have stoked fear into investors. One such piece of data was the auto loan delinquency rate. But before we get to that… Household debt rose for the 18th straight period in the fourth quarter, edging up 0.2% to $13.54 trillion, the New York Fed said Tuesday, even as new mortgage debt fell to the lowest level in nearly four years.
The New York Fed report highlighted that the new auto loans were mostly to creditworthy individuals, with the overall auto loan stock at the highest quality since the regional central bank started keeping track in 2000. Nonetheless, the flows of auto loans into serious delinquency kept rising due to past subprime origination, now reaching 2.4%, the highest level since the third quarter of 2017. These subprime loans have by and large been made by auto finance companies as opposed to banks or car manufacturers. According to the New York Fed, 6.5% of auto finance loans are 90+ days past due, compared to just 0.7% of those made by credit unions.
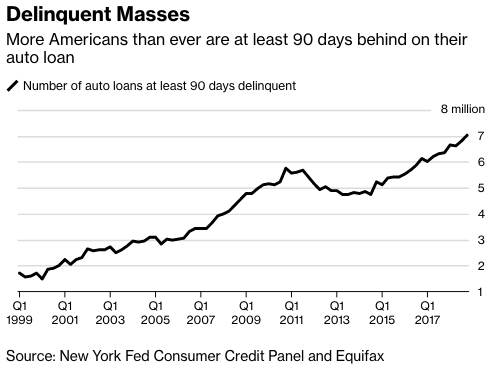
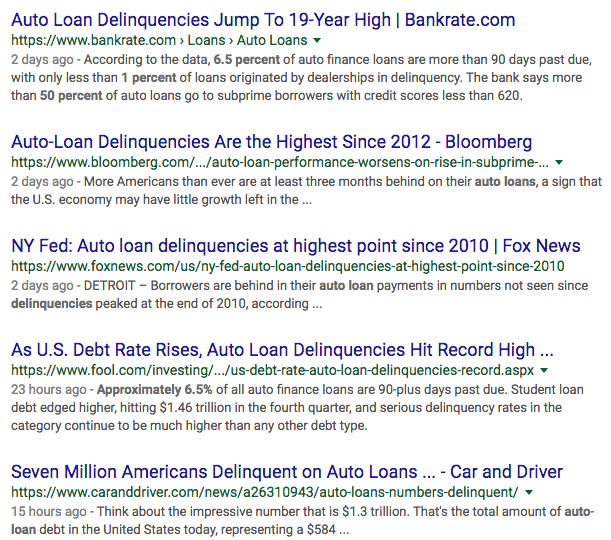
So of course, the media takes hold of the auto loan delinquency rate ticking higher and to the highest levels since 2012 and runs with it.
“Disappointing dynamics in sales and delinquencies in the auto sector could be a foretelling sign,” said Yelena Shulyatyeva, senior U.S. economist at Bloomberg Economics. “Recent developments confirm our estimates that the U.S. economy has entered the late stages of the business cycle even though the recession odds remain low” and the cycle’s end isn’t yet in sight.”
Not all auto loans are created equally and as such not all loans are offered to the same client demographic. It’s the subprime issuance that is really weighing on the auto loan market data. Borrowers with credit scores that re less than 620 generally are found achieving subprime auto loans, and that’s where the greatest delinquency rate is coming from.
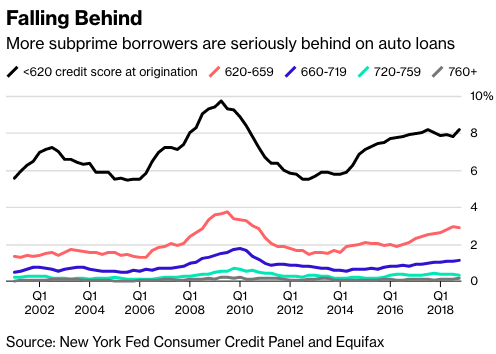
To be clear, the vast majority of these subprime loans are held by younger demographic borrowers, many of who also carry student loan debt and are of the millennial generation. It’s a different demographic that finds itself with the ability to “ghost” jobs and seems to also make decisions on how to finance their debt that is proving different from previous generations. After all, the labor market that has produced the fastest wage growth in years and has also found with it the best household debt: income ratio since 2002 doesn’t suggest affordability is a problem. They are simply saying there is a better option than paying off that auto loan, even if over time they will likely be proven wrong with future indebtedness and credit worthiness decay.
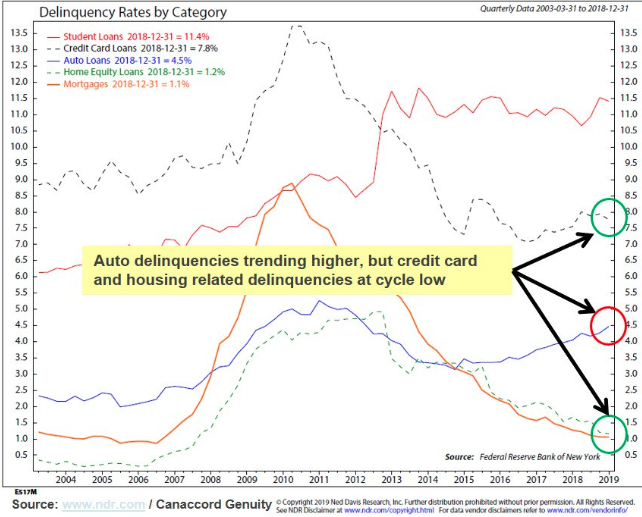
Again, the headline is a scary one: Record 7 mil 90-days behind on car loans. But context is key. It is similar to all the scary stats about the Student Debt delinquency argument for last 5 years. But other areas of credit such as credit cards and housing related are not showing similar issues. Check out the following chart below from Canaccord Genuity:
Moreover and to our point about Household debt to income ratio proving more favorable than during the last recession period.
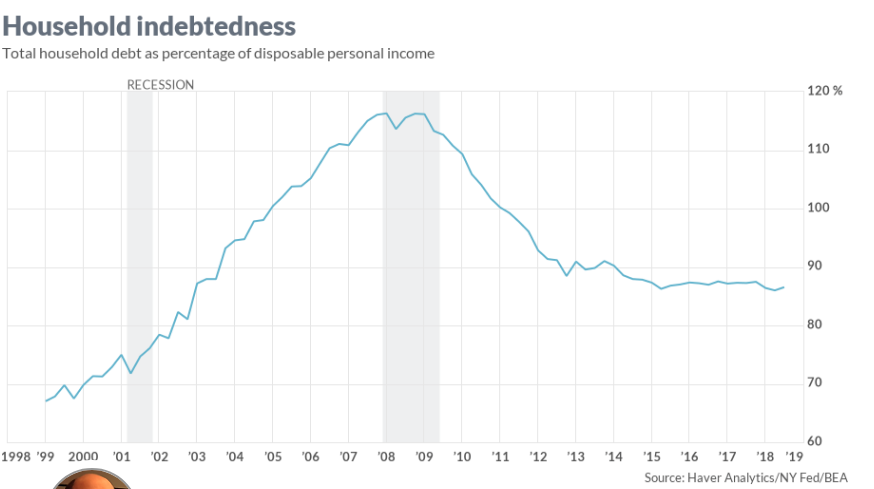
As shown in the chart above, household indebtedness continues to hover around cycle lows, validation of low-level mortgage and credit card liabilities comparatively. But most importantly is disposable income as shown in the chart below.

This chart identifies why consumer spending has grown and proved to accelerate in 2018, at least up until recently and as concerns were raised by even consumers given the geopolitical angst and market sell off. And that brings us to monthly retail sales for the month of December, which have been delayed due to the previous government shutdown. Many are of the opinion that the retail sales will express the subdued tone of the overall geopolitical environment and market sell off. According to FactSet, economists polled estimate that December 2018 retail sales will come in flat and down .1% ex-autos. We’ll see just how much retail sales slowed at the end of the year before the opening bell on Thursday.
Wednesday’s market rally also came on the heels of reported lesser inflation fears. The consumer price index was flat last month, the government said Wednesday.
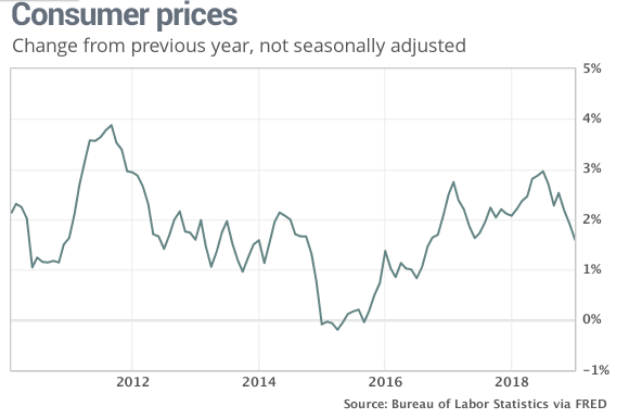
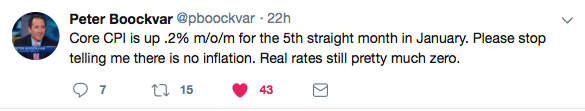
Another closely watched measure of inflation that strips out food and energy rose 0.2% last month. The yearly increase in the so-called core rate stood at 2.2% for the third month in a row. And of course this is the number that Peter Boockvar keyed off of in a tweet on Wednesday, suggesting there is inflation in the economy. He’s wrong of course, but it demands context.
There’s a difference between inflation, true and sustainable rising prices and the simplicity and short duration of reflation. The facts are what we aim to deliver, not a bias that simply reflects a short time period that fits a negative or bearish market and economic narrative.
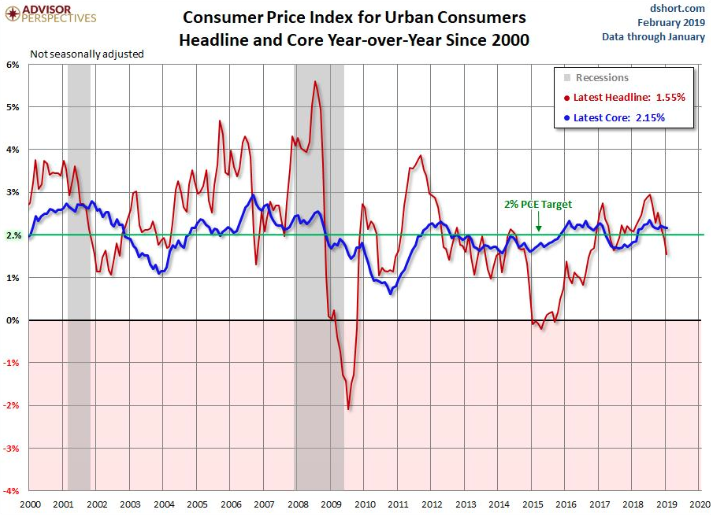
As shown in the chart above, the rate of growth for core inflation has a hard time getting over 3% for both PCE and CPI this century. Five months does not make a year Peter, nor does it make several years and nearly 2 decades. If you want inflation, you’re going to have to artificially produce it. There’s simply too many offsets in the economy, but for the sake of money supply.
Have a great trading day everybody! For Finom Group subscribers exclusively will be our weekly State of the Market video publication this evening. Stay tuned and do review our daily Technical Market Recap with Wayne Nelson by clicking the link.