I had a conversation with a client in the late evenings recently. Yes, in the late evening and as the selling pressure in the markets persisted last week. The conversation centered on the client’s e-mini Futures positions and the general sentiment for the market going forward. He was a bit confused as to the correlations between the S&P 500 (SPX) and the VIX seemingly being less than normal. In other words, the S&P 500 was at it’s October lows, but the VIX was flat, not really going higher and not following the sentiment of the market and the direction of the S&P 500. I pointed him to our recent article that touched on this very subject, but also updated some thoughts that rarely if ever get mentioned in the media or by analysts.
In Finom Group’s recent article titled “Why isn’t the VIX Screaming Higher”, we touched on the fact that there is really more to the VIX than meets the eye. How institutional investors use the VIX and VIX derivatives is often surprising to the general public. The VIX is generally found to be a stochastic process or a reading derived from S&P 500 options that portend to estimate 30-day implied volatility. For practical usage, institutional investors and portfolio managers acquire S&P 500 options as a hedge against their long portfolio exposure. Fun fact: the typical hedging program at the institutional level equates to only a 2% weighting of the portfolio exposure, as S&P 500 options are expensive. So when a portfolio manager says they are hedged… really?
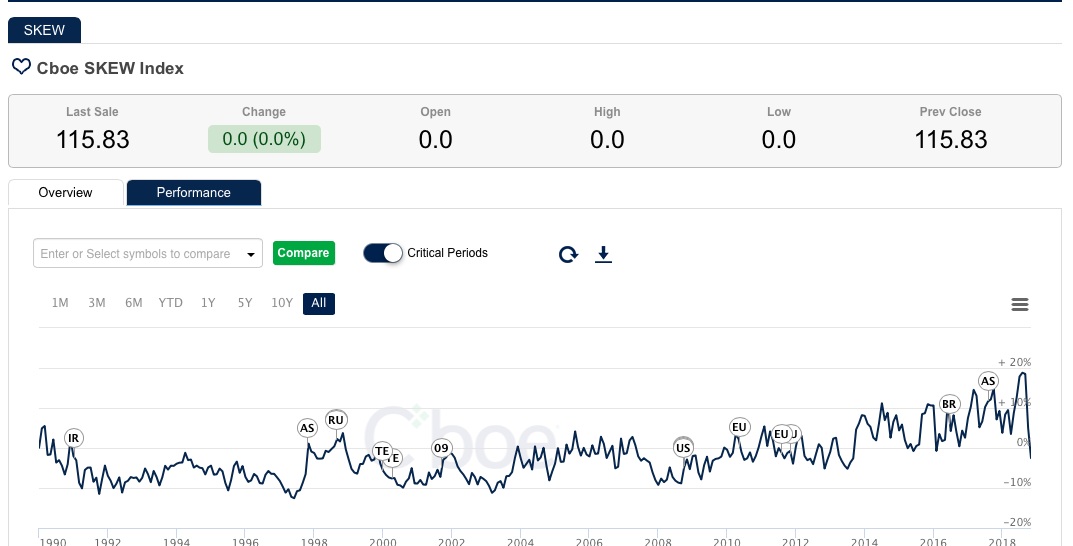
Moreover, what Finom Group also discussed in the recent VIX-related article was some of the other VIX-complex indexes like the SKEW Index and the Volatility of Volatility (VVIX). Simply put; it’s not enough to look at the VIX reading itself and attempt to draw conclusions on the current or future state of the S&P 500. In looking at these other indexes or instruments we drew the conclusion that while the S&P 500 was finding its October lows, complacency was coming back into the market. I’ll explain what I mean by that because believe it or not, when the VIX was at 22-23, it was a complacent 22-23 reading. First, here is what we said about the SKEW Index reading:
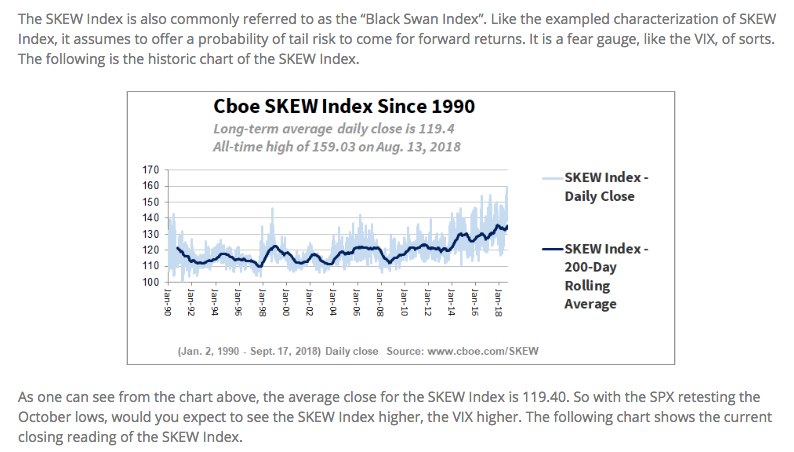
The SKEW Index was suggesting that institutional investors weren’t pricing in any major tail risk for the market in the near future, regardless of the VIX reading at the time. Secondly was the Volatility of Volatility Index (VVIX). We discussed how VVIX can be a leading indicator or predictor of future VIX moves. Below is what we offered in this regard to the state of VVIX:
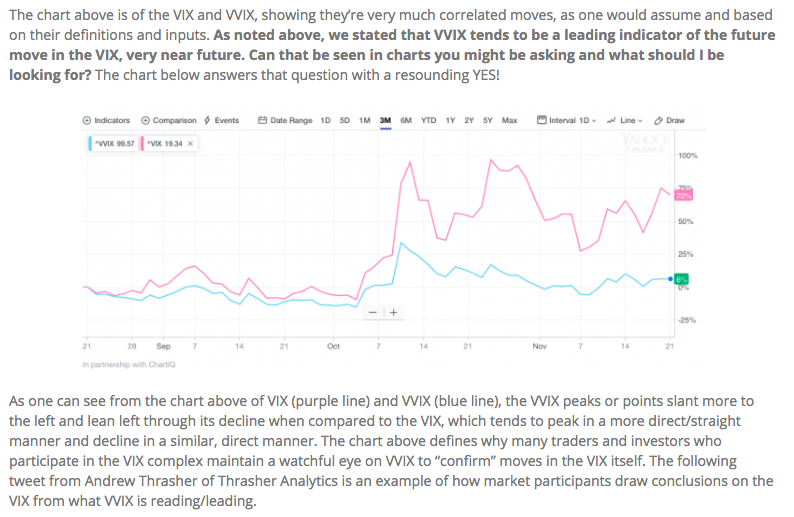
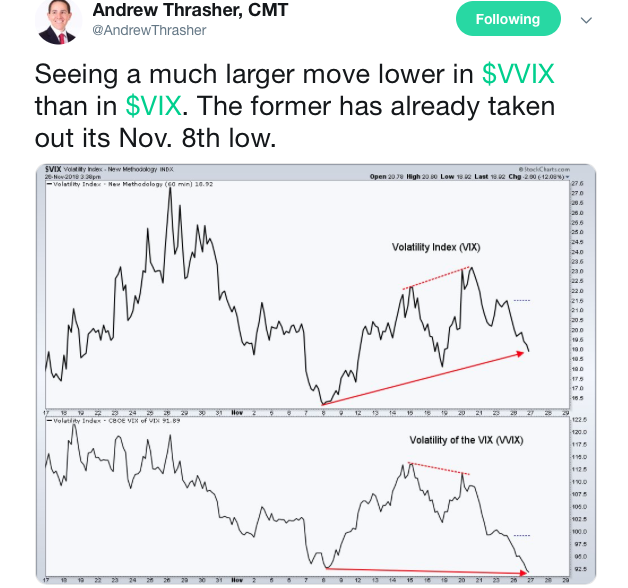
On that particular day where we discussed VVIX, it dipped below the 100 level, which is historically an indication of VIX option, hedging activity being subdued. And since that time…? Firstly, remember VVIX tends to be a leading indicator for the VIX. It typically leads a move higher and subsequently leads the next leg lower. The following tweet from Andrew Thrasher identifies this very point of fact whereby VVIX has already moved lower than its recent low on November 8th.
And let’s now, also, update the SKEW Index reading. Recall that on November 21st the reading was roughly 119. As of November 28th the reading is 115 as depicted in the screenshot below.
So where did we start? That’s right, a discussion I had with a client the other evening. The most important part of the discussion was identifying the difference between the market/S&P 500 and the VIX. There is a common misconception that “as the S&P 500 goes, inversely goes the VIX”. This is true most of the time, probably 85-90% of the time in fact. But as it was in January when the VIX rose alongside the S&P 500, the VIX can in fact go sideways or decline alongside the S&P 500 declining. The VIX/SPX correlation is an imperfect one, but one that bears understanding of those imperfections.
In January, when the S&P 500 seemed to be on an endless rise and with a historically high Relative Strength Index (RSI) reading, the VIX rose. The reason the VIX rose was likely due to the expectation amongst investors that an end would certainly be found for the S&P 500 upside momentum, it was just a matter of when. As such, these investors started hedging with S&P 500 and VIX options. The hedging activity resulted in a rising VIX and VVIX. The opposite has been happening in November. The way I described the falling S&P 500 and sideways to bearish VIX complex flagging signals to the client was that the broad base of investors have accepted the state of the market for what it is, decisively bearish. They stopped fighting the market downtrend and accepted their fate for the time being and stopped hedging in favor of raising cash. Given this market activity, the VIX basically stalled out and began signaling a move to the downside was in store. You could also see this on a daily basis in the S&P 500, which during the market’s search for a double-bottom; it would sell-off into the close. Instead of “buying the dip”, investors were “selling the rips”, something we discussed on many occasions during the October and November swoon. But how else could you see this activity in the S&P 500?
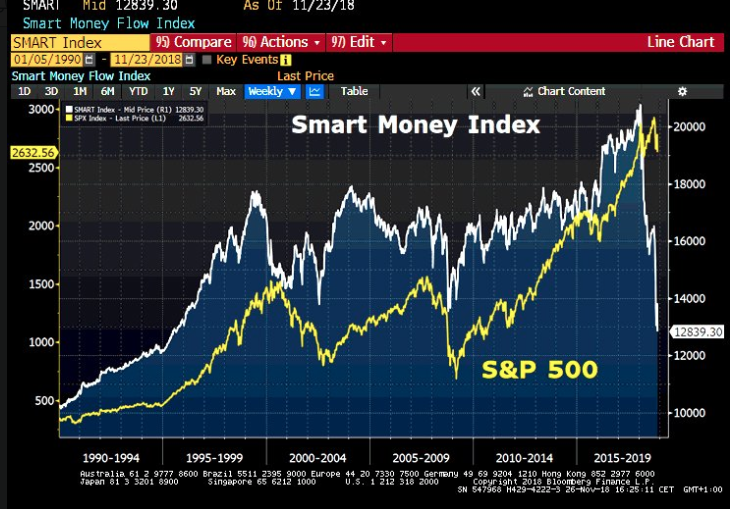
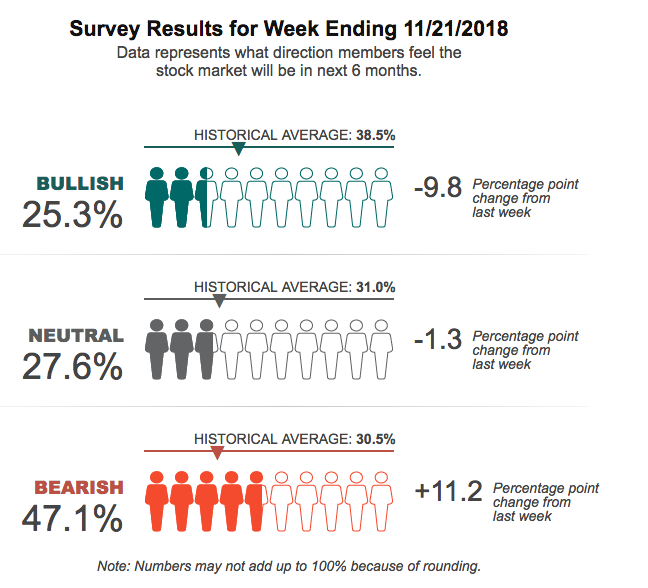
The screenshot above is of the Smart Money Index (SMI). Warning!!! This is a useless Index despite its widespread usage by institutional investors. If the market goes up over time, which it does historically, there really is no relevance to this indicator even though many suggest it to be a leading indicator of the S&P 500. Nonetheless, what you can see in the SMI is that it’s basically broken. The SMI measures the tendency for “smart investors” to sell into usual initial euphoria at market opens and buy positions back in the 30 minutes before the market close. But the SMI fails or doesn’t work when BEARS begin to dominate the market. So it’s irrelevant in real time, long term and when bears dominate the market. Having said that, it does support the notion that “sell the rips” has been firmly in place for the better part of 2018, which is also substantiated in the data of market flows (inflows and outflows of capital). Additionally, this further examples what I’ve offered above regarding market volatility and the VIX itself. Market participants have become complacent in there bearish sentiment, jaded if you will and simply reduced their hedging activity in favor of raising cash, by selling the rips and even their “winners”. Sentiment has become just that bearish, as indicated in the most recent American Association of Individual Investor sentiment survey.
It’s often been promoted by volatility bulls that if a bear market commences, the VIX will explode higher and volatility will remain elevated. Firstly, that’s an impossibility, as I’ve suggested many times before. Volatility can have an initial leg higher, but it will stall out and subsequently fall. Logically, volatility CAN’T REMAIN ELEVATED! Who would put capital into such a market environment? Secondly, and as many are learning given the present example of volatility in the market, the S&P 500 and the VIX are not perfectly, inversely correlated…and that’s largely a function of investor hedging activity.
Now I may never be invited back on CNBC again… yes I was invited onto CNBC back in 2015, as I was a sell side analyst with Capital Ladder Advisory Group, covering Keurig Green Mountain (GMCR, which was later acquired). I was asked to outline my thoughts on GMCR and the Keurig Kold platform development. Apparently, my negative views and fundamental analysis of the Keurig Kold weren’t welcomed by Jim Cramer, a GMCR bull who was supportive of the former $150 Keybanc price target. We all know how that ended: With the share price falling from $157 to just below $40 within 8 months and before being acquired by J.A. B. Holdings for $92 a share. Nonetheless, it was a welcome sight to see Jim Cramer’s latest ramblings on the state of market volatility align with ours here at Finom Group. In truth, Cramer takes his volatility/VIX definitions from Mark Sebastian of OptionPit.com, a market volatility expert.
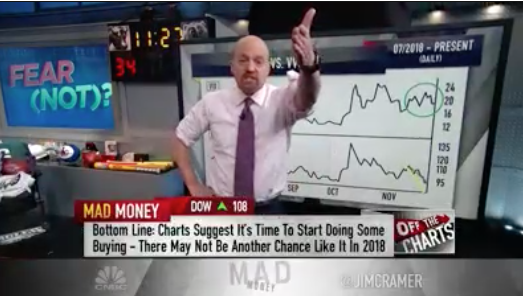
“After inspecting the charts of the Cboe Volatility Index — a market measure sometimes referred to as the “fear gauge” or the VIX — volatility expert Mark Sebastian thinks that the market could soon exit its bearish phase.
[The] charts … suggest that it’s time to start doing some buying,” Cramer said on “Mad Money.” “[Sebastian] thinks you might not get another chance as good as this one for the rest of 2018. I don’t know if he’s right, but don’t you find it heartening when you consider how right Sebastian’s been in the past?
Markets can indeed fall without the VIX rallying, albeit only for short periods of time. Based on past sell-offs, like the ones seen in this chart of the S&P and the VIX in 2018, investors eventually get jaded enough that they stop hedging against market swings. That leads them to stop buying S&P options, sending the VIX — which tracks S&P option prices to measure implied volatility — lower.”
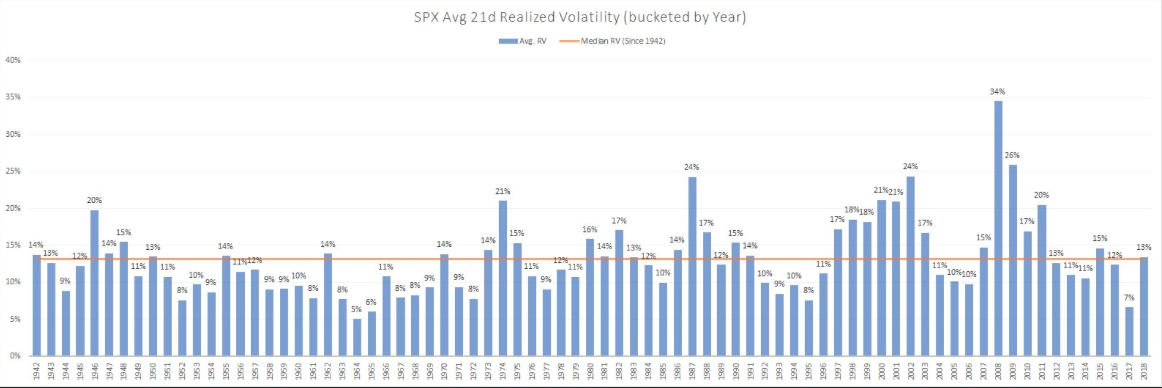
In short, while we find our previously outlined indication on why the VIX is doing what it’s doing despite the S&P 500 doing what it has been doing validated by others, we should note that the VIX can easily detach from trend. The VIX is completely reactionary in its form and structure. So while the current analysis that defines the action of the VIX of late is substantiated in all of these findings and articulations, all it takes is one headline to dissolve the aforementioned analysis and create a new volatility regime. And that’s another takeaway for investors to understand about market volatility. Volatility tends to exist in regimes and moves from one regime to the next over time. You’ve likely heard it throughout 2018, “The markets are so volatile!” The reality is that the market only seems abnormally volatile in 2018 because 2017 was an outlier year for volatility with a median VIX of 11.10 in 2017. Coming off of an extreme low in 2017, it’s only natural for 2018 to feel like it’s an extremely volatile year when it really isn’t out of the norm. The chart below validates the assertion.
Now 2008, that was a volatile year! Nevertheless and regardless of the level of market volatility being expressed, subscribe to finomgroup.com today and trade with us! Below is our trade of the day yesterday in the volatility complex.