
Markets rallied hard on Wednesday and in unison with Federal Reserve Chairman Jerome Powell indicating that the FOMC was just below the “neutral rate”. In addition to this statement of great consequence, Powell also indicated that the Fed was looking more closely and willing to align with the economic data. Both of these statements and/or indications led investors to believe that while a December rate hike is pretty much a given, future rate hikes are in question as to when and how many. All in all, it was a well-received message by investors who found the Fed Chair having a sharply greater dovish tone than that from the September Fed meeting. Finom Group’s chief market strategist Seth Golden was asked by Zack’s Research senior stock strategist Kevin Cook for his take on the Fed and market reaction. Here is what Golden offered:
“At present, investors desire a Fed that streamlines their verbiage, indicates they are data dependent and not on “auto pilot” with respect to rate hikes… oh and the neutral rate, which is as subjective as subjective can be. Neutral to Fed officials was seemingly not neutral to market participants who believe they found a weakening economy, partly due to higher rates, especially weakening within rate sensitive sectors such as autos and housing. And so the Fed, as it always does, capitulates to the market participants. Make no mistake about it, while the market dogma suggests the Fed is market neutral, their historic fiscal, monetary polices have always been a reaction to the market, which is otherwise a reaction to the economic cycle as they tend to go hand-in-hand.
So what else is the FOMC Chair to do? The recent weakening of the housing and auto sectors has the potential for spillover into the broader, retail consumption based economy. As such, it really was an easy capitulation for the FOMC Chair given… “the data”. Housing has been trending lower since its peak in January. Autos have peaked mid-2018 and trended sideways, but since fallen on hard times as it pertains to profitability for the sector. And where is the inflation as the Fed’s favorite PCE data has also stalled out in late summer and since retraced some of its FH18 gains. The data is the FOMC’s friend and has made it relatively easy to capitulate to the markets “demands” of a more dovish FOMC.
Most economists believe the tax fueled economic stimulus would be short lived with a peak in economic activity in late 2018 followed by slowing growth in mid-late 2019. Most forecast call for 1.75-2.5% GDP in 2019 as the stimulus wears off. This is a far cry from the 3%+ GDP in 2018 and as such the belief would be the FOMC could only raise rates 1 or 2 times in 2019. The Fed’s dot plot indicated 3 hikes in 2019. Combining the FOMC’s dot plot, the “auto pilot commentary” from the Fed in September with regards to rate hikes and the removal of “data dependent” verbiage and the market called the FOMC to task. So if you think the market and the economy aren’t in control of the FOMC after today’s capitulation by FOMC Chair Powell, well, then why would the market rally when the FOMC capitulates? Fed put doesn’t die of old age or even when the Fed tightens. It dies when the market and economy says so.
For Finom Group, Wednesday’s indication from the Fed that a pause was very likely after the December rate hike was within our forecast and something we discussed in our more recent research reports. Readers can also find this commentary and forecast for a “Fed pause” in this video series titled State of the Market.

Major averages soared on Jerome Powell’s speech and general comments Wednesday, but bond yields continued to fall. The market will be keeping a watchful eye on bonds given how flat the yield curve has become in 2018. Most of the media spotlight has been distracted of late and taken off of the yield curve, but that could change rather quickly. As one can see from the chart below, the yield curve is as flat as it has been since the period leading up to the Great Financial Crisis.

Most economists and analysts promote the notion that an inversion of the yield curve (2-yr. Treasury note goes above the level of the 10-yr. Treasury note) signals the onset of an economic recession. So what does that actually translate to for the equity markets/S&P 500? The following table from Troy Bombardia offers the answer. Here’s what happens next to the S&P 500 when the yield curve inverts for the first time in each economic expansion.
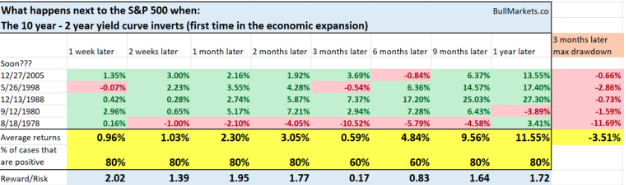
As one can see, the market tends to rise even after the yield curve inverts and up to a point where a recession in earnings actually takes place. Earnings drive markets over time.
While the Fed remains in focus, as this will only last until headlines start to leak out from the G-20 Summit, the economic data surrounding housing has improved on several fronts and on a MoM basis. Building permits and existing home sales rose slightly MoM as recently reported. Additionally, total mortgage application volume increased 5.5% last week compared with the previous week, according to the Mortgage Bankers Association’s seasonally adjusted index.
“The rise in purchase activity was led by conventional purchase applications, which surged almost 12 percent, while government purchases were essentially unchanged over the week,” said Mike Fratantoni, chief economist for the MBA. “This also pushed the average loan size for purchase applications higher, which likely meant there were fewer first-time homebuyers in the market last week.”
Unfortunately, the limited positive housing data was abruptly usurped by a widely negative New Home sales report delivered on Wednesday. New-home sales ran at a seasonally adjusted annual 544,000 rate in October, the Commerce Department said Wednesday.

October’s selling pace for new single-family homes was 8.9% lower than September’s, although that report was revised upward. It badly missed the MarketWatch consensus forecast of a 589,000 pace, and was 12% lower than year-ago levels. The median sales price in October was $309,700, 3.1% lower than a year earlier. At the current pace of sales, it would take 7.4 months to exhaust available supply. That’s not only above the 6 months that’s long been considered a marker of a balanced market, but also the highest level of supply in seven and a half years.
The New Home sales data is problematic and likely tied to a rising rate environment. Previously, inventory and rising home prices were weighing on the housing market, but as prices have leveled off, rates haven’t, until most recently. What we’re seeing in the mortgage application data may very well be signaling that lower rates will drive demand going forward. Over the last 5 weeks, the benchmark 10-yr. Treasury yield has fallen from 3.24% to 3.01% at present. That is a strong move to the downside in rates and has unsurprisingly resulted in increased mortgage activity. More housing data is due out today in the form of Pending Home sales at 10:00 a.m. EST.
The Dow (DJIA) has recaptured some 1000 points week-to-date and from its recent declines. The S&P 500 (SPX) is up 111 points for the week and above a key gravity point of 2,721. Last week, the S&P 500 lost 104 points. As such, the benchmark index has erased all the losses from the prior week. This enforces the notion that investors are better served by considering the market with a long-term perspective.
Nonetheless, recall from Finom Group’s weekly research report that this week’s expected move for the S&P 500 is $62/points. The expected move was breached last week by a wide margin and we’ve already surpassed the expected move in the current week. Given the aforementioned expected move, don’t be surprised if the S&P 500 retraces somewhat and back toward the expected move, upper boundary of 2,694 and with some level of protection being bought by portfolio managers ahead of the G-20 Summit headlines that may break on Friday. That may be at least one of the reasons why the VIX was somewhat stubbornly buoyant on Wednesday while the S&P 500 was surging.
While the market move was a welcome sight on Wednesday and followed a key thesis we’ve been outlining for a rebound in markets that would be driven in part by a “Fed pause”, not every aspect of our rebound thesis was resolved favorably. To reiterate, our rebound thesis is founded on resolution of the following market issues:
- Fed pause, dovish stance and more data dependent than signaled in September.
- Apple (AAPL) share price stabilizes. Apple Inc’s iPhone XR has been the company’s best-selling iPhone model every day since it went on sale in mid-October, a company executive told Reuters on Wednesday.

- Crude oil prices stabilize.
- Some semblance of U.S./China trade negotiations is restarted with little to no escalation of tariff implementation.
Given the aforementioned bullet points that outline our rebound thesis, only 2 of the 4 bullet points found a degree of resolution on Wednesday. The latter bullet points remain unresolved, but look to capitulate near term. On Wednesday, Crude oil did not follow equity markets higher, falling another 3% on the day and with a continued decline on Thursday, below $50 a barrel. Oil falling on Thursday brings losses for the month so far to 23%, marking its largest one-month fall since the depths of the financial crisis in 2008. Market participants are still awaiting an output cut from OPEC, which is likely near-term and should put a floor under the current price of crude oil.
According to Ehsan Khoman, head of MENA research and strategy at the Dubai branch of Japanese bank MUFG, a rather large output cut is forthcoming.
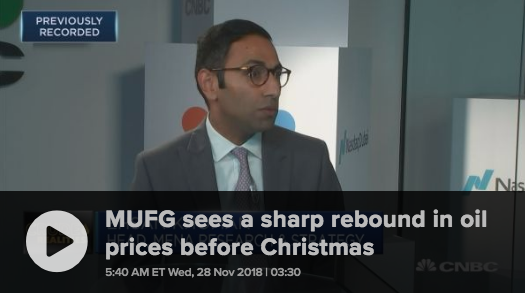
“Saudi Arabia will likely see through the pressure and not entertain calls from President Trump, and in fact lower production,” he said. “The key question now is the size and magnitude of the actual production cuts for each of the OPEC members.
This time around, given the large oversupply we have in the market, we think anything between 1.3 and 1.5 million barrels could come off the market when they meet in Vienna.”
Thursday is one of those “in between” days for the market, pinned after a huge event on Wednesday and before another major event on Friday. Personal Income and Spending data will be released ahead of the opening bell on Wall Street and could prove very relevant to the Fed as it suggests greater data dependency for future rate hike consideration. The expectation is for incomes to rise .4% and consumer spending to have risen .5% in October.
You’re likely to hear and see a great many headlines related to Fed Chairman Powell having “blinked” or caved to President Trump’s recent wrath and expressed disappointment over the FOMC’s rate hikes. Much of these media portrayals and rhetoric is simply sensationalistic reporting and viewpoints. In our opinion, the Fed is doing the right thing and what it always does. The Fed is no less dependent on the market and economic data than it ever has been. The economic data tied to rate sensitive areas of the economy such as autos and housing is said to have a spillover affect into the broader retail consumption-based economy. The Fed doesn’t want that and as such is reacting to the data, not to President Trump and not to Jim Cramer’s ranting and ravings that to some degree, resulted in the market swoon that began on October 9th. Don’t believe us? Check out Seth Golden’s tweet from Wednesday.
Golden has been a critic of Cramer for some time now, but respects the fact that Cramer has such a wide audience and as such the CNBC talking head can and does move markets.
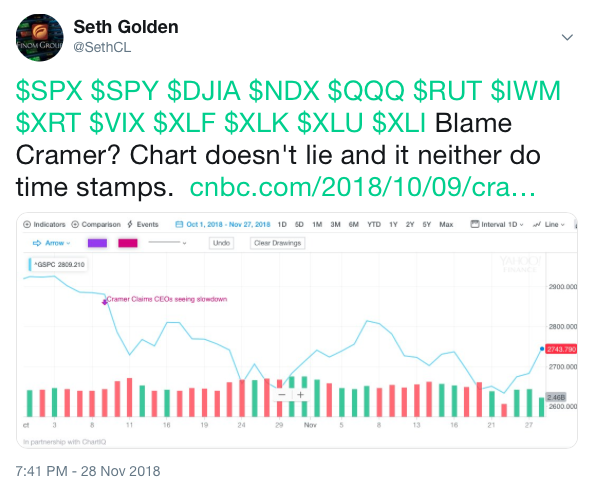
In the tweet positioned above, Golden identified the significant drop from October 9th that coincides with Cramer’s CNBC commentary that suggested his recent conversations with CEO’s stated the economy slowed significantly in recent weeks. Never mind that Q3 GDP has come in at 3.5% and October retail sales grew .8% MoM while corporate earnings grew some 27-28% in Q3 2018 with consumer sentiment near record high levels and business optimism trending in kind with consumer sentiment… never mind all that. Why, because Jim Cramer said he heard otherwise. October 9th and the Cramer rant. You don’t have to love the guy, but you had better pay attention to his rants given his audience size.


