
The Dow Jones Industrial Average hit another fresh record high on Tuesday as it closed 122.73 points higher to 26,773.94. But as the continuation of sector rotation continues in the markets, the S&P 500 closed flat at 2,923.43 while the Nasdaq Composite fell half a percent to 7,999.55 and with the tech sector underperforming once again. With at least one of the major hurdles facing Wall Street overcome in the way of a North American trade agreement, some market watchers are now focused on the tailwinds for the market. CNBC’s Jim Cramer is just one of those market watchers who recently cited 2 market tailwinds that may propel stocks even higher.
In Cramer’s nightly rant on Mad Money, the host offered the first tailwind in the form of a “the cyclical boom in hiring,” as demonstrated by the higher-than-expected employment growth the Labor Department reported in early September.
“When jobs get created, more people can afford to put money away, so they save. And they save, in part, by investing in the stock market. As long as employment continues to grow, this process will keep playing out and it’s hugely positive for stocks.”
The second tailwind for stocks comes in the form of a widespread “stock shortage” coming about as a result of “endless mergers and acquisitions as well as an abundance of corporate buybacks. In 2018 alone, buybacks will reach a record $1trn worth according to Goldman Sachs.
“There’s literally not enough stock to go around. The stock market is a market first and foremost. You tighten up supply, prices are indeed going to go higher.”
As the market hits new highs, bulls and bears will debate the future moves of stocks in perpetuity, outlining their rationale with supporting facts and opinions. Case in point was another recent research note from John Kosar, the chief market strategist at Asbury Research. Kosar wrote that on-balance volume for the S&P 500 has been below its 21-day moving average since September 24. On-balance volume is a measure of stock-market momentum based around volume flow, and Kosar wrote that contracting volume “has historically been a near-term negative” for the stock market.
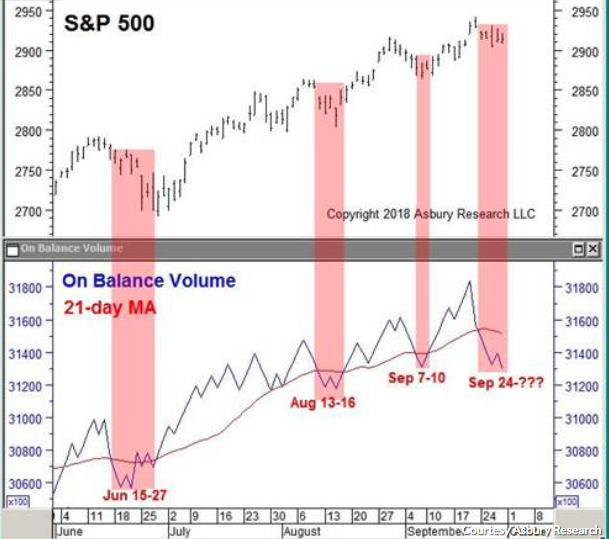
“Contracting on-balance volume “indicates a lack of urgency by investors to buy the S&P 500 as it is making new all-time highs. This is precisely when we should be seeing increasing enthusiasm. This lack of enthusiasm, especially if corroborated by other metrics, could be an early indication of an emerging market top.”
Another concern many market watchers, investors and analysts are watching presently is the noticeable difference in the performance between large-capitalization stocks and small-capitalization companies. The small-caps have been lagging by their largest degree in years. According to S&P Dow Jones Indices, such divergences in the past have preceded market drops. We’ve looked a little deeper into this issue, as the Russell 2000 lags the Dow Jones Industrial Average. What we found in the historical data is a little concerning, but throughout the current bull market cycle history hasn’t been a strong guide.
On Monday, the first trading day of the 4th Quarter, the Dow went up more than 0.7% while RUT fell more than -1.3%, while SPX is above its 200-DMA. This is a rather unusual occurrence but it has happened twice before, in 1989 and 1999-2000. Here is what happened next as outlined in the table below from Thrasher Analytics and Bullmarkets.co.
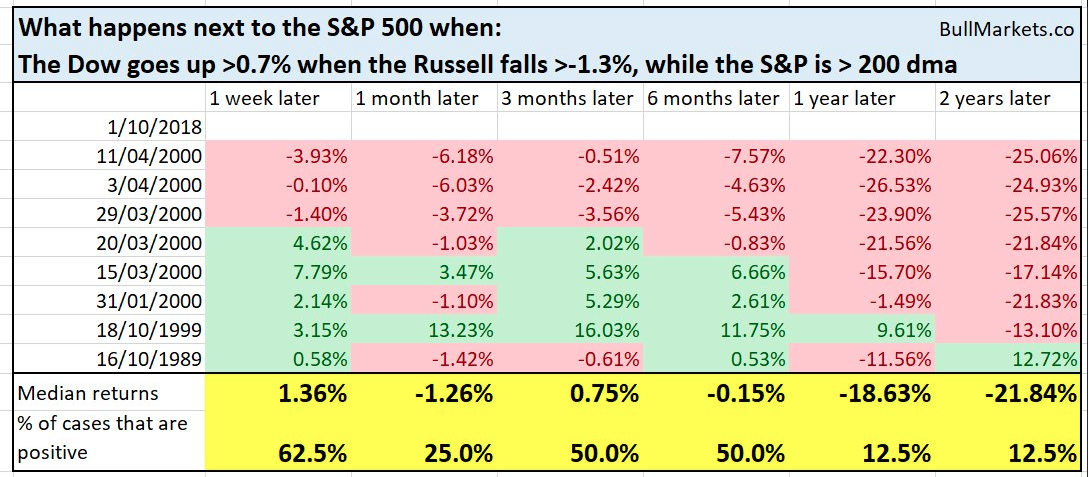
The outcome from the previous occurrences is none too positive, but again, the sample size is quite small. Nonetheless, the Russell 2000 Index continues to underperform with a 1% drop in Tuesday’s trading session. One thing investors shouldn’t overlook or should take into consideration regarding the divergence between large-caps and small-caps is that in previous months, large-caps were underperforming small-caps. As such and given the systematic rotations in the overall market throughout the year, large caps may simply be playing catch-up with respect to market valuation and/or performance. The quantity and quality of sector rotations throughout the year are well understood and recognized in many metrics and forms. One such form is dispersion.
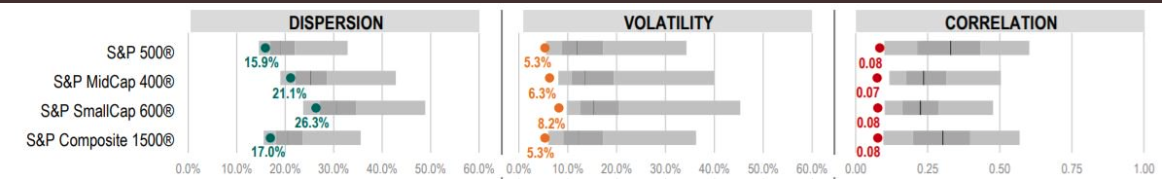
In speaking of market dispersion we can’t help but to recognize results from September. As shown in the following table, Correlation across the board in U.S. equities fell to historic levels in September. Volatility also dropped to a 5th percentile or lower.
Given the equity market YTD performance and the unique characteristics underlying the bull market cycle, there is no logical way to describe the current situation other than “different”. Might we remind investors and market analysts how strong the market was in September, how sell in May and go away failed to be achieved and how complacent markets have been since February and even since the Fed began hiking rates in late 2015. This time is indeed different, but every market cycle is different; it’s just a matter of to what degree this time is actually different.
We mention the Fed hiking in the above narrative given the context of complacent markets and even as the yield curve flattens. The reason for this is because some investors and market watchers are of the opinion that the yield curve can be an indicator for future volatility in the markets. Take a look at the following chart from the crew at Clarity Financial and Jesse Colombo.
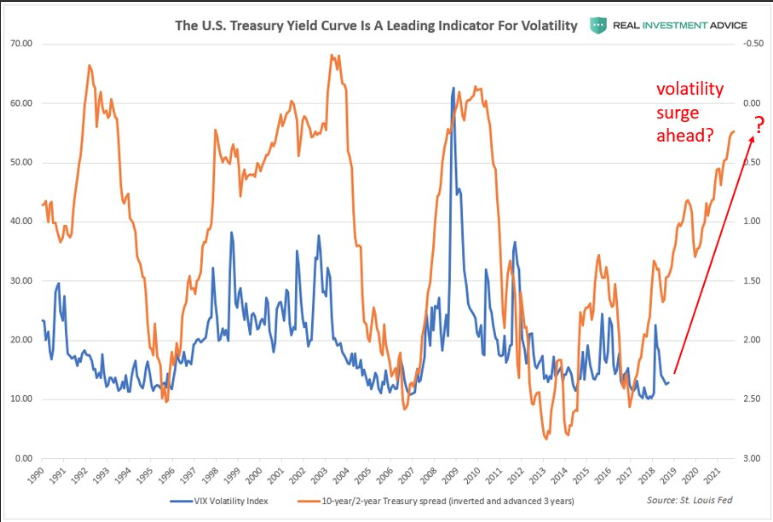
In many of Colombo’s postings and analysis, the cautionary market pundit warns of pending recessions and ominous signals in the market. In this most recent cautionary offering, Colombo discusses the yield curve and how it is possibly signaling another surge in volatility ahead.
“Treasury spread leads the CBOE Volatility Index or VIX by approximately three years. If this historic relationship holds true, we are about to experience a whole lot more volatility over the next few years.”
It’s clear to see from the chart above that when the yield curve flattens, volatility tends to react negatively or with a heightened state of volatility. The next chart, according to Colombo, shows the positioning of the “smart money” and “dumb money” in VIX futures.
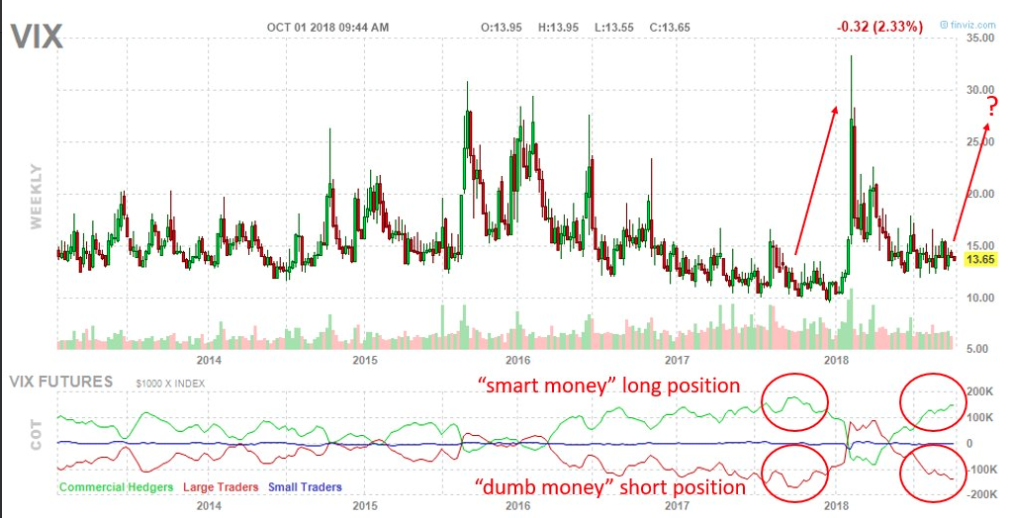
The “smart money”, or commercial futures hedgers are building up another bullish position in VIX futures. The “dumb money”, or large traders have built up a large short position, like they did before the early-2018 volatility spike.
Finom Group has been highlighting the near-term potential for a future spike in volatility in recent research reports to subscribers. Having said that, the degree of a future volatility spike remains in question. There’s simply no efficacy in forecasting for severity of a volatility spike. What is most important is the continued monitoring of metrics and indicators that lend themselves to positioning appropriately ahead of heightened levels of volatility. Moreover, given the fundamental strength of the economy and corporate earnings, a future volatility spike may prove short lived and ripe for the “short-VOL” trade. While Colombo asserts that the “smart money” is building a long position in VIX futures, this type of positioning requires great, precise timing if doing so as a viable trade rather than hedge. This is not the characteristic of smart money and as proven historically in the VIX complex at least, even as a hedge. Timing the market, timing the VIX is smart money? That’s a new one! Smart money in the VIX complex simply waits on a spike in volatility and pounces short, with limited risk exposure as the inevitability ensues, the VIX declining thereafter a spike. Timing the market and the VIX is smart money…does that sound like a good discipline to you?


