
The route on Wall Street continued on Thursday with the major indices extending their losses from Wednesday. The Dow is down roughly 1,400 points in the last 2 trading sessions. The Dow held above its 200-day trend line but closed below its 50-day at 25,995.09.
On Wednesday, the S&P 500 snapped a 74-session string without a 1% move, reflecting the longest such streak since the period ended January. The S&P 500 also tumbled below its 50-day moving average at 2,879.39, and closed below its 200-day moving average on Thursday, for the first time since this past April.
The Nasdaq has seen the largest declines over the 2-day market rout. The selling pressure that began on Wednesday appears to be heavily focused on growth/tech/momentum-type names with the FAANG group falling by 6%, the largest decline for this group since 2012 compared to 3.29% in the S&P 500 and -4.44% in the Nasdaq 100. The Nasdaq extended its tumble on Thursday beneath its 200-day average at 7,500.88. The tech-heavy index will begin Friday’s session at 7,329.
In reviewing the recent sell-off in the major index ETFs, we come to find that this sell-off, although equally as discomforting as the February sell-off, it is quite different.
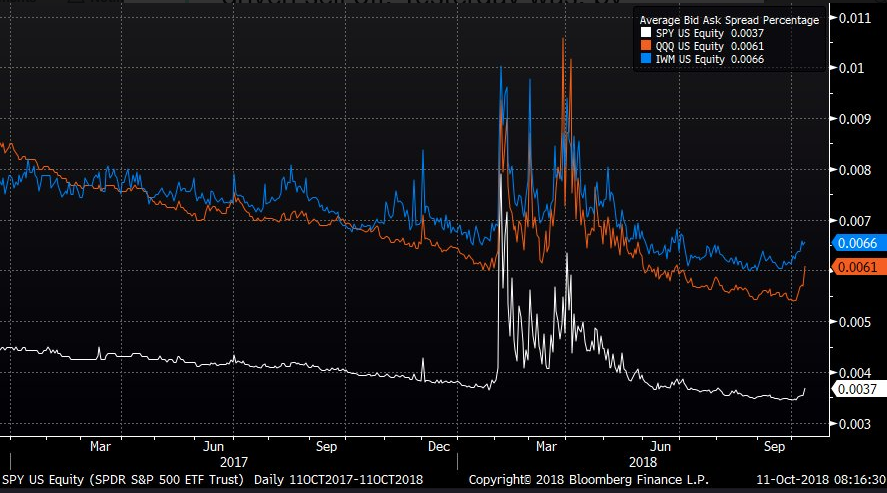
The chart above shows the average bid/ask spread width on the SPY, IWM, and QQQ. The Feb event was a liquidity driven sell-off. Wednesday’s, by comparison, was an orderly selloff. Liquidity appears to have been solid throughout the trading day despite the daily percentage drawdown. It’s not panic selling that we’re seeing and that may be a good sign or a sign of things yet to come.
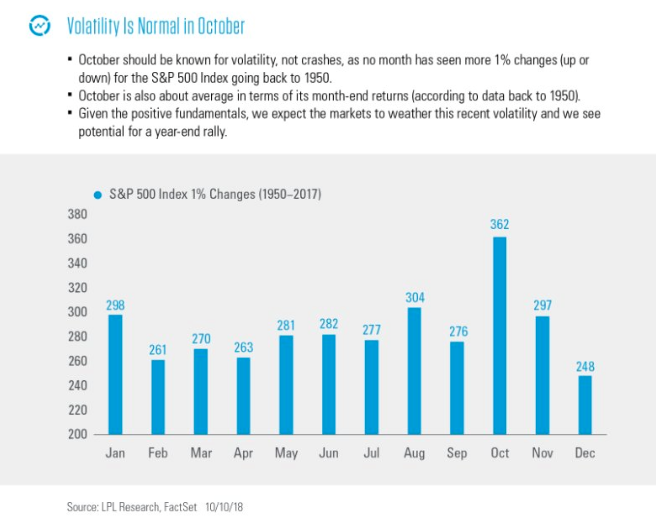
Prior to and through the market tumbling, volatility has been on the rise. After the least volatile Q3 for stocks since 1963, it is important to remember that October is typically the most volatile month of the year for the S&P 500.
It’s also important to consider that 2018 has not been the typical year, not by a long shot. The VIX gained more than 12% to reach an intraday peak of 28.84 on Thursday, marking the highest level for the gauge since Feb. 9 when it hit 29.06, according to FactSet data.
In further examining the rise in volatility of late, yesterday’s activity in VIX options may have signaled that a temporary reprieve was on the way for markets as the Volatility of Volatility Index (VVIX) fell, even as the VIX itself continued to trend higher. VVIX fell nearly 5% on the session while the VIX itself rose. VVIX, with a value above 100, is still signaling heightened levels of volatility, but it usually aids in signaling that volatility is either on the way or peaking near term. In the early Friday morning trading hours, the VIX is down some 8 percent.
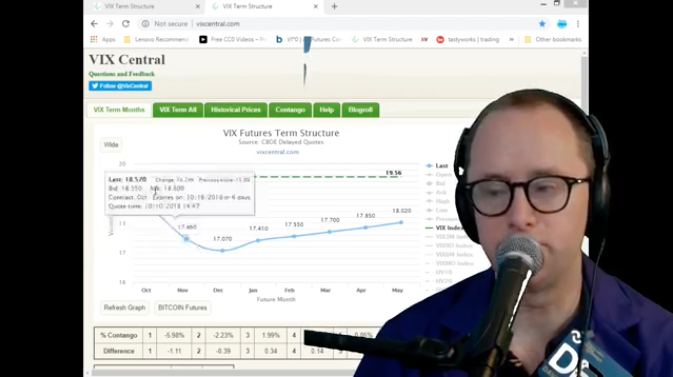
Moreover, when we look at VIX futures we see that term structure has moved from a state of contango into backwardation. For a broad understanding and discussion on what backwardation is and how it occurs, please feel free to watch David Lincoln’s YouTube video on the subject matter.
For a simplistic understanding or definition of backwardation: A market is in contango when forward price of a futures contract is above the expected future spot price, also known as cash price. Backwardation, the opposite of contango, occurs when the forward price of a futures contract is below the expected future spot price. In terms of VIX futures (30-day cycle), the price of the VIX future contract must converge with the spot price upon expiration. If the price is above that of the spot price, it will decay in value onto the spot price, contango. If the price of the VIX future contract is below that of the spot price, it will rise in price to converge with the spot price upon the expiration date, backwardation.
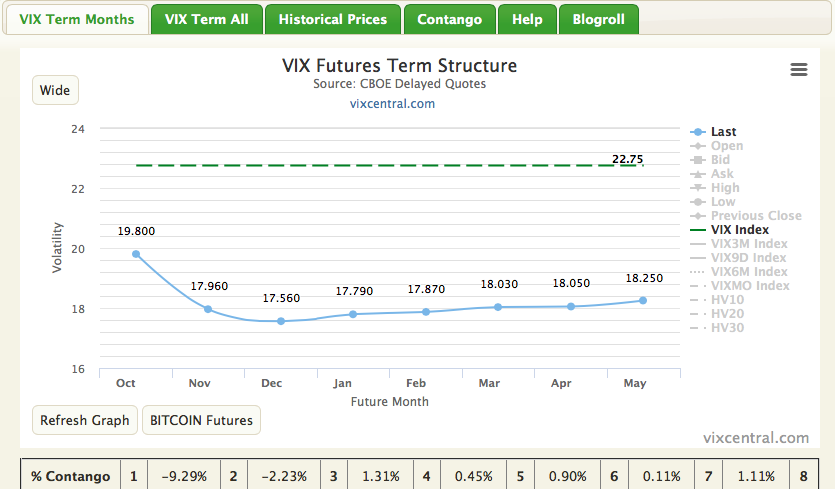
As one can see from the shape of the curve and price of near dated VIX Futures (m1), more volatility is expected in the next several trading sessions leading up to VIX futures expiration next week, than that which is implied several months out. VIX Futures expiration will occur next Wednesday morning. Term structure currently indicates greater than 9% backwardation, whereby if nothing changes in the market between now and Wednesday, will be greatly reduced according to the value of m2 or November VIX futures contracts.
It’s often said by many investors and traders that one shouldn’t short volatility (VIX-ETPs, VIX Options) during backwardation. Finom Group believes this to be an egregious error in participation for the short-VOL trade. If we consider when it would be the optimal time to buy any stock or ETF, when would that be? Naturally, it would be when the price is at its lowest valuation. When would be the best time to short a stock or ETF? Obviously the best time to short would be when the stock or ETF is at its richest valuation. As such, a state of backwardation signals richly valued VIX-Exchange Traded Product pricing and high levels of implied volatility. The caveat that many detractors offer to this logic or rationale is that it’s unknown as to when backwardation could revert to the state of contango, whereby VIX-ETP prices decay in price over time. This caveat or proposition is a misnomer. It assumes that volatility can continue to rise over elongated periods of time, which would maintain term structure in a state of backwardation. As a point of fact, markets simply cannot function in a state of perpetually increasing volatility. Nobody would put his or her capital to invest in such a market. To further that point; bull markets are 3-4X longer in duration than are bear markets. Additionally, contango is present in term structure 90% of the time while backwardation is present roughly 10% of the time. Having said all of that, it is true that the proposition of shorting volatility during backwardation demands great liquidity, more careful positioning and more mindful participation. But make no mistake about it, shorting during what is always a short-lived, richly valued period of backwardation for implied volatility and VIX-ETP pricing, delivers the greatest return on capital. Just don’t do it alone! Moving on…
Overnight, Asian markets rebounded from their Thursday losses on the heels of better than expected Chinese trade data. China recorded a record trade surplus of $34.13 billion with the U.S. in September amid intense trade tensions between the world’s two largest economies. The September surplus with the U.S. was larger than China’s overall trade surplus of $31.69 billion for the month. For January-September, China’s trade surplus with the United States was $225.79 billion, compared with about $196.01 billion in the same period last year, Reuter’s calculations showed.
Overall, China’s dollar-denominated September exports surged 14.5 percent from a year ago, beating a Reuter’s analyst poll forecasting 8.9 percent growth in the same period. In August, Chinese exports grew 9.8 percent from a year ago. Not everyone is as optimistic about the data. Some economists are of the opinion the data shows a great deal of frontloading or pulling forward of orders in light of the trade dispute between the U.S. and China that is ongoing.
“With global growth likely to cool further in the coming quarters and US tariffs set to become more punishing, the recent resilience of exports is unlikely to be sustained. Meanwhile, with policy easing unlikely to put a floor beneath domestic economic activity until the middle of next year, import growth is set to slow further,” said Julian Evans-Pritchard, senior China economist at Capital Economics, a consultancy.
That brings us to a strong rebound in U.S. equity futures Friday morning. While CNBC’s Jim Cramer was ringing the warning bell on Tuesday and prior to the 2-day market sell-off, he was sounding the dinner bell after the market closed on Thursday.
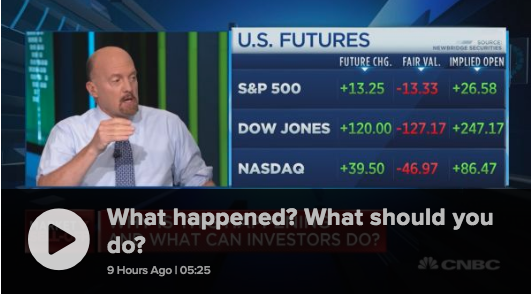
“I saw that whoosh happen,” Cramer said, referring to the market breakdown in the afternoon. We are oversold. The time to really be aggressive in selling happened. If we get anything good out of China … or if we get any news that [Fed Chair Jerome] Powell agrees with my view, we’re going to say why didn’t we do some buying.”
We’d like to caveat Cramer’s BUY recommendation on the market by stating that nothing has changed from Wednesday to Friday other than sentiment and valuations. While Friday may find equity markets in rally mode, investors should still choose to buy in a disciplined manner. Let’s face it; the concerns over the last couple of days haven’t been washed away by valuation or just because the major averages have exacted a 5% pullback and more. Let’s review some of the causation of the recent pullback to ensure, if found buying equities, they’re being bought for the right reasons. Some of the more recent market anxiety has been caused by considering the following:
- Rapidly climbing bond yields, which gain as prices fall, have fueled fears that profit margins of U.S. corporations may be squeezed by higher labor costs and loftier borrowing expenses. Housing may come under pressure as rising borrowing costs and steeper down payments impact affordability and the lending business of financial institutions.
- Some argue that investors are shifting from growth-fueled strategies to value shares, which have been out of favor as shares of growthy, techy companies have soared. Investors tend to turn to overlooked value companies in the later stages of an economic cycle, before a recession.
- Global Trade war is ongoing, elevating since the 1st quarter and proving to impact certain aspects of the economy/industry.
While there is probably a longer laundry list of rationale for the recent market pullback and the bullet points offered can be offset by equally positive reasons to buy equities, let’s just agree that there are always market concerns, always. This is why having a longer duration for investing is prudent investing. For the sake of argument, however, let’s take a look at the argument concerning the potential ominous signal for the market as investors have sought out value vs. growth stocks.
For each time investors seemingly favor value over growth stocks, the media and analysts make a big deal of it, suggesting that it heralds a bear market or even a recession. This is the third time this year that S&P Growth has underperformed S&P Value by over 2% in 3 days. Again, this is the 3rd time, not the 1st time, as shown in the chart below from Bespoke Investment Group.
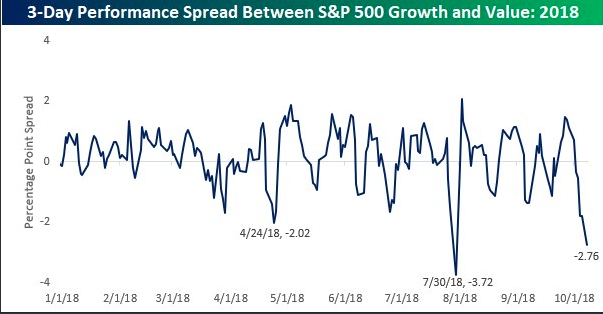
Investors shift and rotate in and out of sectors for all sorts of reasons. It happens every year and may be more a sign of a pending pullback than an end of a bull market. What has happened after each value over growth rotation is obvious however, the extending of the bull market cycle.
With the final day of the trading week set to begin, investors will be awaiting quarterly results ahead of the market open from some of the big banks. Here’s what investors can expect from the reporting:
- JPMorgan (JPM) is expected to report per-share earnings per share of $2.26, up from $1.76 in the same period a year earlier. Revenue is expected to come to $27.5 billion, compared with $26.2 billion a year ago.
- Citigroup Inc. (C) is expected to report earnings of $1.68 a share, up from $1.42 a year ago. Revenue is expected to come to $18.5 billion, up from $18.2 billion a year ago.
- Wells Fargo and Co. (WFC) is expected to post EPS of $1.19, up from 84 cents a share a year ago. Revenue is expected to come to $21.8 billion, compared with $21.9 billion a year ago.
Depending on not only the strength or weakness of the individual bank reporting, but also the conference call commentary concerning loan growth and the economy, the market will likely respond in kind with the commentary offered. The financials have been under heavy pressure over the course of the week and could ignite the market rebound or plunge it into a full-blown correction (measured by a SPX pullback from its peak of 10%).
As Jim Cramer signaled for “buy the dip” to resume today another CNBC talking head suggests the same. Reformed Broker’s Josh Brown says savvy U.S. investors are not for scaring.
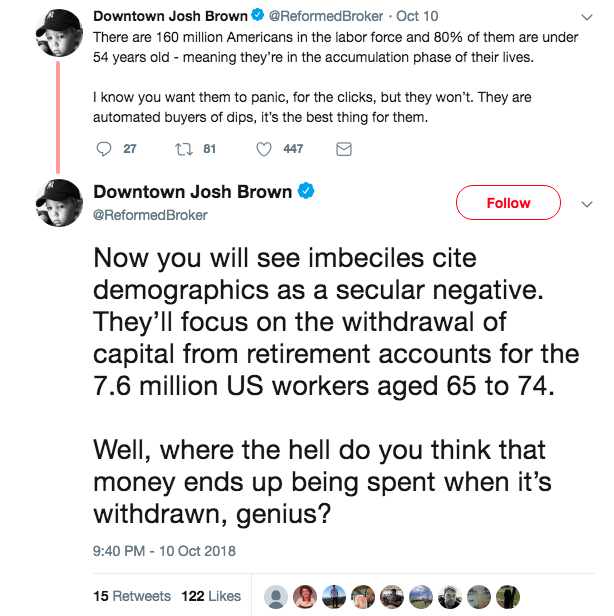
“Americans have accumulated $28.3 trillion in retirement assets, 19% of which is in 401(k) accounts ($5.3 trillion). There are 550,000 plans and 54 million participants. These dollars are coming in every month, the lower the prices for stocks, the better,” said Brown in a wee-hours tweet-rant, as he adds: “F****ing bring it.”


