
It’s now official; the global equity route is at-hand! In the U.S., the Dow (DJIA) tumbled 831 points, the Nasdaq (NDX) fell 316 points and the S&P 500 (SPX) fell 95 points on Thursday. The route on Wall Street only resulted in even greater losses in Asian markets overnight, with the biggest percentage loser coming from the Shanghai Stock Exchange, which fell some 5.5% overnight. European markets are extending their losses from Wednesday and in pursuit, U.S. equity futures are sharply lower once again.
Yesterday’s market action may produce a greater pullback than most had previously considered given the stretch of bullish market activity since April and in light of more recent acceptance of the Fed’s mandate on inflation. It’s been known for some time now that the Federal Open Market Committee desired to “normalize” rates. As such, they’ve outlined a path toward normalization that would include 4 rate hikes in 2018 and 3 rate hikes in 2019. Up until now, that 4th rate hike has looked like a forced, but accepted measure. In other words, the market would accept it assuming economic growth and corporate earnings stayed on course. Outside of the Fed’s control, however, there are rising fears concerning the economic outlook. We raised this subject matter in Wednesday’s daily market dispatch titled Cramer Warns of an Economic Slowdown.
Certain sectors of the economy have showed signs of slowing over the last month or so, even as they are growing YOY. It remains to be seen whether or not this slowdown is the typical intra-year slowdown that coincides with the period leading up to the holiday spending splurge by consumers, or something more meaningful and correlated to rising rates. At Finom Group, we’re not of the opinion that the slowdown in Housing or Autos is something that will pervade throughout the economy. Housing prices are rising along with interest rates, making affordability tougher on entry-level homebuyers. And with that, there is a lacking of inventory that has persisted for several years, also prolonging the “sellers market” environment. Autos are still averaging a 17mm monthly unit sales rate and for the 4th straight year, the longest stretch in history. But as interest rates rise, so does the monthly payment for consumers. Simply put, there are sectors of the economy that have slowed, but not died and not dipped into a recession. Higher rates are performing normalization on certain aspects of economic activity. Of course, when we throw tariff related costs for materials into the equation, the wholesalers have a more profound issue to contend with regarding profits. And that is where the Fed may find its “room for cover”.
The problem for the Fed in its efforts to normalize rates is somewhat related to cognitive dissonance and somewhat related to holding rates too low for too long a period. So now what? Well the Fed can’t and won’t be able to ignore the equity market activity, despite what it or others might say. The Fed has three options:
- Continue their pursuit of higher interest rates
- Return to a more accommodative policy of cheap credit
- Try to steer a course between no. 1 and no. 2.
Bullet point No. 3 is what they have been doing until more recently. No. 1 will be followed until the market screams to the degree it can’t ignore. The market, again despite popular rhetoric, is a measure of the economy; they go hand-in-hand over time. As such the Fed is not really reacting to the market but the economy. This is logical and a more valid reason for the Fed to act. And with that said, we would suggest investors continue to monitor not just the equity market through the coming weeks and up until December, but also the FedWatch Tool, which prices the probability of a future rate hike.
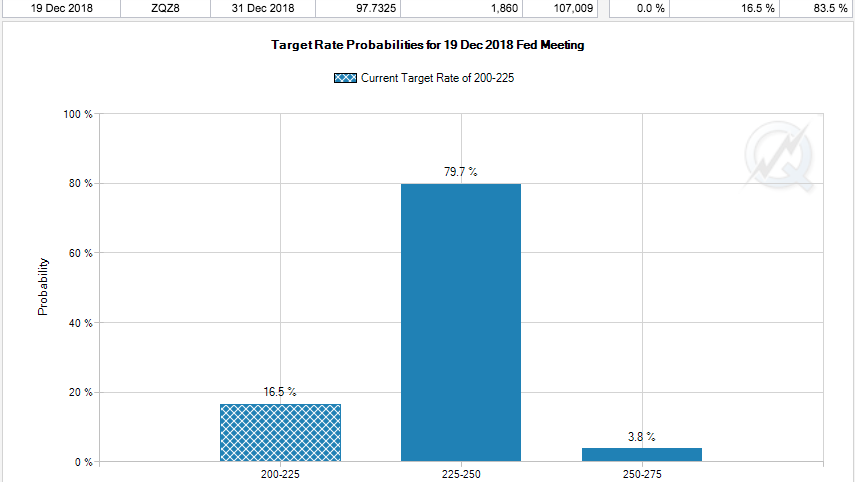
With Thursday’s market route, the December Fed contracts dove 5% from 79.7% to 75% intraday. We would expect, if the current equity market decline persists and doesn’t rebound within the next 2-3 weeks, December Fed contracts will continue to express a lesser probability of a December rate hike.
We want investors to keep a couple of things in mind as the current market pullback carries forward into Thursday’s trading session:
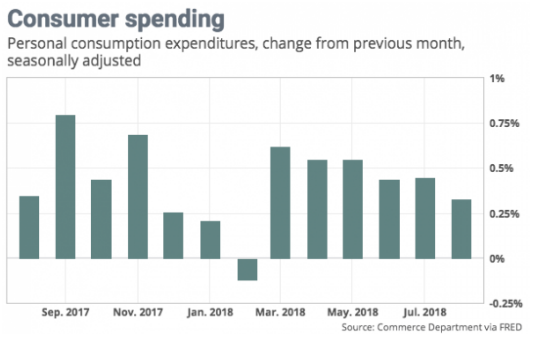
- Although interest rates are climbing, they are proving to be easily managed by consumers as wage growth is taking hold. The demand side equation of the economy is healthy. The consumer is simply savvier than in the past and proving so with a more reasonable and healthy debt/income ratio. In other words, the average household can afford to spend more, they are simply making better spending decisions and corporations will have to adjust to the consumer spending habits. We still are awaiting the latest, September consumer spending data, but in august Consumer spending rose 0.3%, the slowest pace since February, the government said Friday.
- The economy and market performed very well with lower wages and higher interests rates during the previous economic expansion (2003-2007). Moreover, the real Fed Funds rate is still near zero.
The market and investors have, to some degree, suffered all year from bouts of rate normalization as reflation takes hold. This is a normal expression of the dynamic that investors find themselves in as they assess risk in terms of valuation and as rates rise. But true inflation, measured by a rise above previous cyclical highs has not been achieved and is unlikely to in our opinion. So let’s look at some measures of inflation released just yesterday.
The BLS released September Producer Price Index numbers. PPI has been gradually accelerating since late 2015/early 2016, but recent months saw PPI begin to slow by its headline measure. The headline PPI decelerated again last month down to 2.73% YoY from 2.83% the month before.
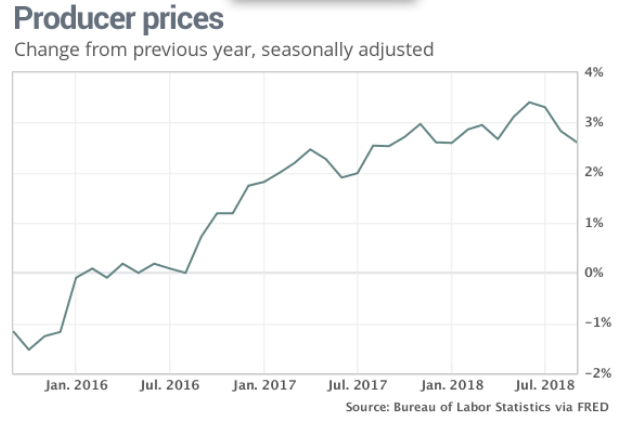
This continues a trend over the past few months of the headline measure surprising lower. Meanwhile, Core PPI which removes food and energy accelerated slightly to 2.48% YoY from 2.4%. A more refined measure of PPI excluding foods, energy, and trade services increased the most, up 3.02% YoY compared to 2.84% in August. This is the first time this measure of core PPI has been higher than the headline number since June 2017. On the whole, PPI is significantly higher than say 3 years ago, but still negligible in terms of hindering or even curtailing demand in the economy.
Today’s CPI will prove to further shed light on the inflation picture in the U.S. economy. The release of the economic data is set for 8:30 a.m. EST. Expectations are for a rise of .2% month-over-month. Weekly jobless claims are also set to be released Thursday ahead of the market open.
Thursday’s equity market decline brought about a severe rise in volatility, with the VIX rising some 40% on the day and above 22 percent. Investors should find themselves respecting what the market is saying or delivering. In both good and bad times, the market can remain irrational longer than one thinks. The market had an elongated, complacency streak. Before Thursday’s S&P 500 3%+ decline, the benchmark index had gone 74 consecutive days without closing up or down at least 1 percent. (See chart below)
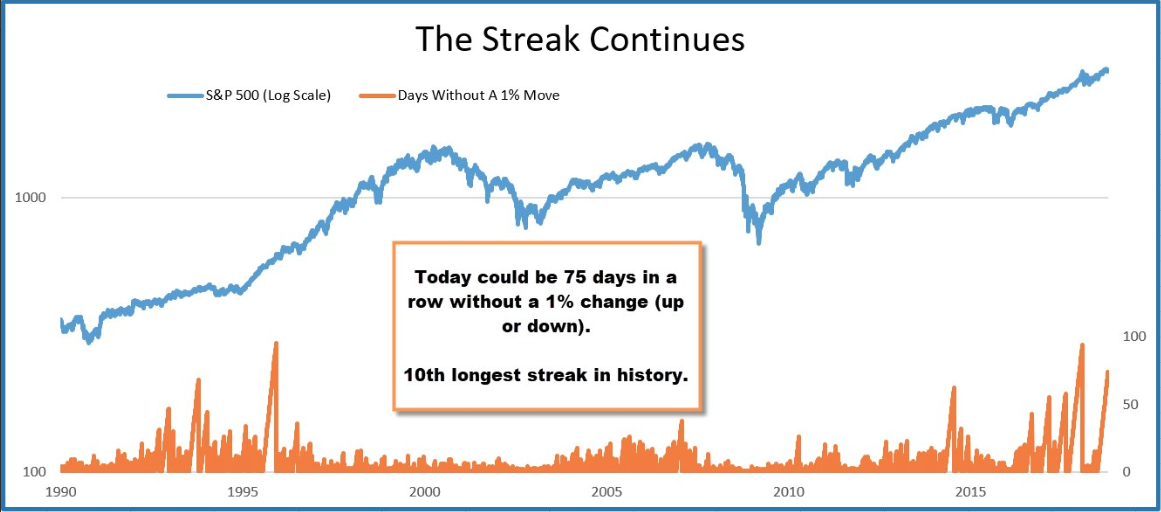
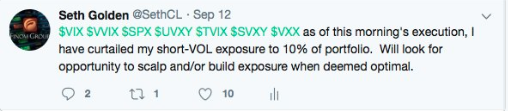
A 75th day without a 1% close was not achieved, obviously! The VIX’s rise yesterday was the greatest bout of volatility since February. Finom Group’s chief market Seth Golden strategist was well out in front of the potential rise in volatility. In more recent reports and articles, he had diagnosed VIX dispersion as being a potential indicator for a future rise in volatility.
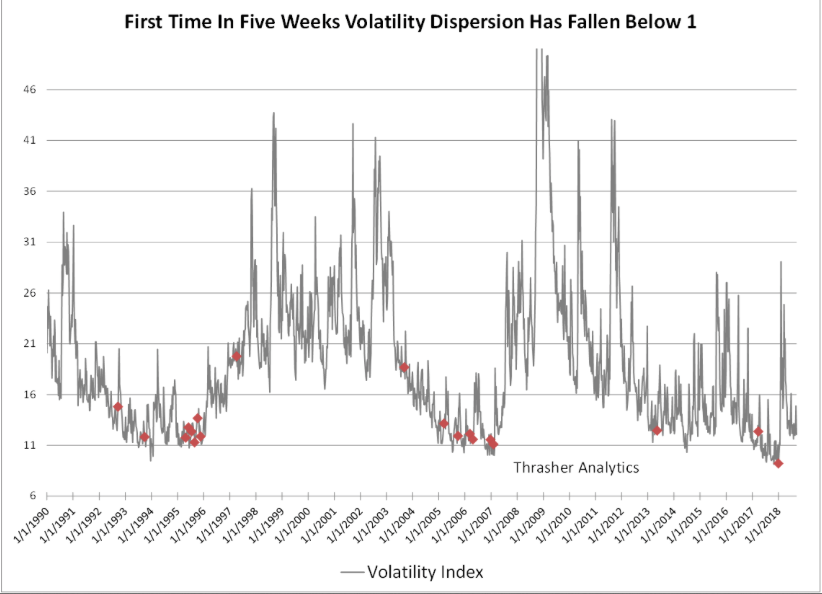
More publicly, Golden had reduced his typical short-VOL strategy/portfolio exposure in early September (Tweet below). Having built a large core short-VOL position through the February “Volpocolypse” event and carrying that position since and through the complacency that has persisted in the markets, his reduced exposure proved prescient.
Additionally, with the recent rise in volatility, Golden’s forecast for volatility barbells has come to fruition. Back on July 10th, in a report to Finom Group subscribers he offered the following forecast for the VIX in a report titled VIX Trading and Complex Trading Fundamentals.

So what’s next for equities and the VIX? Golden believes the market is going through a normal period of adjusting to rising rates, input costs and the rationalizing of demand… as it always does during such periods and as it did in February-March.
“The economy is strong despite what you might hear in headlines. If it has slowed to some degree, it will pick up again come the all-important holiday period. This is actually the typical slowdown that portends a strong Q4 period. Remember, the consumer didn’t have the extra cash they do this year, a year ago. Tax cuts, rising wages and the extremely low level of unemployment are all positive factors for the upcoming holiday period. We’ve haven’t, even with interest rates higher than they are now, seen forecasts so strong for holiday spending in quite some time.”
In terms of holiday retail sales we have to turn to the National Retail Federation forecast. Fortunately, they just came out with their forecast for holiday retail sales on October 3rd. The National Retail Federation expects holiday retail sales in November and December, excluding automobiles, gasoline and restaurants, to increase between 4.3 and 4.8% over 2017 for a total of $717.45 billion to $720.89 billion. The forecast compares with an average annual increase of 3.9% over the past five years.
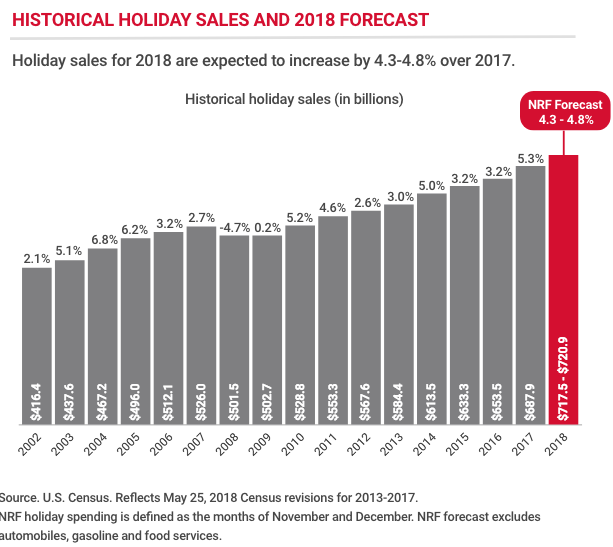
Keep in mind, the NRF is almost always wrong and almost always undershoots the actual retail sales growth rate. Take a look at last year’s forecast delivered by the NRF prior to the holiday retail sales season.
“The National Retail Federation announced today that it expects holiday retail sales in November and December – excluding automobiles, gasoline and restaurants – to increase between 3.6 and 4 percent for a total of $678.75 billion to $682 billion, up from $655.8 billion last year.”
We can see from the table of holiday retail sales above that the NRF greatly under forecasted 2017 holiday retail sales. Holiday sales in 2017 totaled $687.87 billion, a 5.3% increase over the year before and the largest increase since the 5.2 percent year-over-year gain seen in 2010 after the end of the Great Recession. The current forecast is a median of .5% higher than last year’s forecast.
With that said, we can’t sound the “all clear” bell and assume dip buying will resume today. We do, however, anticipate the current pullback to express a trough near-term, within the next week or two and as earnings season kicks into high gear. Have your shopping list of stocks and/or ETFs ready to go. There’s nothing wrong with a market pullback that is rationalized for valuing the forward PE of the S&P 500 against a backdrop of rising rates. And here we are again, with the market doing just that very thing.


