
Investors bore the brunt of President Trump’s announced $200bn trade tariffs on China, set to go into affect as early as September and after a review period. All three major indices fell on the day, but outperformed their global equity market peers by falling less than 1% across the board. Although China has vowed to defend it’s trading practices against the implied tariffs from the U.S., the nation has yet to outline retaliatory measures.
The trading mood on Thursday morning may have been getting a boost from signs the U.S. and China are willing to resume trade talks, which could end up in a bilateral agreement. Bloomberg reported late Wednesday that officials from both countries have raised the prospects of restarting a conversation at a high level. With that, Asian markets did bounce back strongly overnight, led by a surging Nikkei and Shanghai stock exchange. Coming into Thursday, U.S. equity futures are rebounding along with European markets and ahead of critically important bank earnings on Friday.
On the economic data front today, CPI inflation data for June are due at 8:30 a.m. Eastern Time, seen as the most important release on Thursday. Economists polled by MarketWatch expect consumer prices to have risen 0.2% month-on-month in June. Yesterday’s Producer Price Index was hotter than expected as described in the press release below, boosting the prospects for future Fed rate hikes.
The Producer Price Index for final demand rose 0.3 percent in June, seasonally adjusted, the U.S. Bureau of Labor Statistics reported today. Final demand prices advanced 0.5 percent in May and 0.1 percent in April. (See table A.) On an unadjusted basis, the final demand index moved up 3.4 percent for the 12 months ended in June, the largest 12-month increase since climbing 3.7 percent in November 2011.
In June, most of the rise in the index for final demand is attributable to a 0.4-percent advance in prices for final demand services. The index for final demand goods edged up 0.1 percent.
Prices for final demand less foods, energy, and trade services moved up 0.3 percent in June after rising 0.1 percent in May. For the 12 months ended in June, the index for final demand less foods, energy, and trade services climbed 2.7 percent.
The recent set back in the prior 4-day rally for equities has come with sentiment drying up and turning lower. The chart below is a composite “investor sentiment” index concerning how investors “feel” about the current investing environment.
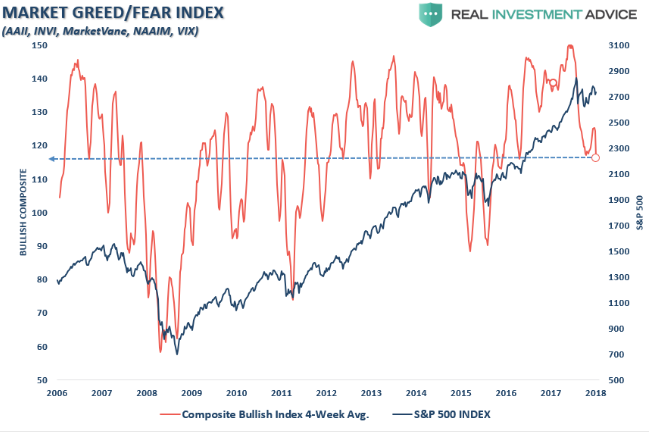
The recent rally clearly isn’t found with confidence amongst investors as shown in the right-hand portion of the chart, where the S&P 500 has risen in 2018, but investor sentiment has precipitously dropped. This has resulted in a very broad trading range for which the S&P 500 has been stuck for much of the trading year. Regardless of the lack of confidence in the equity market to date, investors have still been willing to not only put more capital to work, but they’ve largely ignored some of the more compelling macro-factors on trade. One could characterize the current state of U.S. equity markets as being found with investors who fear missing out on the upside more so than actually losing capital/money. Lance Roberts of Real Investment advice describes it as the tug-of-war between F.O.M.O and F.O.L.M (fear of missing out vs. fear of losing money). If the bulls can “trump” the bears after the latest trade spat escalation, it would go a long way toward proving that optimism also beats pessimism in the market.
Market seasonality hasn’t played out in 2018 as history and colloquialisms have many assume. Sell in May and go away hasn’t worked out for some 6 years now, even though the colloquialism mainly speaks to the totality of the May-September period.
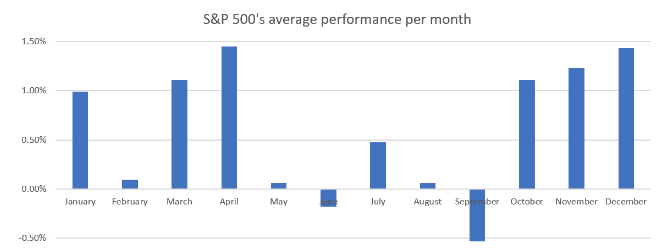
This is because this is usually the worst performing period for the market on the whole of the calendar year, historically speaking. That doesn’t mean all months within the period are down historically, but rather they underperform other periods of the year. But when we review what happens as markets perform positively from April, May and June, as the market has done in 2018, here’s what investors might expect as history suggests.
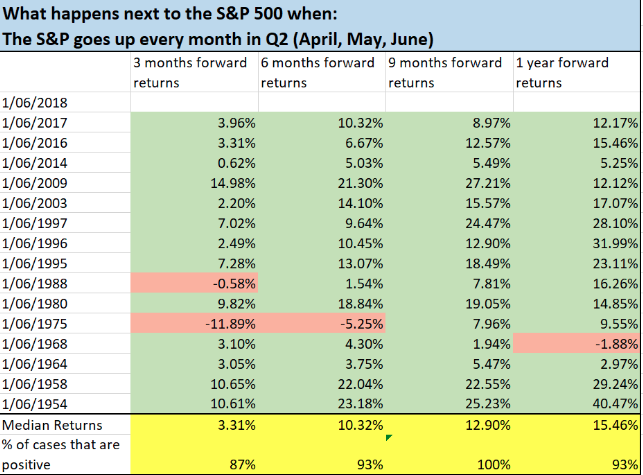
As shown in the chart above by Troy Bombardia, when the stock market goes up in April, May, and June, it tends to go up throughout the entire Q3 period. This bodes well for 2018, but history has never been impacted by the variables impacting today’s global and, more importantly, U.S. equity markets. As such, we’ll have to see if the more closely followed performance of the past proves an accurate guide for the Q3 2018 period.
It remains to be seen as to whether or not investors can maintain the dichotomy of capital deployment versus actual sentiment as price volatility has risen year-over-year. Macro headlines surrounding tariffs have been troubling with most analysts suggesting a trade war is more imminent than avoidable at present. Having said that, there is roughly 2-months worth of negotiating to find amicable resolutions for all national interests.
With trade fears abound, Tony Dwyer of Canaccord Genuity offered his recent thoughts on CNBC’s Fast Money show last night. Dwyer addressed trade war vs. earnings in the interview. He suggests buying equities into weakness unless the economy is expressing a recession or earnings turn negative. For the most part
When questioned on whether or not investors should fear trade wars he offers that tariffs at the end of August do not change his view unless they have the power to turn earnings negative for the whole of the S&P 500, which is extremely unlikely. Tony’s bigger concern is what the yield curve inverting offers. Having said that, he points out that once the yield curve inverts, there is still historically a 21% median gain over the next 18 months.
As it pertains to that all-important and historic recession indicator, the inverted yield curve, famed economist Ed Yardeni recently wrote That flawless predictor of recession and a bear market is wrong this time. The article and research is fundamentally sound in rather inarguable. It identifies, as Finom Group has been suggesting for the better portion of 2018, this time is truly different. We encourage all of our members and audience to read the article. Piggy-backing on Yardeni’s research and articulations, we also remind readers that the Federal Reserve Open Committee members, along with Fed Chairman Jerome Powell, have adopted a new measure of indicating a recession through the yield curve.


