Welcome to another trading week!! In appreciation of all of our Basic membership level participants and daily readers of finomgroup.com content, we offer the following excerpts from our Weekly Research Report. Our weekly report is extremely detailed and has proven to help guide investors and traders during all types of market conditions with thoughtful insights and analysis, graphs, studies, and historical data/analogues. We encourage our readers to upgrade to our Contributor membership level to receive our Weekly Research Report and State of the Market Videos and take advantage of this ongoing promotional event today before our membership fees rise in the month of June! Have a great trading week, be in touch and take a look at some of the materials in this weekend’s published Research Report!

Research Report Excerpts #1
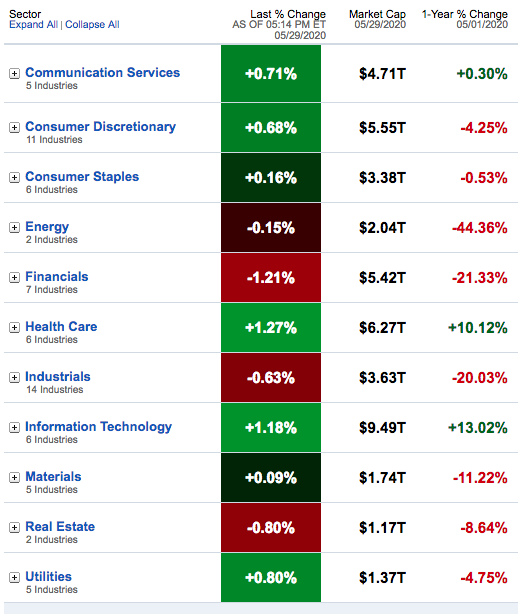
This is an awesome table from Fidelity above, updated daily and indicating the 1-day, 1-year percent change and market cap for each S&P 500 sector! As we can see, the Energy sector’s market cap is somewhat inconsequential to the index itself, as it has seen its market cap decline some 44% over the last year and now is barely holding $2trn in market cap.
- The Financial sector is more meaningful as it is one of the most heavily weighted sectors within the S&P 500, forcing investors to recognize its relevance for the market to maintain its current path.
- Financials won’t determine the S&P 500’s outcome, as Information Technology, Health Care and Consumer Discretionary remain the strength of the index, but Financials lend support to the index.
- If Information Technology stocks falter or consolidate, without the Financials supporting the market, this could find the S&P 500 correcting more so than if Financials are found with a stronger performance.
- Know your sector weighting and structure of the S&P 500 as it helps to identify why the market has seemingly defied all odds during this self-induced pandemic recession.
Research Reports Excerpts #2
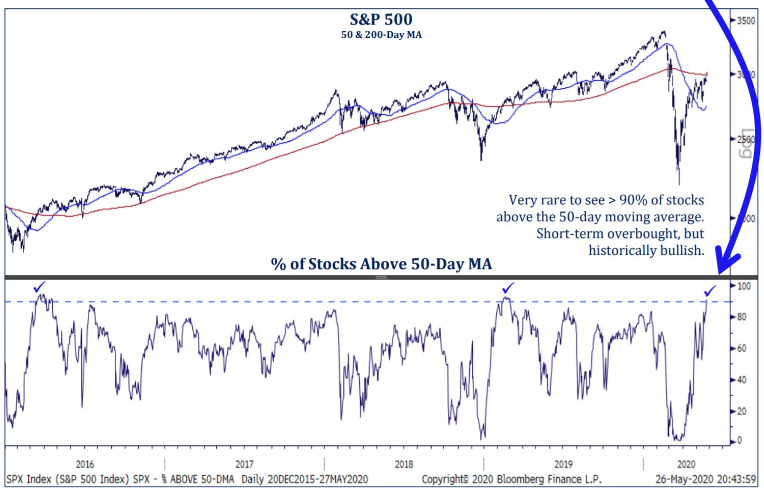
The chart above hones in on the same breadth indicator under examination. The S&P 500 is the upper panel and the % of stocks above the 50-DMA is the lower panel. Off to the left side, lower panel, we can see the breadth surge above 90% and yet the S&P 500 only mildly corrected in June, largely due to the Brexit vote.
Based on all the aforementioned, the bull market is confirmed, but it does suggest the market is overheated on a near-term basis. Investors should keep an open mind and anticipate some degree of turbulence ahead. Nonetheless, we don’t deny that the percent of stocks trading above their 50-DMA is a good long-term indicator of returns out 12 months
Research Report Excerpts #3
For most of 2017, the average number of E-mini contracts available to be bought or sold within a tight band around their current price, corresponding to a one-point move in the S&P 500, hovered between 3,000 and 6,000, Deutsche Bank data show.
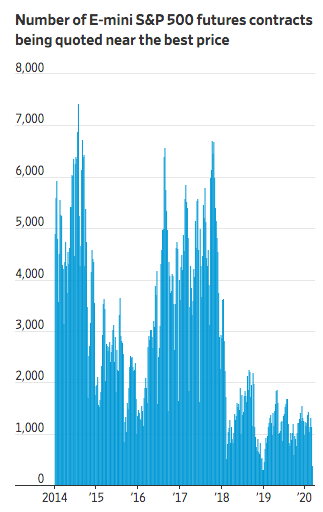
But over the past two years, that number has rarely climbed above 2,000 contracts. During the first week of March, it fell to just 163 contracts, down more than 80% from the final week of February before slipping even further, to 132 contracts.
The term “liquidity” refers to the ability to execute a big trade without affecting the price of an asset. In layman’s terms, lower liquidity means that when a wave of selling or buying hits a particular market, prices drop or rise more sharply than they would have otherwise. In the case of the E-mini, heavy volume in either direction have a knock-on effect on the stock market itself, and on investors’ portfolios. The trend exacerbates!
Research Report Excerpts #4
Given the unprecedented market expressions of 2020, bull to bear to new bull market, history may not prove to repeat seasonal patterns. As such, we encourage thinking more about the long-term path for the market when making decisions about capital allocation. With that being said, the following chart from BofAML looks at more than just the month of June. Going all the way back to 1928, which may skew some of the data, the next 3 months of the year tend to produce the 2nd greatest returns, next to the 4th quarter.

Research Report Excerpts #5
Let’s not forget that U.S. unemployment is ~20% right now, and not everyone is collecting enhanced Unemployment Insurance checks. In fact, employers can reasonably expect to have many job applicants in the coming months. That leverage only works, however, if there are people searching for work right now. Looking at Google search volumes for a variety of COVID Crisis-affected service sector jobs, we can see if that was the case:
#1: A comparison of Google searches for “retail job”, “restaurant job”, “hotel job” and “bar job” over the last year.

- Interest has picked up to about half of normal levels over the last month as more US states reopen their economies.
- The top three states searching for each query: “retail job”: Mississippi, Arkansas, Kansas. “Restaurant job”: New Hampshire, Utah, Rhode Island. “Bar job”: Wisconsin, Missouri, Pennsylvania. “Hotel job”: Hawaii, Iowa, Oklahoma.
- Most of those states have started reopening their economies, some even already allowing dine-in or outdoor dining at restaurants over the course of May. The two exceptions: Pennsylvania will allow outdoor dining statewide soon on June 5th, while restaurants in Hawaii can reopen on June 1st.
Bottom line: demand for service sector jobs is increasing right now, so currently furloughed/laid off workers face potential competition from others who would take a job today. If called to return to work, the employee will have to consider the very real possibility that if they decline or try to defer their job will not be there later at a later date. Also consider that tens of thousands of retail/leisure/hospitality workers are unemployed and may not have unemployment insurance; this will only increase demand for service sector jobs in the months to come.
Research Report Excerpts #6
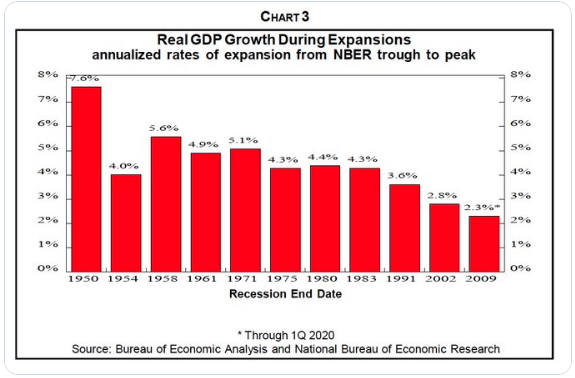
Average real GDP growth in the U.S. from the post-Great Financial Crisis expansion was just 2.3 percent. However, the slower the recovery seems to prove the longer the expansion cycle. The longest expansion in U.S. history ended in February at 128 months (10+ years).

Research Report Excerpts #7
The consumer’s household debt to income ratio and percent of disposable income against monthly debt service payments was in the best shape since the 1970s. Consumer deleveraging lasted through the entirety of the former expansion cycle, aiding in the slowest but longest expansion cycle since WWII.
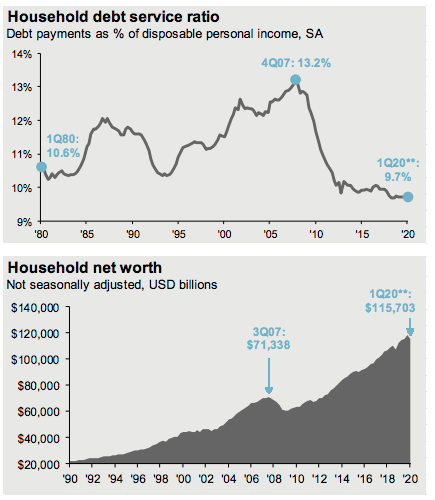
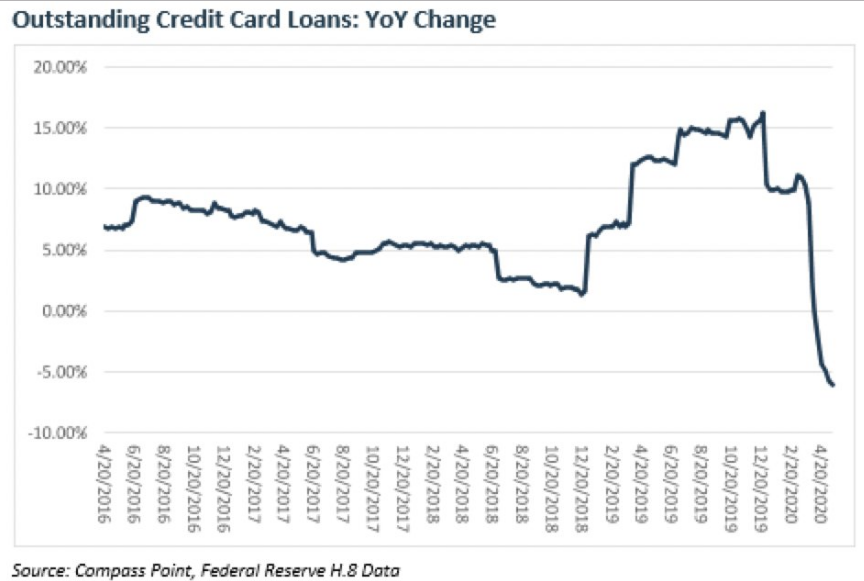
And it doesn’t look like this behavior has changed based on recent data. Even as many U.S. households are now part of the unemployed base of consumers, they are using relief aid to pay down credit card debt, while consumption wanes.
Research Report Excerpts #8
It was weird to see the S&P 500 performing so well while down volume was so high through much of the session on Thursday, but that also proved to falter rather quickly as headlines broke about President Trump’s China press conference to come on Friday. Regardless of Thursday’s high TRIN reading and despite the late post-press conference rally in the S&P 500 on Friday, TRIN finished near its high with another high close on Friday. Its 20-day average, in fact, has now eclipsed the 1.25 level. If you compare this move to early 2019, the TRIN 20-day average never reached this level during the rally off the low.
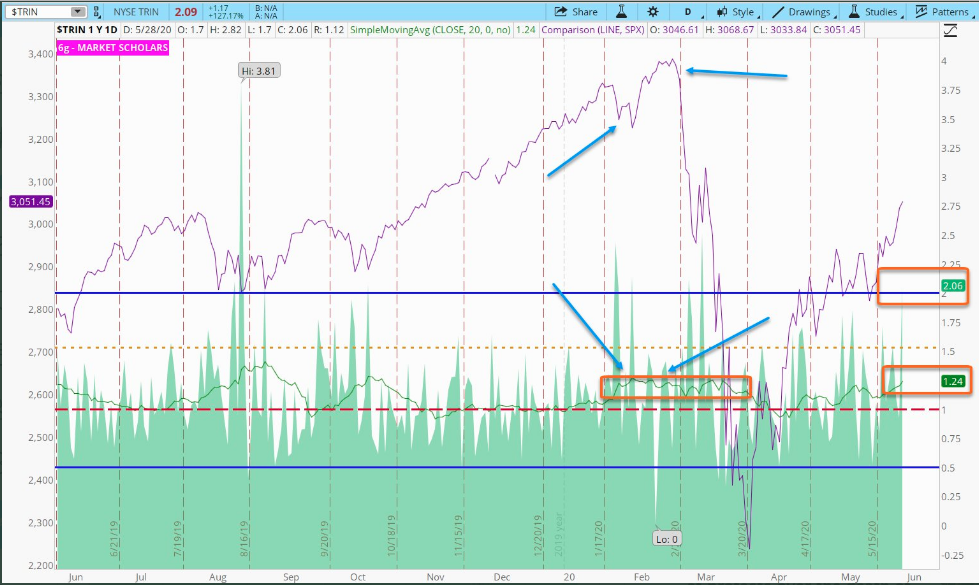
A single-day move in TRIN above 2 is usually associated with selling days. When the average reaches 1.25 during a rally, similar to Jan/Feb this year, it signals the intermediate run may prove to be near its climactic point. Nothing is guaranteed, but the chart above does seem to validate the analytics. Simply put, be prepared for anything in the week ahead and especially given our outlook over the next 3 weeks. (former 30-day outlook, 1 week ago)
Lastly, but certainly not least is the seemingly extremely low Put/Call ratio. The Put/Call Ratio 10-DMA is currently in the top 3% of most overbought days in 20 years. Few days ever reached this level.
Thank you for taking the time to review some of our notes from within this past weekend’s Research Report. In the month of June, our monthly membership fees will be moderated higher to reflect increased operating costs. We encourage our members to upgrade ahead of the adjustments. The Contributor membership will moderate from $5.99 to $7.99 and the Premium membership will moderate from $39.99 to $49.99. By upgrading before June, the prior rates will be locked-in permanently. Below are the tracked, issued and completed trade alerts to our Premium and Master Mind Options members during the previous trading week. (UVXY short trades). Join us in our live Daily Trading Room!! 😉