
Welcome to this week’s State of the Markets with Wayne Nelson and Seth Golden. Please click the following link to review the SOTM video. In this week’s episode, we discuss how we got to this point in the S&P 500’s rally from a bear market into a new bull market. What are the implications from a presidential election year? Is another Cares Act package on the horizon? How is the 2009 analogue living up to the 2020 market rally and could their be bigger hiccups ahead? All this and so much more inside today’s conversation and analysis surrounding the markets.
Phase 1: The Breakdown
- Markets in uptrends tend to look at new developments, especially negative ones, through a glass-half-full lens and are initially quick to dismiss those developments as insignificant, with the most recent example being the first signs of coronavirus (COVID-19) cropping up in China. Over time, the damaging impacts of the new development continue to nag at market participants and lead to negative surprises on the economic and fundamental data fronts, making it harder and harder to ignore them. Eventually, there is an acceptance that the investing environment has changed, and investors must mark down their outlooks and reposition by selling risk assets, such as equities.
- Unfortunately, when the trend changes from higher to lower, the herd must reposition portfolios simultaneously, and that can lead to bouts of illiquidity, which in turn can lead markets to overshoot their fair value. Defining characteristics of this phase tend to be spikes in volatility, oversold markets, and washed-out market internals (for example, very few stocks at 52-week highs or deteriorating cumulative advance-decline lines).
- It is worth noting that the Breakdown Phase tends to be the shortest of the three phases in the bottoming process. Based on what we see in Chart 1, which overlays the trajectory of the S&P 500 Index price (orange line) against the bear market of 2008-2009 (purple line).
Chart 1. Bottoming of equity market is a process, not a price

Phase 2: The Consolidation
- Once the selling exhausts itself, markets historically have tended to jump sharply off the lows and retrace a good chunk of the price decline. Unfortunately for investors’ frayed nerves, this is the very beginning of the Consolidation Phase, which is often the longest of the three phases in the bottoming process.
- After the initial retracement is over, and investors realize that a V-shaped bottom is highly unlikely and that they are going to be living in the new regime for the foreseeable future, markets often retest the previous lows. During this retest, markets also can reach new lows from time to time.
- Once a well-defined trading range has been established, markets wait as long as needed for the underlying issue to resolve itself and for the economic impact to become clearer. These are signposts that Phase 2 is underway.
Phase 3: The Bullish Breakout
- If much of Phase 2 is defined by a stalemate between bulls and bears, Phase 3 is kicked off by a breakout above the upper end of the trading range. This is an initial signal that the bulls may finally be regaining the upper hand. By this point, the economic and earnings outlook should be coming more clearly into focus, and growth should be turning back toward the positive side. The real debate becomes what valuation multiple investors are willing to pay for those earnings. Any pullbacks in this phase have tended to be short and shallow, frustrating investors who may be looking for one more retest of the lows as a chance to buy equities.
- S&P 500 down 20% in Q1, for the worst Q1 EVER.
- Only to follow it up with a 21.1% gain in Q2 so far, which would be the best Q2 since 1938. What did the final 6 months do in 1938?
- Up 5.9% in Q3 and another 7.4% in Q4.
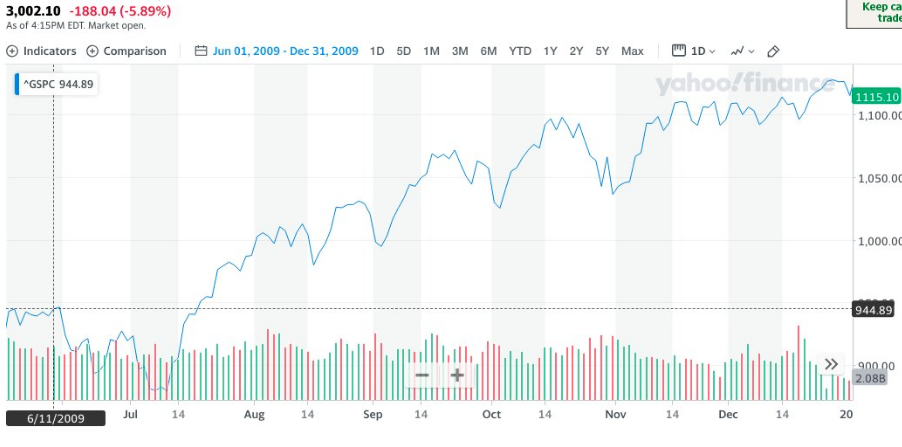
The pattern from July 2009, thereafter, sustained the newly formed bull market. Clearly there were pullbacks along the way, but they always resolved higher. Additionally, the chart below from the same 2009 time period shows how the S&P 500 traveled along the path of its 50-DMA.
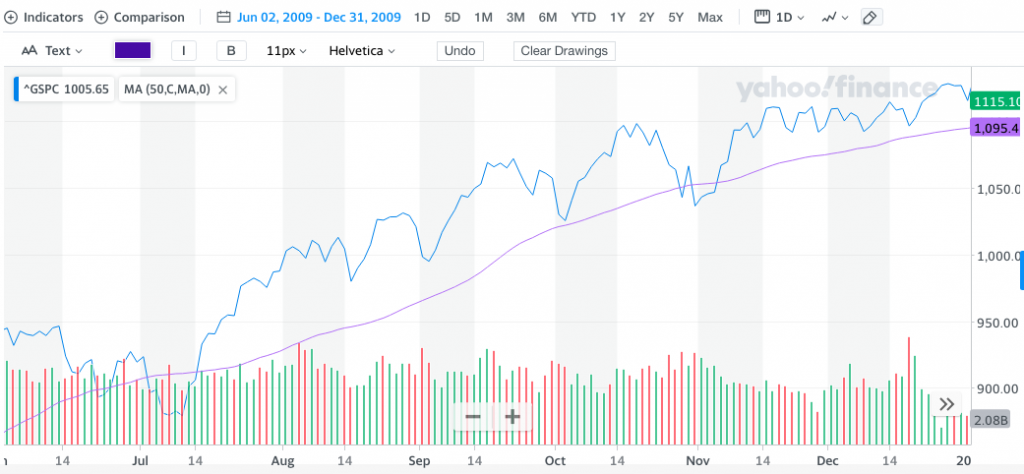
- This is where we were exactly 2 weeks ago. Since then and using the SPX 2009 analogue, we can still expect to churn through early July and possibly even touch the 50-DMA through bouts of distribution.
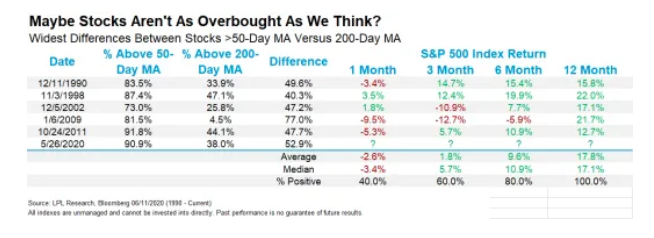
- Additionally, recall the gap between stocks trading above their 50-DMA and those trading above their 200-DMA in the table below issued in last weekend’s Research Report.
- From the opening of the week at 3,097 on the S&P 500, we dropped to an intra-week low, today, of 3,024 and before rebounding on the day.
- That’s nearly a 2.5% drop in keeping with the average return over a 1-month period using the table above, which denotes market breadth.
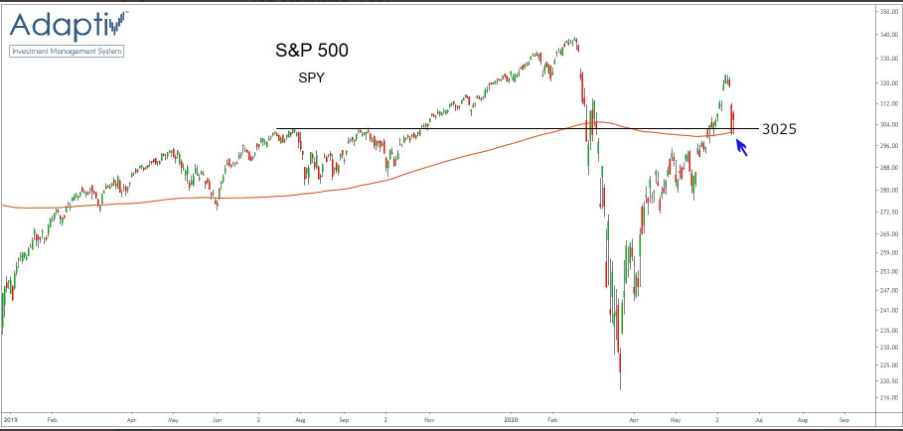
- Also recall that it’s not just that the 3,000 level remains a key level for the S&P 500, but so does the 3,025 level. This has been a key pivot point for markets for a while now.
- Wednesday was the 5th major distribution day since the March low. In an uptrend (arrows), after a day or two, these have been followed by a strong rebound (>3%).
- In a downtrend, not.
- S&P 500 dropped more than 2.5% on Wednesday and ahead of the initial jobless claims report, we’ve actually seen consolidation ahead of the jobs report more frequently than not over the last month or so. (Bespoke Investment Group)

- Yesterday was the 20th day since the February peak that the S&P 500 was down 2%+ in a single day. In terms of percentages, that’s 22.22% of all trading days during that period. The table above highlights each of the prior occurrences during that span along with the S&P 500’s performance the following day and week. In recent history at least, the S&P 500 has had a positive bias following these occurrences with an average gain of 1.28% (median: +0.58%) and gains 63% of the time. Over the following week, the average change is not as positive with an average decline of 0.47% (median: +0.57%) and gains just barely half of the time.
- One thing to note, though, is that the tide really started to shift after St. Patrick’s Day (3/17). Since then, the S&P 500 has been up the day after a 2% decline 8 out of 10 times and up the following week 9 out of 10 times.
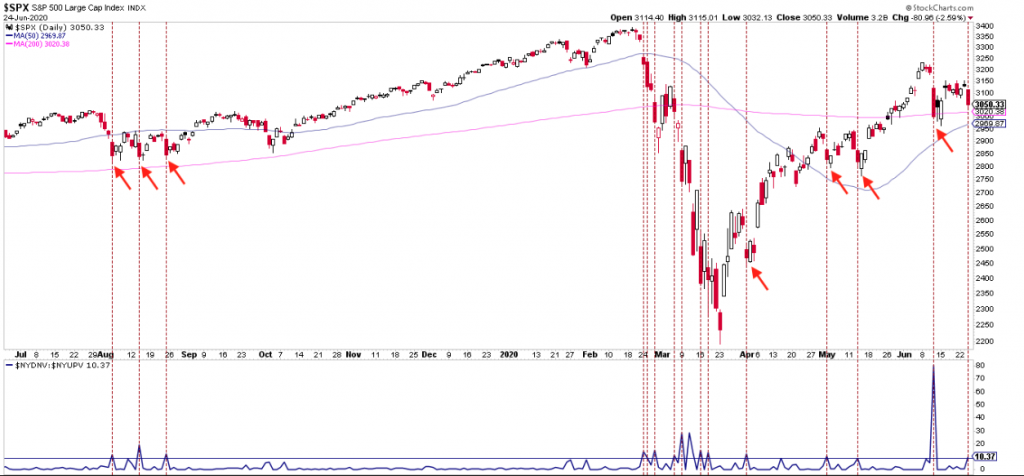
- Wednesday marked 65 trading days (3 calendar months) off the March 23rd low.
- The S&P’s 36.3% gain over that stretch ranks 3rd best since 1950, only fractionally trailing the first few months off the 2009 low (38.8%) and the 1982 low (38.7%). Pretty good company.
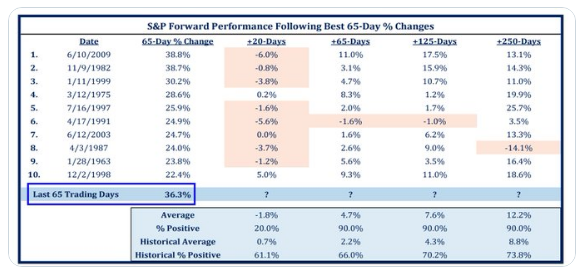
- The equal weight S&P is a very different animal from the more common form of the index. (DataTrek)
- The market cap weighted S&P is trouncing the equal weight version of the index YTD, -5.1% versus -10.8%.
- But the equal weight S&P is up more since the March lows, +44.3% versus +37.1% for the market cap weighted index (As of June 16th)
- And over the last year the market cap weighted S&P is solidly ahead of the equal weight index, +6.2% versus -2.2%.
- Some variations are what you’d expect: Tech is 12.2 points less of the S&P 500 equal-weight (14.3% vs. 26.5% for the cap weight) and Communication Services is 6.4 fewer points (10.9% vs. 4.5% for the equal weight).
- Financials are 13.4% of the equal weight S&P but 10.6% of the market cap weighted index and Health Care is 11.2% of the equal weight portfolio but 14.4% of the market cap weighted one. That’s another 6 points of variance between the two indices.
- The market cap weighted S&P is 68% growth stocks, 19% value, and 13% blend/other.
- The equal weighted S&P is 48% growth stocks, 29% value, and 23% blend/other.

- This DIX chart from @SqueezeMetrics pointing out that the index had hit an all-time high.
- This is incredibly bullish as it shows large players are purchasing big blocks of stocks in off-exchange transactions.

- After eight straight days of gains, the Nasdaq looks took a breather Wednesday as the index was down over 2%.
- The current streak represented the longest string of back to back gains for the Nasdaq of 2020 and the longest streak since the 11-day streak that came to an end last December.
- Throughout the Nasdaq’s history going back to 1971, there have been over 80 streaks of at least 8 trading days, but since the tech boom really took off in the late 1990s, these streaks haven’t been as frequent with just 26 now since 1995.
- One item worth noting about today’s decline for the Nasdaq, though, is that with a decline of over 2%, the only other time where an eight-day winning streak ended with a decline of more than 2% was back in July 1986.
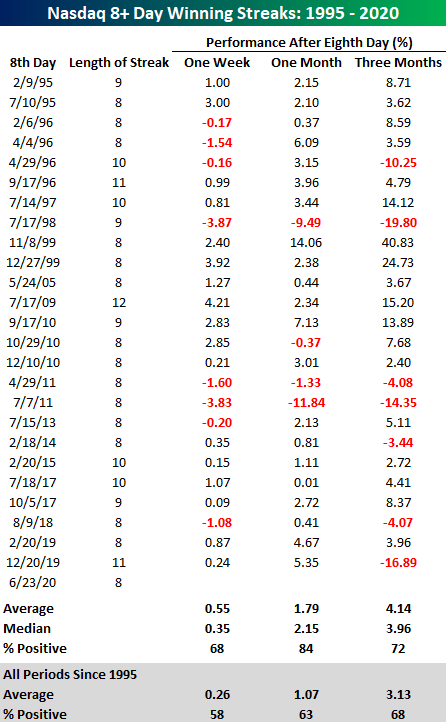
- Looking back at how the Nasdaq performed following prior eight-day winning streaks, more often than not, the index has tended to have better than average short-term performance.
- In the week that followed these prior streaks, the Nasdaq averaged a gain of 0.55 (median: 0.35%) with positive returns 68% of the time. One month later, the average gain increased to 1.79% (median: 2.15%) with positive returns 84% of the time. Three months later, the effect of an eight-day winning streak probably didn’t mean much, but even here the Nasdaq averaged a gain of 4.14% (median: 3.96%) with gains 72% of the time.
- Wednesday’s performance had ended Nasdaq’s winning streak with a thud, but history shows that prior streaks have typically been part of longer periods of outperformance.
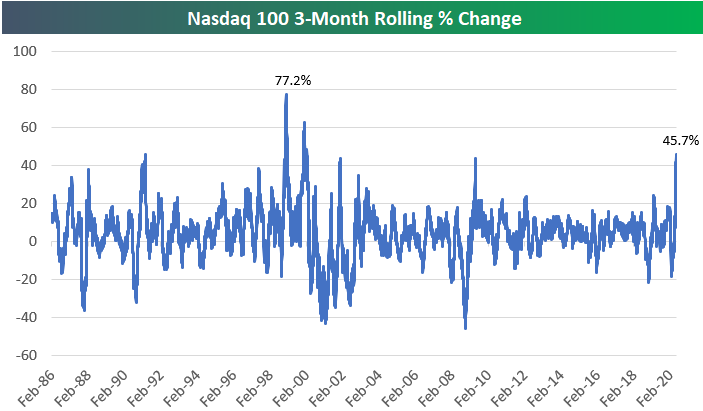
- As shown above, the Nasdaq 100 is up 45.7% since then. This 3-month period has been the strongest run the Nasdaq 100 has experienced since the Dot Com Boom of the late 1990s.
- While a 45.7% three-month gain is definitely huge, there were stronger 3-month periods in 1999 and early 2000.
- On January 20th, 2000, the rolling 3-month return hit 62.63% for the Nasdaq 100, while on January 11th, 1999, the reading was +77.2%!
- One important difference between the recent 3-month run for the Nasdaq 100 and the runs experienced in the late 1990s is the level of the index at the start of the rally. Prior to the current 45% rally, the Nasdaq had fallen 20% over the prior 3 months.
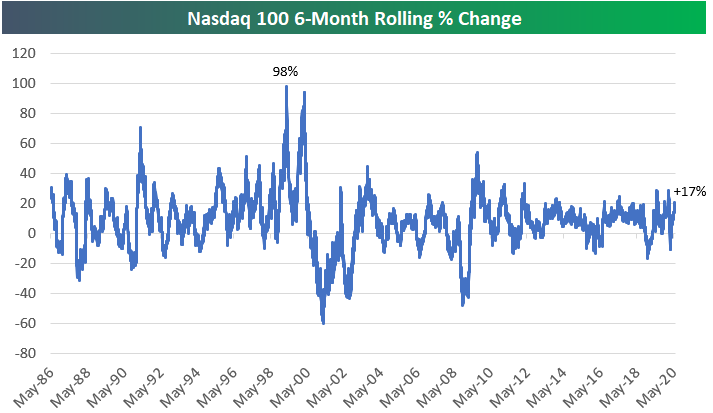
- This leaves the index up 17% over the past six months.
- That’s still a strong six-month gain, but it doesn’t even register as an outlier when looking at the 6-month rolling performance chart above. During the late 1990s, there were two 6-month periods that each saw gains of nearly 100%.
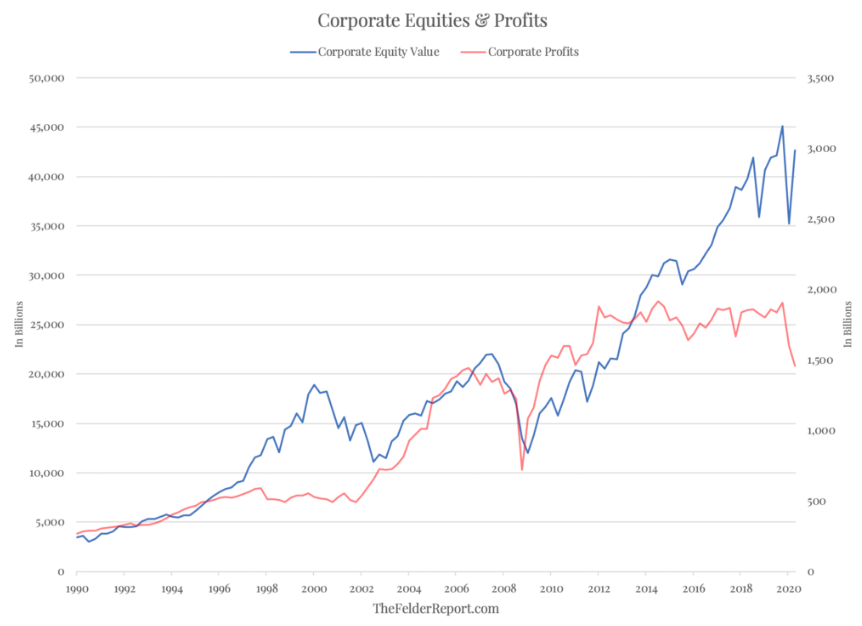
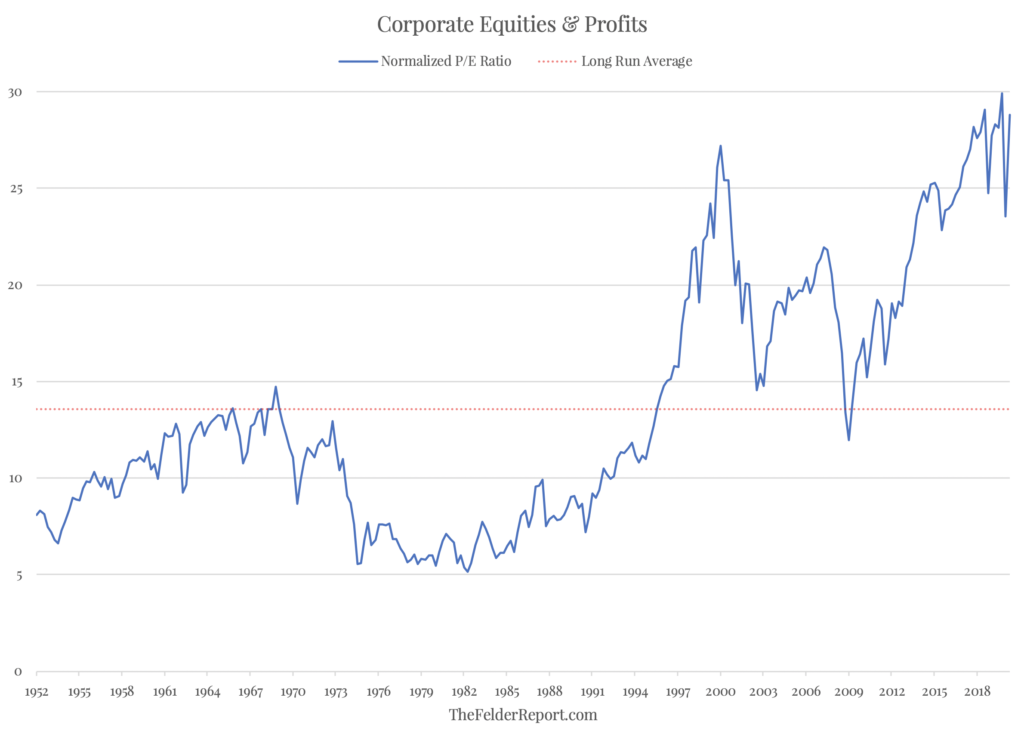
- We now find ourselves in the top 1% of stock market valuations and the bottom 1% of economic outcomes (based on the annualized rate of decline in second-quarter GDP). A popular way to demonstrate this gap is seen in the chart below which plots total equity values along with total corporate profits.
- At first glance, it appears this is the biggest disconnect between prices and profits in at least 30 years. However, if we turn this into a price-to-earnings ratio, it becomes clear that the stock market bubble of 20 years ago actually takes the cake.
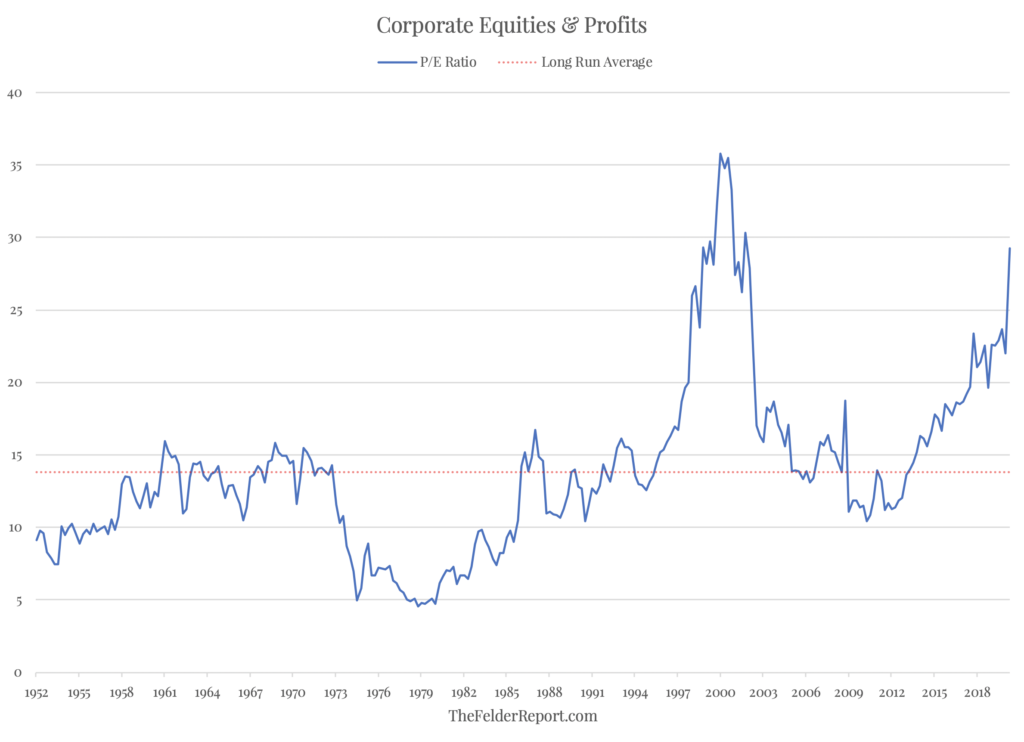
- But what the price-to-earnings ratio doesn’t account for is the fact that the Dotcom bubble appears so severe in the chart above largely because profit margins were relatively depressed at the time.
- Furthermore, profit margins in recent years became extremely inflated. This serves to make stock prices over the past few years look less expensive than they otherwise would.
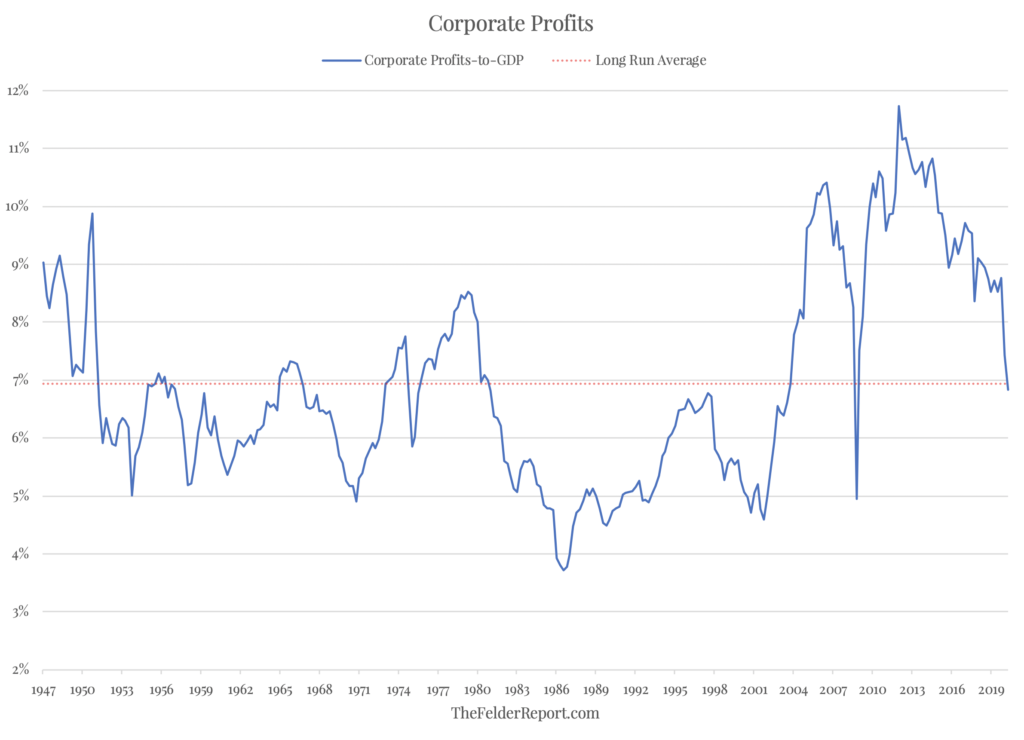
- So if we normalize profit margins, we can see that stock prices today are more expensive than they were 20 years ago at the peak of the Dotcom mania.
- It turns out that the current disconnect between stock prices and sustainable profits is, in fact, greater than anything we have seen in modern history.
- COVID-19 has acted as an accelerant on many existing trends such as the rise of e-commerce.
- This chart from RBC Captial shows that despite the rebound in brick and mortar based shopping, the trend growth in online shopping hasn’t slowed.

- Macy’s: expects to create cost savings of about $630M per year with a major restructuring initiative.
- The restructuring will include the elimination of 3.9K corporate and management roles. Additionally, Macy’s has reduced staffing across its stores portfolio, supply chain and customer support network, which it will adjust as sales recover.
- “We know that we will be a smaller company for the foreseeable future, and our cost base will continue to reflect that moving forward. Our lower cost base combined with the approximately $4.5 billion in new financing will also make us a more stable, flexible company,” says CEO Jeffrey Gennette.
- The $630M in annualized savings for the company will be additive to the anticipated $1.5B in annual expense savings announced in February, which Macy’s expects to fully realize by year-end 2022.
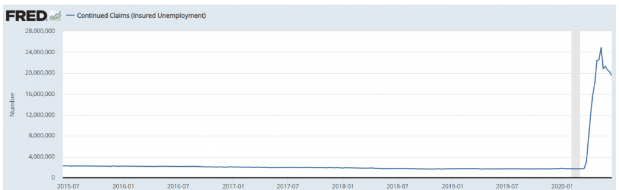
- Filings for initial jobless claims totaled 1.48 million for the week ending June 20, above Bloomberg’s consensus forecast of 1.32 million and down only marginally from the revised 1.54 million reported for the prior week. The continuing claims number, reported with a one-week lag, dipped from 20.5 million to 19.5 million.
- While fresh filings for unemployment claims have fallen 12 straight weeks from a peak near 7 million in late March, the gradual decline in recent weeks and still staggering number of unemployed point to a long road ahead for the US job market to fully recover from the pandemic.
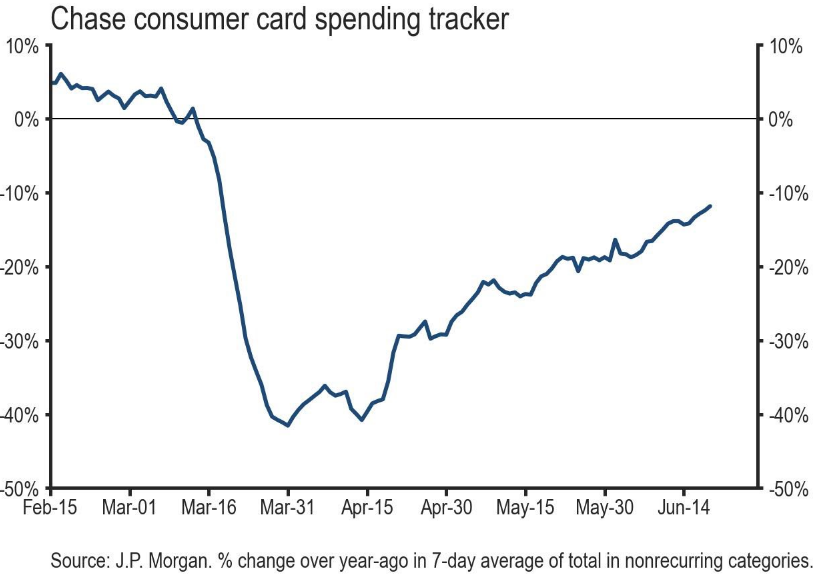
- “Our tracker of spending by 30 million Chase credit and debit cardholders has continued to rebound in recent weeks even as COVID19 has begun spreading rapidly again in some states.”
- Daily consumer spending tracker – • On June 20, our tracker of Chase consumer card spending rose from -11.9% to -10.7%.
- The tracker rose 3.2%-pt over the prior week, and it is 30.8%-pt above its low of -41.5% on March 31
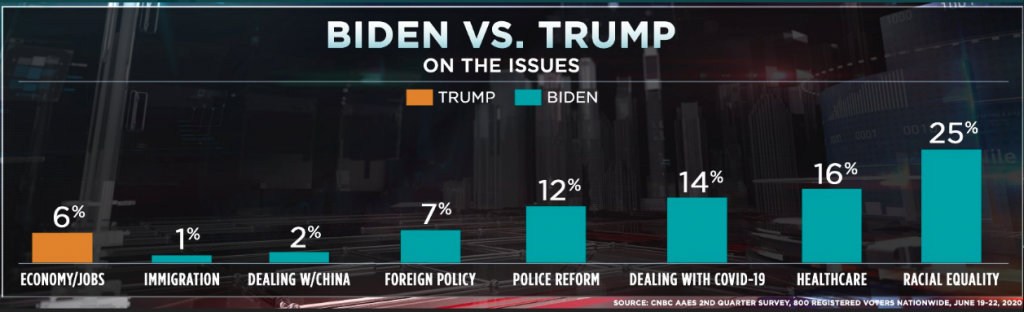
- Biden leads Trump on all issues except for the economy, according to the latest CNBC All-America survey.
- The June survey shows Biden leading Trump by 47% to 38% among registered voters, up 4 points from his lead in April. Biden benefited from increased support among young as well as wealthier voters, and he consolidated his base, seeing a 7 point gain in his approval among Democrats.

- Turns out when a political party has total control of Washington, D.C., it’s a good environment for the stock market.
- And it doesn’t matter which one.
- Contrary to popular belief that equities perform better under a divided government, Nicolas Colas’s data show the opposite is true.
- In the eight years in the post-war period that Republicans controlled Congress and the White House, the S&P 500 on average returned 16%. In the 22 years that Democrats had total control, the benchmark returned an average 14.3%.
- Both are above the average annual return with a split government.
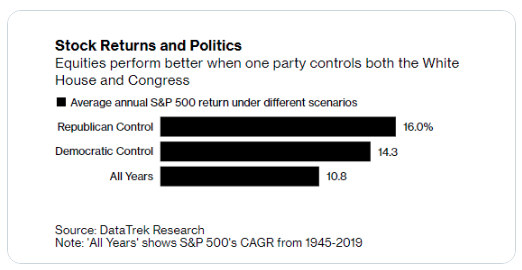
- “The historical data points to a good future U.S. equity investment environment even if Democrats sweep the White House and Congress this November,” Nikolas Colas wrote Tuesday.
- “If nothing else, this does explain why equity markets have been resilient even as the odds of this outcome have risen in recent weeks.”
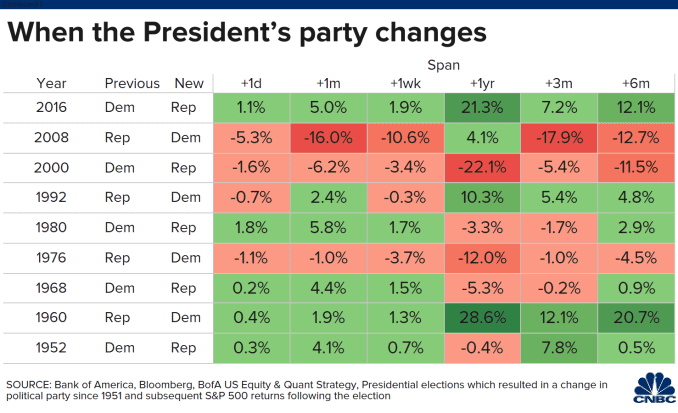
- Looking at data going back to 1951, Bank of America found that when the White House flipped from Republican to Democrat the S&P 500 underperformed over the following three months compared with when a Republican replaced a Democrat in the Oval Office.

- The firm also found that the stock market generally performs better when an incumbent is re-elected.
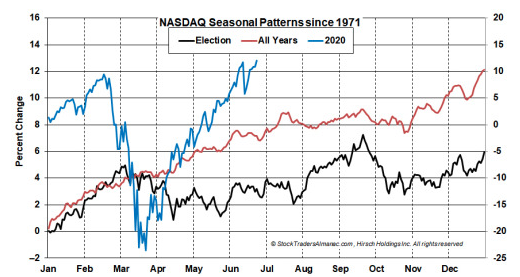
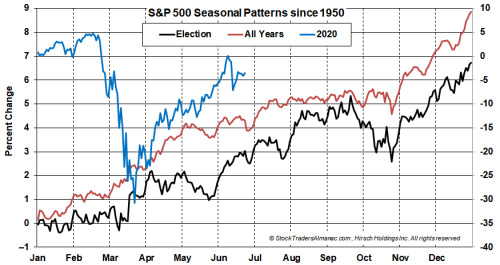
- In the surrounding Seasonal Patten Charts of DJIA, S&P 500 and NASDAQ, we compare 2020 (as of yesterday’s close) to All Years and Election Years. This year’s performance has been plotted on the right vertical axis in each chart. This year certainly has been unlike any other however some notable observations can be made. For DJIA and S&P 500, January, February and approximately half of March have historically been weak, on average, in election years. This year the bear market ended on March 23. Following those past weak starts, DJIA and S&P 500 historically enjoyed strength lasting into September before experiencing any significant pullback followed by a nice yearend rally. NASDAQ’s election year pattern differs somewhat with six fewer years of data, but it does hint to a possible late Q3 peak. (Traders Almanac)
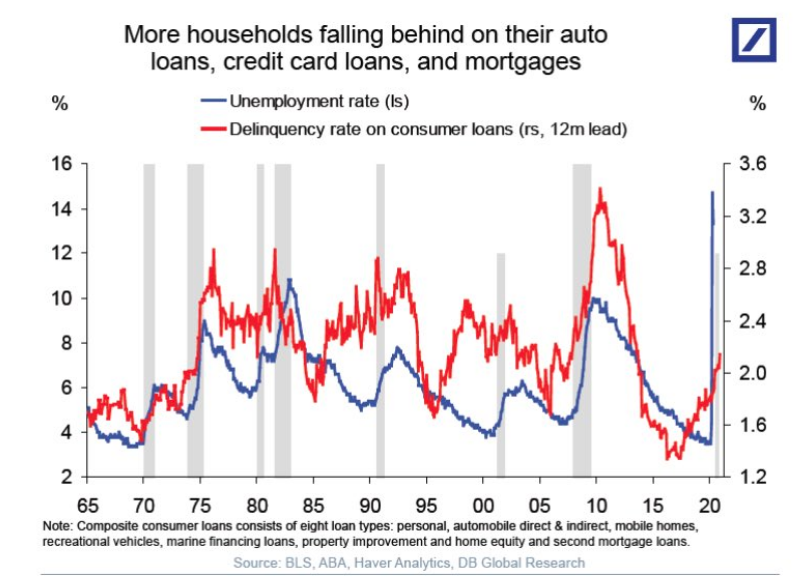
- DEUTSCHE: “.. if we don’t get more fiscal support to households, the risks are rising that we will see serious solvency problems in the household sector, see chart above.”
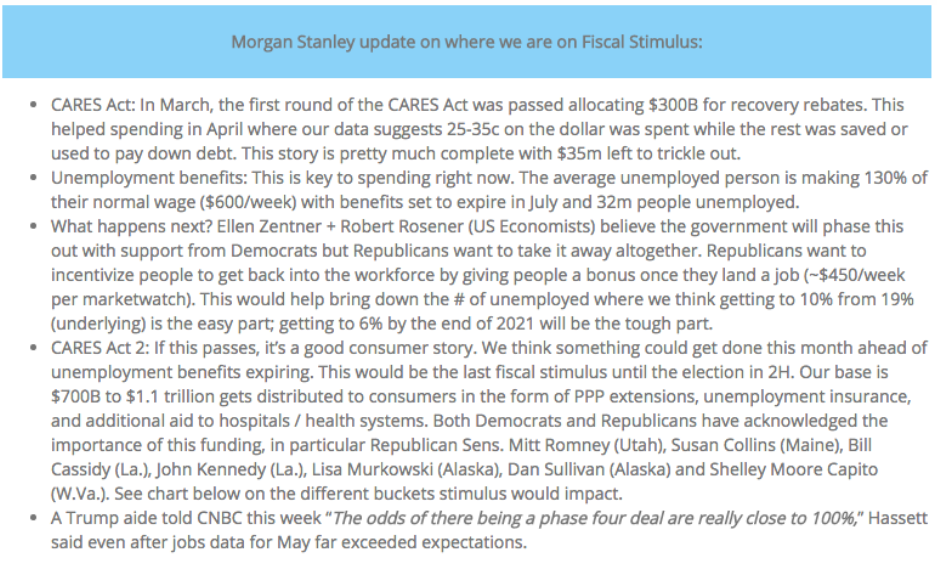
- Invesco’s Kristina Hooper: It’s clear that the US Congress will not consider more fiscal stimulus until after the July 4 holiday recess. Additional fiscal stimulus is critically important, as Federal Reserve (Fed) Chair Jay Powell reiterated in his testimony before Congress last week. For example, the US has lost over 1 million government jobs in the last two months6 — without state and local government funding, that number could increase significantly. Similarly, I believe we need to see ongoing payments to households because of the financial fragility of a large cohort of Americans. And I’d like to see funding for contact tracing.“

- J.P. Morgan: “The Fed has purchased approximately a 10% share of the Treasury market, more than any other large-scale asset purchase program.”
- “We will be doing another stimulus package,” Trump said. “It’ll be very good. It’ll be very generous.”
- Treasury Secretary Steve Mnuchin echoed that sentiment Tuesday and said legislation could get passed by Congress by late July.
- There isn’t really a disconnect between market and economy.
- It’s just a matter of recognizing the market isn’t exactly the economy.
- Citi’s Bear Market Checklist is still not giving an imminent warning of a bear market.
- Their checklist is only showing a reading of 30% of red and amber signals. You need a reading of above 50% to signal a bear ahead.

From Scott Wren of Wells Fargo
Our positive equity market view as we look through the current pandemic and out to year-end 2021 revolves around consumers spending money and driving the U.S. economy forward as they have done in past cycles. But in order to do that, they need to be confident. And, historically, for consumer confidence to rise and help push economic growth ahead, there needs to be another key component—jobs. It makes sense that consumers with jobs tend to have higher confidence and are more willing to open their wallets and spend money on discretionary activities and items, such as eating out, cars, boats, houses, and new furniture. We know that consumers are going to spend money on toothpaste, laundry detergent, and deodorant no matter what the economy is doing, but it is discretionary spending on things people want, not need for everyday survival, that determines whether or not the economy is strong or weak. The rationale is not complicated.
In terms of the coronavirus pandemic, consumer confidence looking ahead is likely what is going to move the economy from a short but deep recession into a new growth phase. If we are all sitting at home in September and October afraid to go out because we perceive the risk of catching the coronavirus is high, the stock market will likely be frowning (probably well in advance). The reopening process over the coming weeks and couple of months is important for the stock market outlook. Pay attention in your neck of the woods. Our assumptions call for gradual progress on the medical and reopening fronts.
Our base case suggests increasing confidence and Federal Reserve stimulus should support valuations well in excess of historical averages. Earnings, while likely down 30% this year, should show some recovery in 2021 as the economy recovers in the second half of this year and then we expect 3% growth next year. Current favored sectors should benefit from improved confidence and economic recovery. Our favorable ratings on the Consumer Discretionary and Communication Services sectors in particular are quite dependent on consumer spending improvements in the months ahead. The favored Financials sector also is a play on improved confidence, not only in terms of consumers but also businesses. The Information Technology sector should continue to offer growth even in a slower economy, but we believe it will lead as the economy pulls out of recession. And we continue to favor the Health Care sector as the population ages and new discoveries drive the pharmaceutical and biotech groups.
In order for the economy to improve from here and for the equity market to meet our expectations as we look out over the next 18 months, we believe confidence is key.


