
Stocks closed higher for a 2nd day in a row, as better than expected manufacturing and services sector data out of Europe helped to support the market. U.S. Markit manufacturing and services data also managed to beat economists’ expectation while New home sales continued to rebound since the April-May lockdown period.
The S&P 500 (SPX) squeezed out a small gain on the day, continuing to hold support at the 20-DMA. Once again, it was technology stocks leading the way, which helped propel the NASDAQ (NDX) to new record highs. The trend stemming from the March low remains that of higher-highs and higher-lows and the outperformance versus the S&P 500 Index is indicative of the strong demand for this segment of the market. Major moving averages are all pointing higher, supporting the positive bias across multiple timescales. The benchmark has held predominantly above its 20-day moving average and, at this point, investors that missed out on the rally might wait for a more appropriate risk-reward entry point towards levels of intermediate support offered at levels around the 50-DMA. The benchmark is significantly stretched above long-term support at its 200-DMA, which skews the risk-reward unfavorably for new entrants.

There was quite recognizable resistance at the 3,150 level on Tuesday and as the S&P 500 struggled with overhead supply. With pension fund rebalancing slated to commence in the back half of the trading week, advances in the index may be met with early rebalancing activity as higher prices present an optimal area to perform this mechanical operation.
“The end of the quarter is going to be pretty interesting, given how much the market has moved during this quarter. There could be volatility here. We already witnessed it and there’s potential for more, as we move toward the end of Q2,” said Dan Deming, managing director at KKM Financial.
Bond strategists pay particular attention to the month end, which can bring about moves in fixed income markets as pensions and other funds and investors adjust their portfolios to bring asset allocations back in line. Quarter end makes it an even bigger event, and this quarter’s big move in stocks has some speculating there could be a sizeable move by pension funds into bonds, with some estimates ranging from $35 billion to $76 billion of rebalancing on the books.
“We estimate that U.S corporate pensions will move about $35 billion into fixed income,” said Michael Schumacher, director of rates strategy at Wells Fargo. He added that is the largest flow in the six years he has been tracking portfolio rebalancing.
“The reasons are pretty obvious. You had this massive rally in stocks and bonds haven’t been keeping pace.”
Goldman Sachs reportedly identified $76 billion in pension selling of stocks.
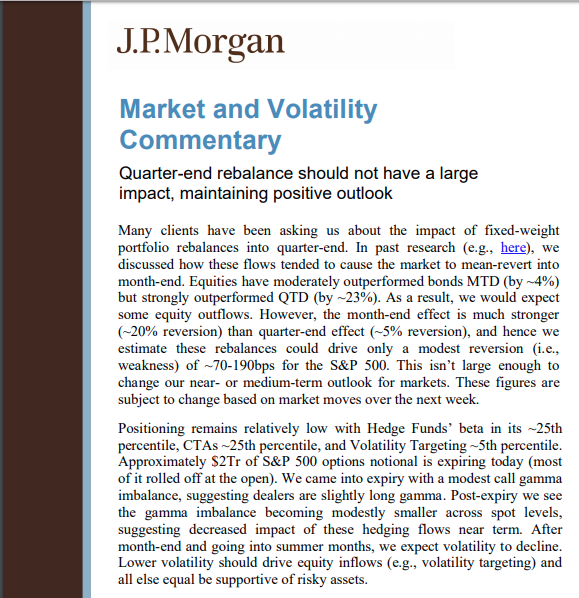
“While we acknowledge the risk of a small correction in equity markets over the coming two weeks as a result of this negative equity rebalancing flow, we continue to believe that we are in a strong bull market in equities and any dip would represent a buying opportunity,” the JPMorgan strategists wrote.
While J.P. Morgan’s strategist believe we are in a strong bull market, there are some near-term issues the market may be highlighting as measures of concern near-term.
A number of negative divergences have caught our eye following Tuesday’s positive session for stocks.

The percent of stocks in the S&P 500 Index trading above 50-day moving averages declined on Tuesday, continuing to roll over from one of the highest levels in decades.

The NYSE McClellan Summation Index is similarly rolling over from a significant peak.

The NYSE Cumulative Advance Decline Volume line peaked a couple of weeks ago and has since fallen. As well, there are still a number of broad market benchmarks are showing signs of resistance below their 200-DMA, including the S&P 500 Equally Weighted Index. Admittedly, cracks like these were observed at the start of May, which proved to be nothing, but the obvious concern of a near-term pullback for stocks is raised again. And make no mistake about it folks, this is a new bull market that is consistent with most bear-to-bull market characteristics having already been demonstrated.
Not everyone is of the opinion that a new bull market has been achieved. Sven Henrich (Northman Trader) a noted market and central bank critic recently penned a narrative dismissing the new bull market by jumping from one index to the next and one time frame to the past. Seems confusing? That’s Sven Henrich for ya, and as he demands a unique exercise in technical analysis to align with his perspective on markets. Here’s what the permabear Henrich recently offered in outlining his bear market case:
“Don’t let new highs on Nasdaq fool you. It’s still a bear market and I can prove it.
First let’s acknowledge they are have and continue to throw the kitchen sink at this: Historic monetary and fiscal stimulus with more to come apparently as the powers that be are discussing another trillion dollar stimulus package on top of the $3 trillion they’ve already thrown at this and of course the Fed’s historic balance sheet expansion.
This entire market remains a tech affair while the rest of the market is indeed in a major bear market. Equal weight tells the truth. Here XVG versus NDX:
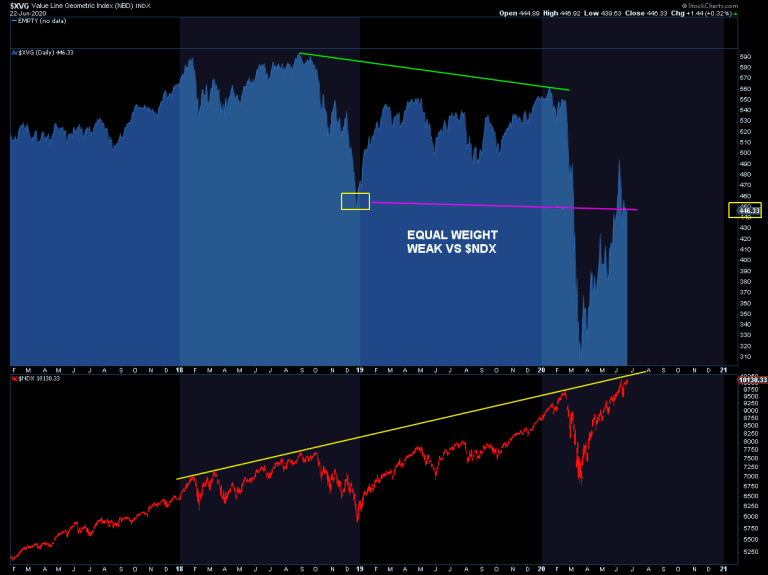
NDX making new all time highs on futures in overnight while the rest of the market in equal weight sits below the December 2018 lows when SPX was trading at 2350.“
Yes, we could easily suggest that Henrich is demonstrating that equal weight NDX is not as strong as the tech-heavy cap-weighted index itself. The same can be said for the S&P 500. That in and of itself does not dismiss the bull market, as that is usually the case. But what is rather remarkable is that he not only compares equal-weight with cap-weight, but his premise is to compare the equal-weight Nasdaq with the S&P 500… back in December of 2018 and from where it had been trading at that time. Talk about doing a lot of “heavy lifting” to make a bear market argument?
From this point Henrich offers a lot of smoke and mirror commentary to distract from the bearish index jumping above by offering the following:
Yet the larger market says something completely different.
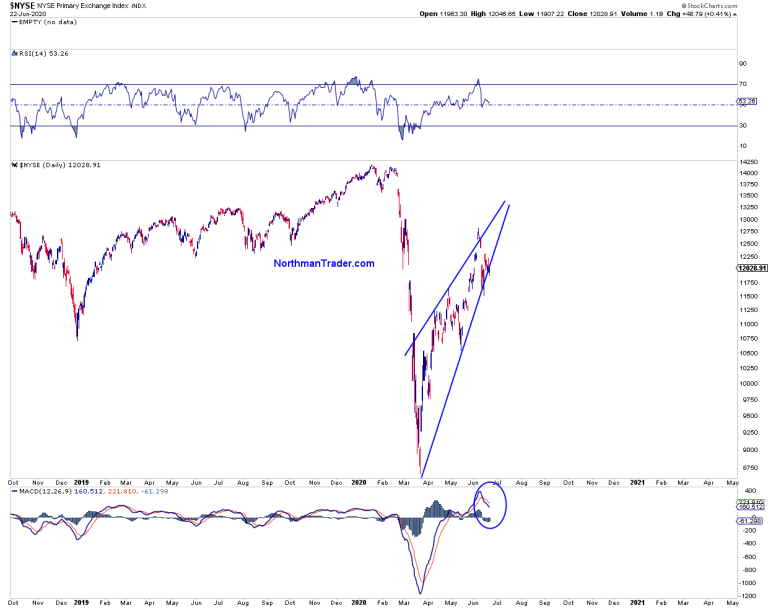
Look at $NYSE, the broader index, it’s a big fat rising wedge with an island reversal to boot:

MACD is down and it’s barely hanging on with an island reversal to boot. This is bearish full stop.
And we see similar charts on other indices:
In all of the offerings from Henrich above, be it the rising wedge patterns or MACD turning down (bearish crossover), none exonerate the new bull market and are typical patterns and stochastic readings during a bull market that has run fiercely from the fastest bear market in history. Secondly, the distance for which each index and or pattern has traveled is only possible with breadth thrusts firing and consistent with new bull markets. Recall that the market executed a Whaley and Breakaway breadth thrust in the month of May. Nonetheless, Henrich isn’t using these last few charts and verbiage to suggest they are bear market expressions, these are just the distractions and/or “pile on” charts, lending to his demonstrated bearish narrative.
None of our examinations for Sven Henrich’s latest permabear rant should be found discounting the probabilities of a near-term corrective phase. Rather, our analysis simply offers perspective that Henrich isn’t willing to offer. One chart pattern that you don’t see in a bear market is the following:
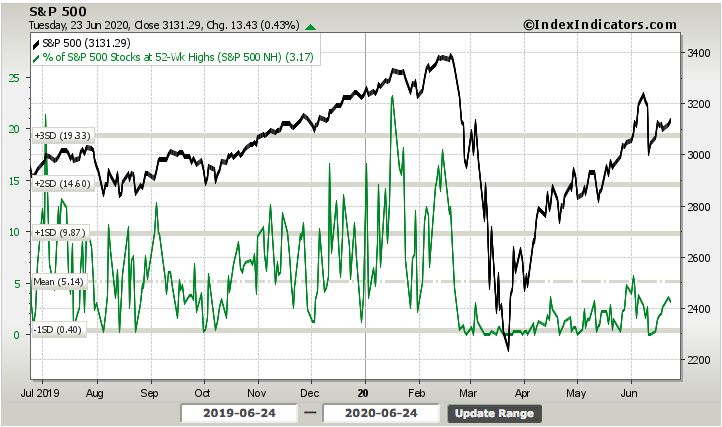
Some 185 stocks made new 52-week highs yesterday, as shown in the chart above. While this is not anywhere near the number of new 52-week highs going back to January and February of this year, we typically don’t see any new highs in a bear market. This was the case in March and early April. Moreover,
While bears will be bears, bulls will be bulls. Near-term weakness after a massive, record setting 50-day rally should be anticipated. Pullbacks are a normal part of bull markets. From a bullish perspective there are at least 5 reasons to remain bullish long-term.
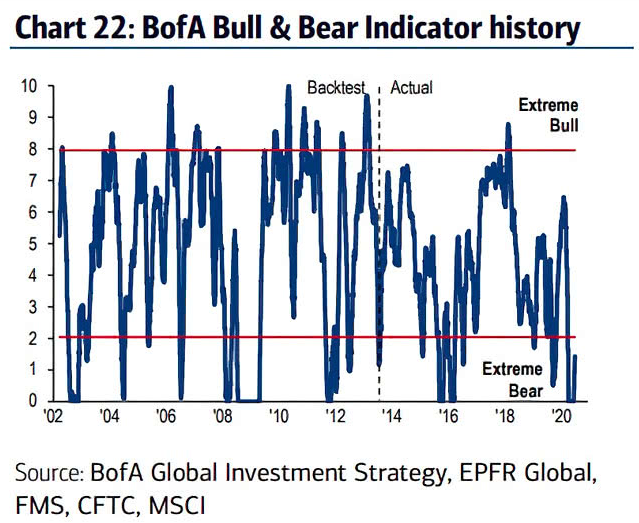
Investors remain bearish about stocks, according to a key metric of market sentiment. The Bank of America Bull & Bear Indicator read 1.4 in June. That “suggests an extreme bear level”. Such extreme readings are known as contrary indicators. When investors are overly bearish, then it usually paves the way for the beginning of a stock market surge.
J.C. Parets of AllStar Charts points out another reason to remain bullish, which is yet another way to look at Sven Henrich’s Nasdaq offerings above.
“The fact that the NASDAQ 100 has been steadily rising and has made new highs is a bullish phenomenon. One thing we know for a fact is that new all-time highs are NOT a common characteristic of a downtrend. And the Nasdaq100 (QQQ) just went out at new all-time weekly closing highs.”
Note that the rise in the NASDAQ 100 has not seen a bubble-like surge as it did during the dotcom bubble on the late 1990s. The returns are steady. The dotcom bust came after a monster-sized bubble in tech stocks. The current steady gains strongly suggest we are not in such a bubble and therefore we shouldn’t expect it to burst.
Another reason to remain bullish is due to the amount of cash still on the sidelines.
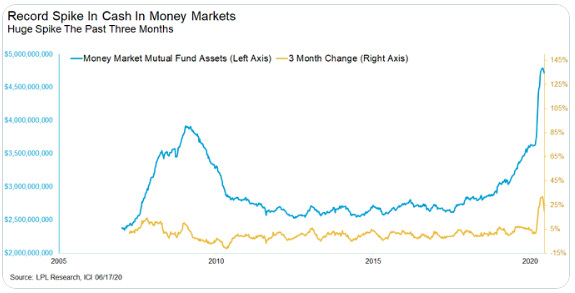
Investors are hoarding cash, and they are probably doing that out of fear that the market will crash further. Money market funds now hold $4.8 trillion dollars, according to a recent report from Barron’s magazine. The report also states that such cash holdings are a record level and far surpass the $3.8 trillion high of January 2009. Eventually some of these funds will fuel the next leg of the new bull market.
In combination with the enormous cash on the sidelines, positioning is light. Positioning remains relatively low with Hedge Funds’ beta in its ~25th
percentile, CTAs ~25th percentile, and Volatility Targeting ~5th percentile.
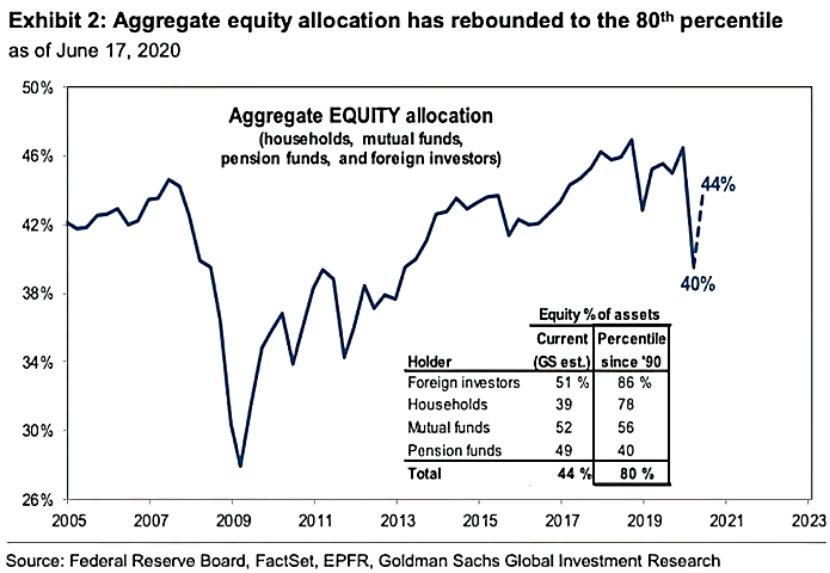
Approximately $2Tr of S&P 500 options notional expired last week. Aggregate positioning or exposure to equities has already shown size of increasing. Aggregate equity allocation has rebounded to 44%, in the 80th percentile.
Bullish breadth has accompanied the bear-to-bull market turnover, as discussed previously. This is another reason to remain bullish, but also reinforces a watchful eye of breadth indicators that may serve to identify near-term pullbacks. Based on the already mentioned reasons to remain bullish, weakening breadth shouldn’t overly concern investors but rather identify opportunities to buy stocks on dips. This was highlighted in a recent J.P. Morgan report:
Our last highlighted reason to remain bullish is based on the recession ending. The current recession is clearly a deep one with millions of people making new claims for unemployment insurance each week. While the depth is a serious problem, the economic downturn isn’t likely to last long, according to the Economic Cycle Research Institute. ECRI has a phenomenal record in forecasting the beginning and end of recessions.
All the aforementioned bullish contemplations are absent any consideration of monetary or fiscal policy. We certainly can’t leave such material information and consideration out of a bullish narrative can we? UBS said the Federal Reserve’s “unambiguous” story would drive stocks higher in the medium term and said now wasn’t the time for investors to be sitting on the sidelines.
The analysts, led by chief investment officer Mark Haefele, said three narratives were currently driving markets; the ‘Fed story’ — ongoing central bank stimulus — the second-wave story, and the U.S. election story. Fears of a second coronavirus wave have come to the fore in recent days, with spikes in Beijing, Germany and a number of U.S. states. The UBS team said that U.S.-China tensions fed into the election narrative, which would come into focus over the next four months.
“Overall we see the second-wave and U.S. election stories as contributing to market volatility as headlines feed investors’ hopes and fears about the speed and strength of the economic recovery. But it is the Fed story that will endure over the medium term,” they said in a note on Monday. They said they were positive on the outlook for both equities and credit, preferring USD high yield, Asian high yield and USD-denominated emerging market sovereign bonds as well as stocks in sectors that have so far lagged behind the market.
Don’t fight the Fed as the saying goes and once again that is proving to be the right approach for investors with a long-term time horizon, and even those who bought the bear market plunge. And we wouldn’t discount further measures if the markets demand further monetary policy implementations from the FOMC in the future. One such tool in the monetary policy tool bag could eventually come in the way of capping rates, otherwise known as yield curve control (YCC).
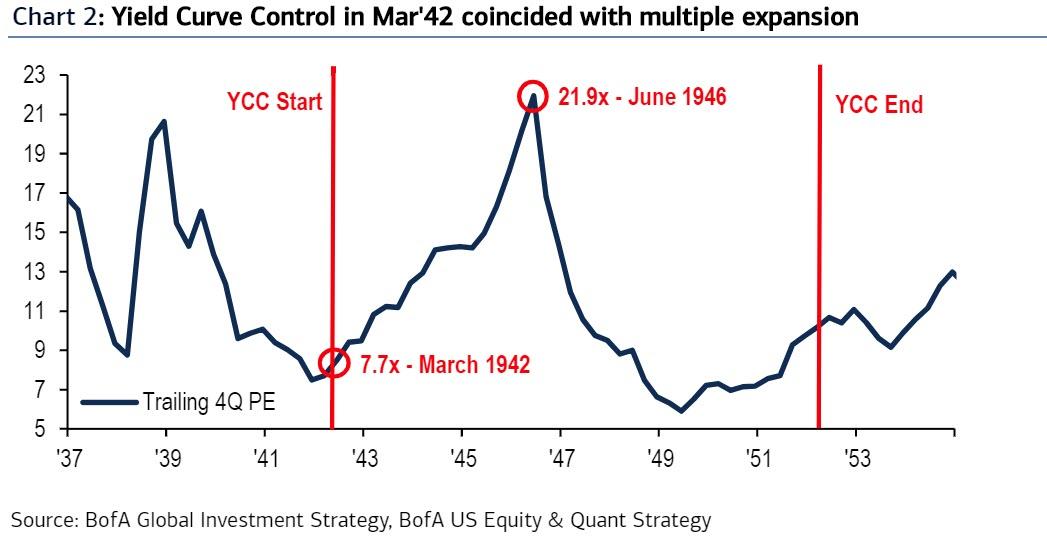
The U.S. first underwent a period of Yield Curve Control lasting 9 years between March 1942 and March 1951 to allow the US to keep rates low during WWII and its immediate aftermath, and which concluded with the Fed-Treasury Accord.
What is remarkable about this first YCC period, when the Fed capped yields at 2.5% to allow Treasury to fund cheap debt in WWII, is that as BofA’s Michael Hartnett points out it coincided with start of a huge rally in US stocks…
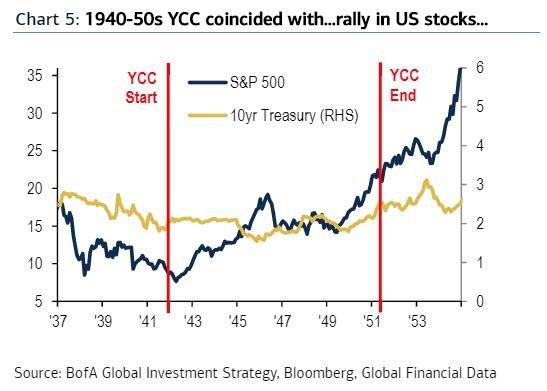
Multiples expansed as PEs soared from 7.7x in March 1942 to 22x in 2 years, nearly tripling over a very short period of time.
BofA is not the only one to hint that the coming YCC could result in a massive rally for risk assets: Bloomberg does too, writing overnight that “should yield curve control go global, it would cement markets’ perception of central banks as the buyers of last resort, boosting risk appetite, lowering volatility and intensifying a broader hunt for yield.”
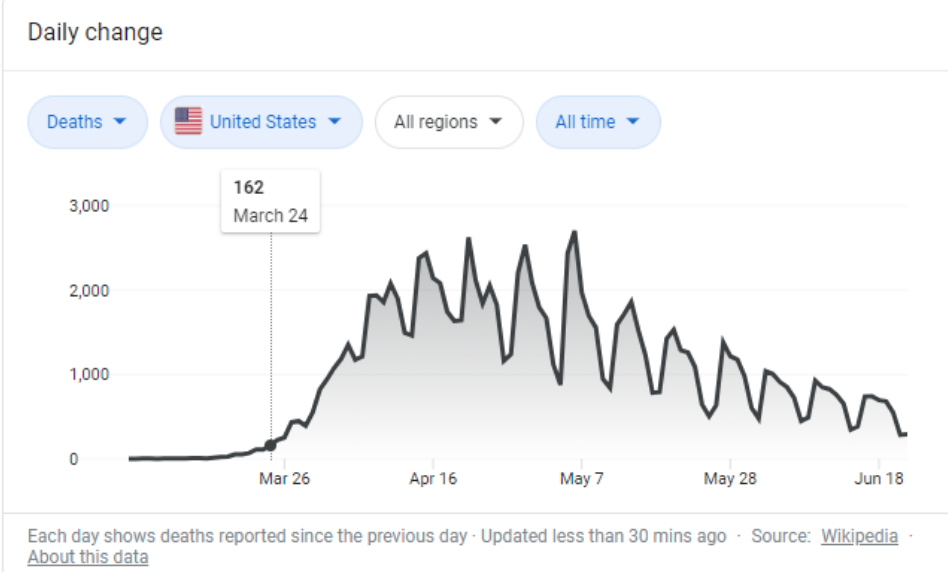
On Wednesday and what may prove the cusp of pension fund quarterly and portfolio rebalancing, equity futures are sharply lower. Investors are digesting the increase in new COVID-19 cases rising, even as the death rate continues to fall.
While we know the media chooses not to focus on the positive in favor of fearful narratives as they generate more attention and a wider audience, the death rate could play a significant role in decisions made amongst politicians. It’s also important to not only know where the death rate is achieved, but how. Remember that only 0.6% of Americans live in long-term care facilities, and yet they account for 43% of all COVID19 deaths. In New Jersey, 11% of all nursing home & assisted living facility residents have died from COVID.
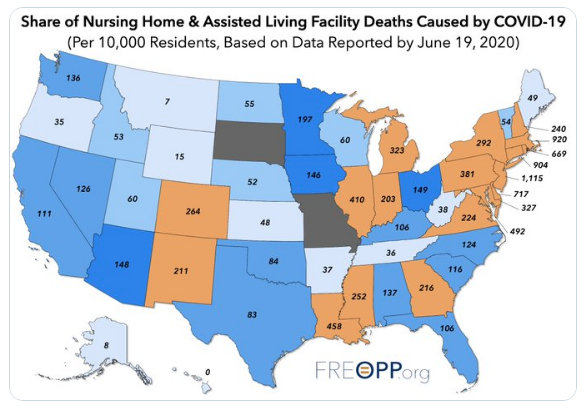
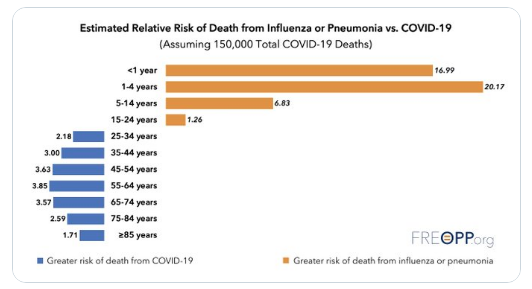
These trends are essential to understanding recent trends re COVID deaths, hospitalizations, and cases. Are the hospitalizations among the elderly, who are at highest risk of death? Or among younger individuals, whose risk of death or serious illness is much lower?
As we had said in the past, a resurgence in positive COVID-19 cases was to be expected and once the economy reopened. According to the Leuthold Group’s chief investment strategist, new cases won’t widely impact the economic reopenings.
“At the same time those are having hot spots, New York is being brought back online. The economic reports are going to continue to improve, and hot spots are going to affect not whether the economy grows or not, but whether it grows faster or slower.”

Looks like Paulsen isn’t in agreement with Sven Henrich’s “still a bear market” narrative either? Despite his optimism, Paulsen warns the coronavirus risk isn’t going away anytime soon. He contends investors will have to cope with flare-ups until there’s a vaccine.
“When we get headlines, there will be reaction to it. It could create pullbacks or corrections along the way.”


