
And wouldn’t you know it; the S&P 500 hit an all-time high Monday (3,646) and the strategists followed with upgrades to their macro-outlook and S&P 500 price targets. Isn’t that just always the way? When prices rise, so do price targets while sentiment becomes increasingly bullish. When prices fall the analysts encourage a deeper consolidation before investors might start seeing the bottom. That deeper consolidation/correction rarely comes to fruition while you’re sitting on the sidelines.
Piper Sandler’s Craig Johnson has been a headstrong market strategist with his eye on the long-term trajectory of the economic recovery process. On several occasions he has offered his S&P 500 price target of 3,600, dating back to May of this year. Back then, his price target seemed way out of step with Wall Street, which was littered with doubt and fears of a low retest (2,191). Pounding the table in July, the strategist stated the market would not pullback before hitting 3,600. His call was as close as any strategist on Wall Street given that the biggest pullback up until the S&P 500 hit 3,588 was 8.4% in June. But after this achievement and when the even stronger pullback was afoot in September, the strategist lost conviction and called for a deeper consolidation/correction period.
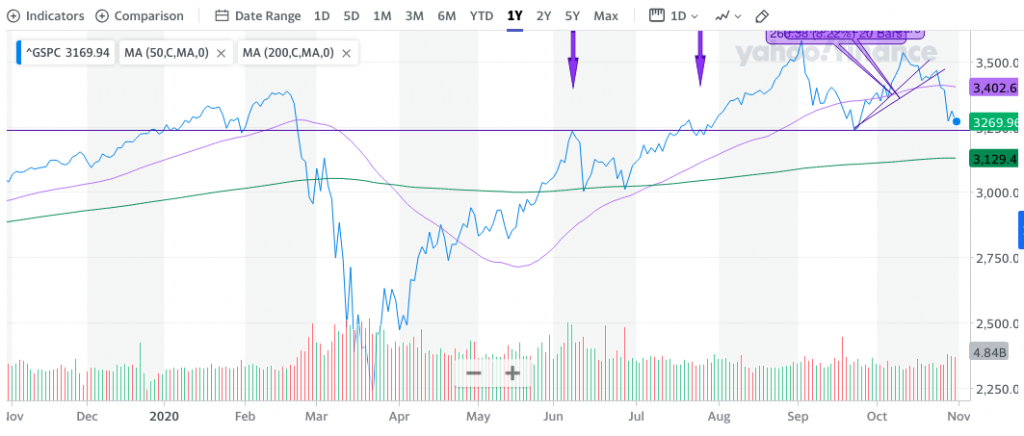
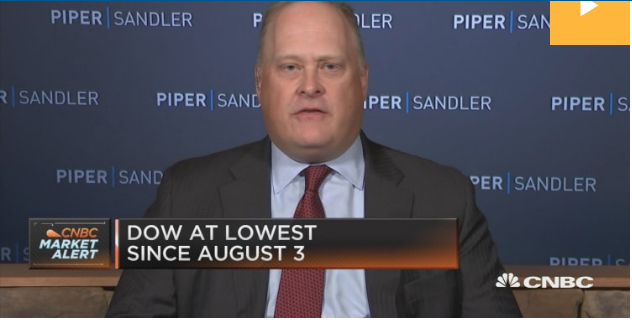
The chart (above) looked ominous at the time, and Johnson suggested that the base of the inverse head-n-shoulders pattern would prove a battleground. Having offered this support level in the 3,230s, he went on to say that he believed more consolidation would take place and find the S&P 500 testing its 200-DMA around 3,129. The call for a 200-DMA test from the benchmark index by Craig Johnson wasn’t out of line with many strategists at the time and given that the market had already corrected some 9 percent. I encourage readers to review Johnson’s commentary from this CNBC guest spot on September 24th.
What happened the following week, leading up to the election was a nearly 400 point, 6-day market rally that seemingly culminated with a Pfizer Phase III vaccine trial data dissemination. The point of this exercise is to identify how even Wall Street strategist fall prey to price action, when there better judgement may desire to be contrarian to said price action. Had an investor been waiting for the S&P 500 to fall all the way to 3,100s… short-term considerations often fail investors, but they are often highlighted in the media for the sake of filling up programming hours.
In speaking of the ~400 point rally post the Craig Johnson commentary, other analysts/strategists followed-up this positive price action by lifting their year-end and 2021 price targets. As price rises, analysts/strategists follow.
As we can see in the latest report from J.P. Morgan’s Quant team, led by Marko Kolanovic, the team effectively increased their 2020 price sentiment (above 3,600) and believe the S&P 500 can achieve 4,000 in early 2021. In general, the term “early” typically points to the first half of the year. Beyond the first half of 2021, Kolanovic offers a FY2021 price target of 4,500. The price target is roughly 24% higher than where the S&P 500 currently rests.
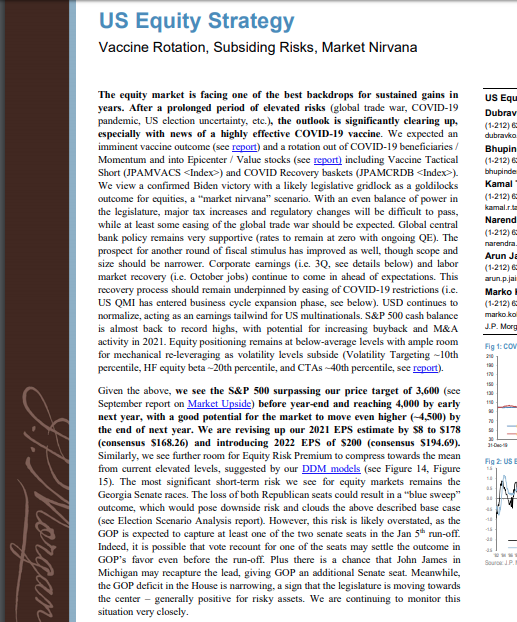
J.P. Morgan isn’t the only big institution that has recently revised their outlook and price target/s. Goldman Sachs’ equity research team, led by David Kostin, has recently updated their outlook to include the benefit of the COVID-19 vaccine, as shown in the chart below:
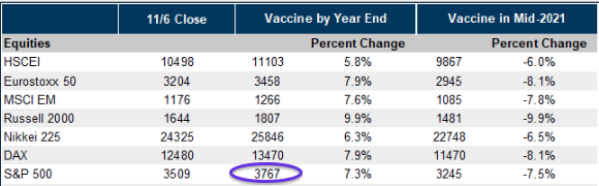
In keeping with the notions of “full disclosure”, I maintain a consulting engagement with Goldman Sachs London, whereby I’ve shared the opinion that the S&P 500 could hit 3,761 in 2020. “That’s kind of an odd price target”, you might be saying. Let me explain to my new readers, as our Finom Group readers have long-since understood the rationale. The easiest and often shunned rationale is found in the 2009 S&P 500 price-path from the trough through year-end 2009. In Finom Group’s weekly State of the Market video from August 27th, here is what we offered to our members as we studied the likeness of the S&P 500 price-path with that of 2009:

- I’ve been tracking the 2020 trend in the SPX relative to the trend in 2009, since May when we first noticed the correlation.
- While you can see that there is a very small difference of about 2 percentage points at the moment, I would say that is rather insignificant in the grand scheme of things.
- However, the SPX does appear to be due for a small pullback. These things are difficult to pinpoint, but a 2-4% decline in the next week or two would not be at all surprising.
- As I said last week, 3,700s (+14.5%) by year-end seems very possible, but probably not without 3 or 4 small pullbacks along the way given elections, fiscal policy needs still debated in Washington and breadth weakening.
So all of a sudden, with price action edging closer to 3,600, a positive Pfizer vaccine announcement and Goldman Sachs nudges up against a thesis for forecasting the S&P 500 price that mirrors what we’ve offered previously and without a vaccine. Price action and sentiment; sometimes one-in-the-same! In looking further out to 2021, here is how Goldman Sachs sees the S&P 500 performing:
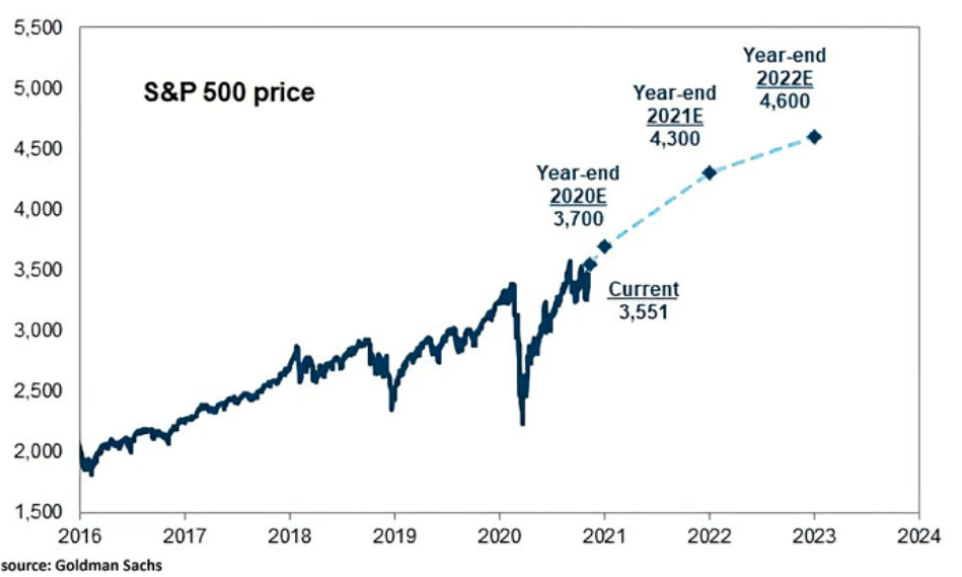
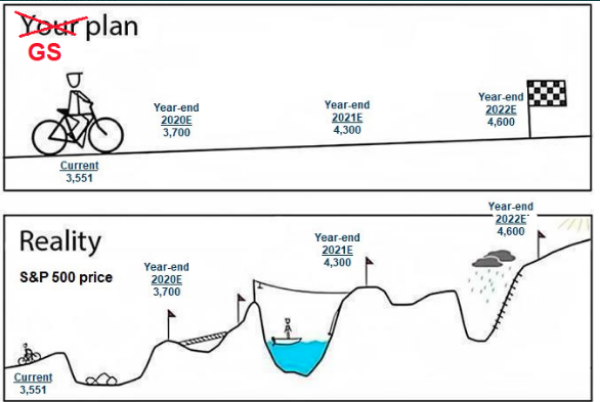
Clearly, the trajectory for the S&P 500 seems unanimous and quite positive, but investors are best found considering that price doesn’t rise in a straight line as assumed in the chart from Goldman Sachs above. No, sometimes its best for investors to view the price action through a more realistic lens, as suggested in the following graphic:
Through Wednesday, the market was seemingly flying high on the vaccine headlines. After a couple of lackluster trading days, however, the market took a tumble on Thursday. As the COVID-19 infection and hospitalization rates continue to rise at an alarming pace and to worrisome levels. Headlines of a fast-tracked, effective vaccine to guard against the coronavirus seemingly faded. In the previous week, Massachusetts and certain other cities in Texas and Southern California issued population advisories to curb the spread of the coronavirus. On Thursday, Chicago joined these other regions by issuing its own city-wide advisory:

You’ll notice that word “CORRECTION“, in the title of the CNBC headline for the breaking news in Chicago? The correction was issued because when CNBC first broke the story it read: “Chicago issues stay at-home order and cancels Thanksgiving”. The reality is that Chicago, like the state of Massachusetts, issued an advisory, not an order, which is critical to the state of the economic recovery and COVID-19 pandemic era. Below is the advisory language released by the Mayor of Chicago.
“As new cases and hospitalizations in Illinois hit new records, the city of Chicago has just issued an “advisory” asking residents to call off Thanksgiving gatherings, and engage in only “essential” trips, like to school, work or the grocery store, for the next 30 days.”
Firstly, none of the recent advisories and or re-employed economic restrictions are a surprise to Finom Group’s team. We had long-since expected some forms of regional restrictions to resurface as the winter flu season arrived. In our more recent Research Report, we discussed our expectations for restrictions juxtaposed with those re-instituted in Europe
“We have a history for which to recognize the impact of a rising epidemic curve that we didn’t have previously, a playbook so to speak. And while Europe is undergoing newly reimposed restriction in France, Italy, Germany and the U.K., we have not to this point. It is far easer to re-impose restrictions from the largest employer, the government in Europe. The public sector is a much larger employer in Europe than it is in the United States. The impulse to reimpose restrictions on the economy, therefore, are likely found with greater ease in Europe than the United States. This is something most market participants haven’t factored into their “lockdown” calculus. This is not to say restrictions, to some degree, are not a probability in the U.S., but rather it will likely be met with resistance at the government and civilian levels. While lives are put at risk without restrictions, there are many other considerations state and local governments are forced to calculate.“
With all the COVID-19 headlines, it’s easy to suggest Thursday’s 1% decline in the S&P 500 was due to such headlines, and maybe there is some degree of truth to the notion. We should be open to this possibility at the very least. Nonetheless, we don’t see this as being the most likely reason for the Thursday decline, given that industrial metals remained in an uptrend, the safe-haven U.S. Dollar was slightly lower on the day and stocks only fell 1% for the session. Moreover, it’s just 1-day folks; we need more price action to draw a conclusion as to why the market does anything on any given day.
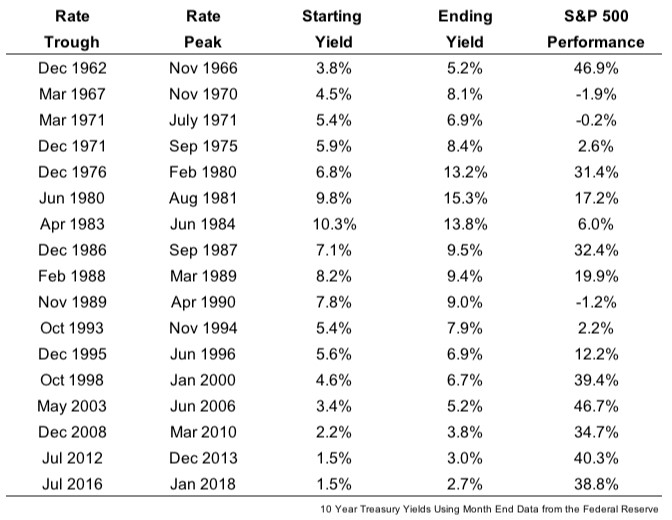
I have a feeling that when we look back on Thursday’s price action, and should the consolidation continue, strategists will point to rising bond yields as the reason for the equity markets’ decline. Historically, even this lacks logic. It’s important to note that interest rates rising in and of themselves is not necessarily a bad thing for stocks. (Ben Carlson)
“The average performance of the S&P 500 during these past rising rate environments was almost 22 percent in total returns. Only three times did stocks fall when the 10-year rose by 1 percent or more, and the largest losses were just under 2 percent. So stocks have held up well in the face of rising interest rates over the past 50-plus years.“
Here’s the accompanying chart:
One last point to make with respect to COVID-19 “lockdown” fears and their role in equity market price action!
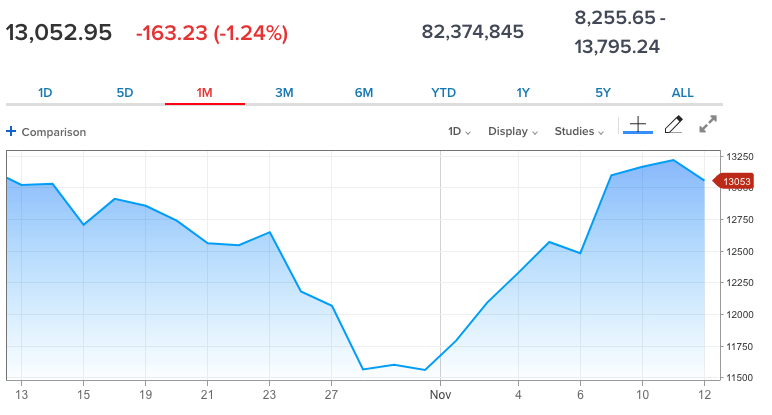
European economic restrictions re-employed in Germany, France, Italy, Belgium and the United Kingdom to fight COVID-19 are more severe than U.S. restrictions currently. They began nearly 2 weeks ago. When we look at a chart of the German DAX above (equity market index), it actually rose from the time the economic restrictions were announced. France and Italy’s equity index charts look very similar, with both equity markets rising post the announced restrictions of economic activities in the regions. Something tells me that the S&P 500 was simply consolidating and looking for a catalyst, as buyers are proving hard to find at such valuations and while COVID-19 fears make headlines to develop further media narratives around price action.
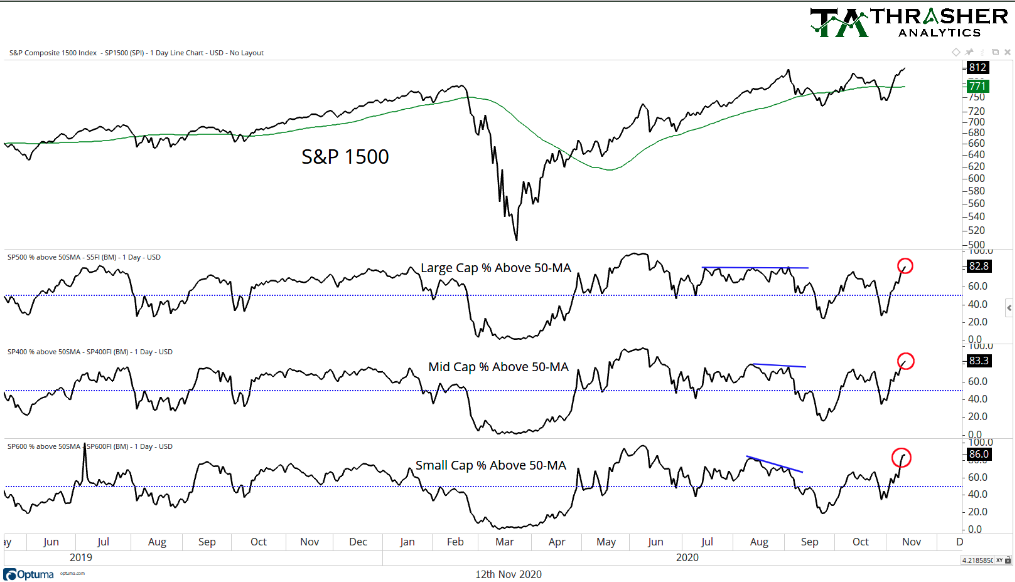
The major indices achieved their recent lofty valuations with really strong breadth. While proving to consolidate some of these gains on Thursday, more stocks have been up-trending lately, and overall breadth indicators proved quite positive. As Andrew Thrasher of Thrasher Analytics recently pointed out: “For the first time since June, all three, small-, mid-, & large-cap indices have 80+% of their stocks above the 50-day Moving Average.“
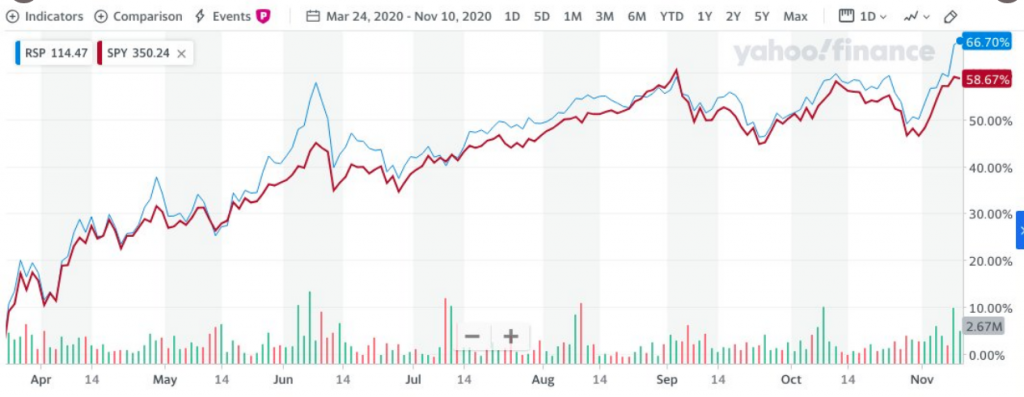
And for those of you whom are still in the, “It’s just FAANMG stocks moving the market”, camp, please shut your whole Wang Chung (1980s flicks). As we have mentioned many a time throughout the market’s recovery from the March lows, equal-weight S&P 500 (RSP) has outperformed cap-weight S&P 500 (SPY), as outlined in the chart below:
When we hone in on just the year-to-date chart of the equal-weight RSP, it also lends itself very much to the bulls long-term. In the chart below, we can see that it recently hit a new high in 2020.
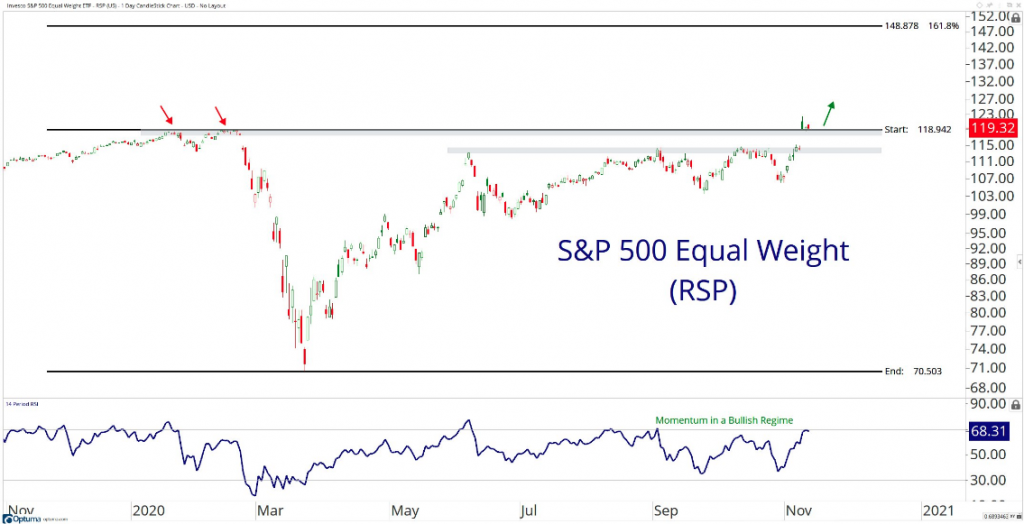
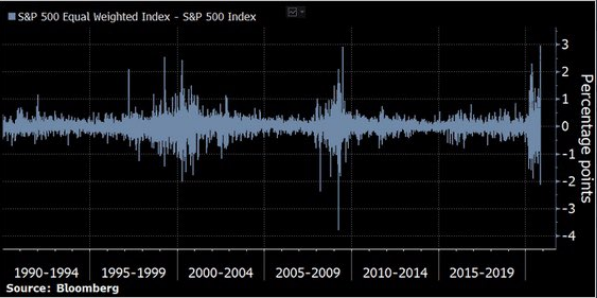
Monday’s Pfizer disclosure from its Phase III trial (>90% efficacy against the virus) resulted in a significant market rally. From the context of market breadth, the S&P 500’s equal-weight index outperformance was the largest on record Monday.
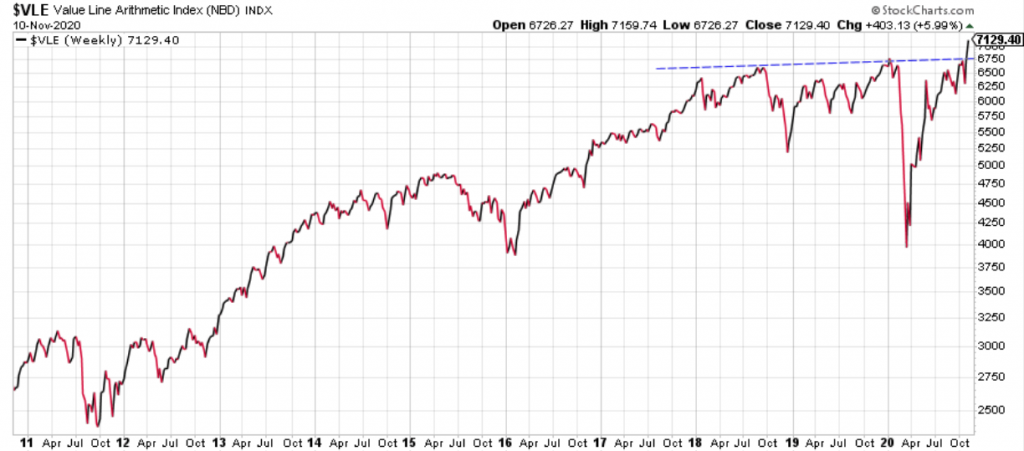
And not to belabor the conversation about market breadth having proven strong of late, supporting the long-term uptrend, but the Value Line Arithmetic Index (aka the average stock) has broken out to new highs. This validates yet another sign that there is broad market participation to the latest move and a good sign for equities going forward.
While breadth had been strong and still resides at bullish levels, the technicals and breadth are suggestive of potential market exhaustion and in need of either consolidation or yet another positive catalyst to sustain the upside momentum. Markets tend to find interim tops on strong breadth and bottoms on weak breadth.
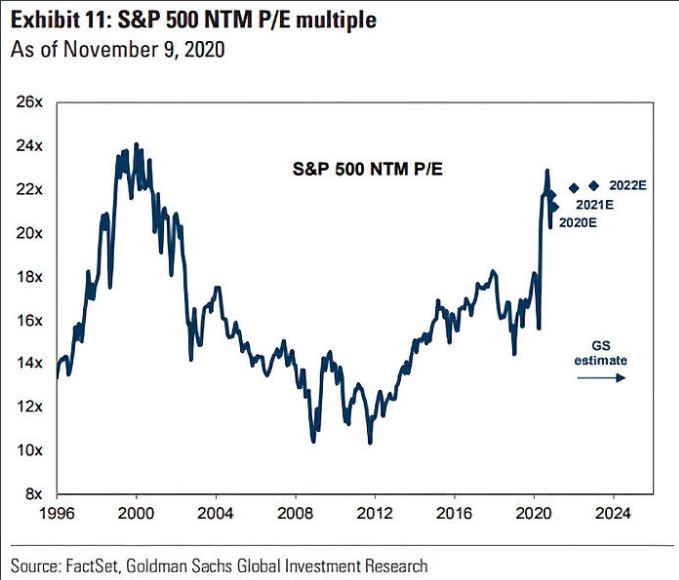
Admittedly recognizing that valuations are lofty compared to the average 5 and 10-year price/earnings multiple, I’ve suggested many times in the past that the days of 15-18X forward looking earnings PE ratios may prove a thing of the past. One reason is that the Equity Risk Premium is likely to remain elevated with a zero bound Fed Fund rate and 10-year yields expected to remain under pressure as Quantitative Easing unfolds into 2021.
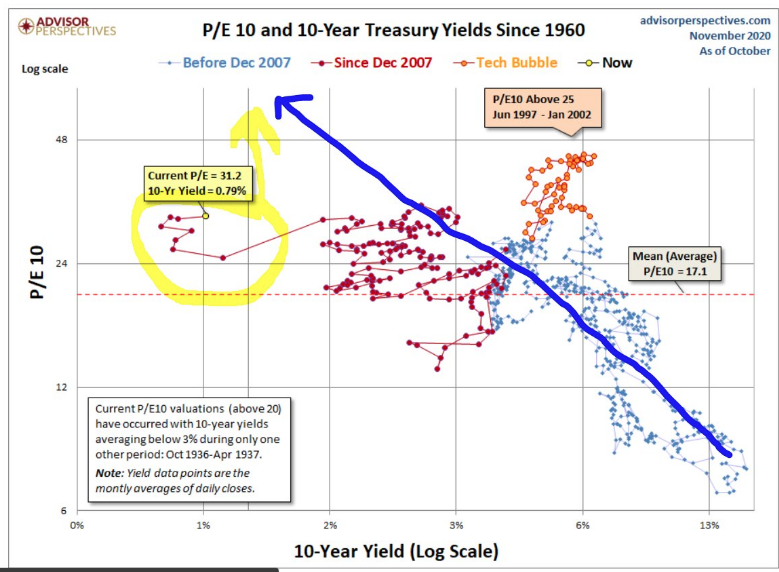
What the chart above also outlines is the trend of the S&P 500 Price-to-Earnings (PE) multiple across the path of a decline in the 10-year yield. As the yield for the safe-haven Treasury has fallen over time, the S&P 500 PE has risen.
Another reason we might or should see higher P/Es going forward is due to market structure. The on-trend sectors, carrying the most outsized P/Es are a greater component of the S&P 500 than ever before, ergo, the S&P 500s P/E should, logically, also recognize this P/E growth. Now let’s look at the present day sector weights in the chart below:
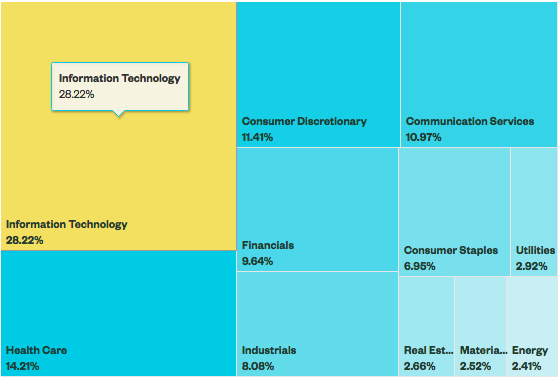
Information Technology (XLK), Healthcare (XLV) and Communication Services (XLC) continue to increase their weights in the S&P 500. Additionally, Consumer Discretionary (XLY) has gained weighting as Amazon (AMZN) reigns supreme in the sector. When we put the jigsaw pieces together, they seem to align and point to expanding multiples going forward as the technology era provides greater P/E’s for on-trend business models and with those business models solidifying their earnings power.
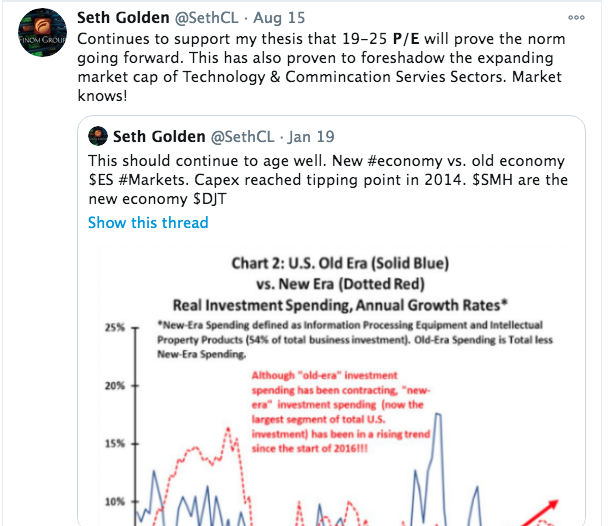
I’ve gone on record with my belief that we are in the infancy stages of multiple expansion for the S&P 500 and believe the P/E will maintain a range of 19-25 over the next 10 years. (See tweet from August)
Not many analysts/strategists have an appetite for suggesting and modeling for multiple expansion. There has been a goodly amount of fear surrounding the thesis for decades, even as multiples have expanded over time. It would appear, however, that Goldman Sachs has finally come around… wouldn’t you know it? In the chart below, the firm forecast the S&P 500’s P/E to maintain elevated levels or historically expand for the foreseeable future.
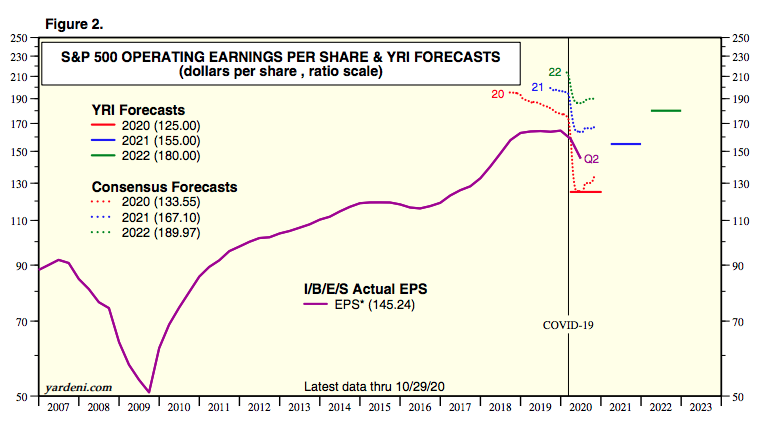
The #1 reason for which I buy market dips is always the trajectory of earnings growth, and that trajectory continues to improve with each passing week. I don’t buy with the expectation of P/E expansion, but if it should come to pass, so be it, as I do generally hold such a model. Moreover, and as shown in the chart below, FY2020 consensus analysts estimates call for EPS of $133.55 versus the prior week at $132.13. The earnings trend is quite friendly and becomes that much more friendly in 2021.
Next week will prove the culmination of a long Q3 2020 earnings season. In the coming week, retailers will round out the season with companies like Wal-Mart (WMT), Target (TGT), Macy’s (M), Kohl’s (KSS), Lowes (LOW), Home Depot (HD) and more reporting.
2020 can’t come to an end soon enough. I’m sure many hold that opinion and as we struggle to find confidence with regards to the next Inauguration Day, given a concession has yet to be found from the Presidential candidates.

Don’t worry folks, we will get beyond 2020 and we will have a declared and inaugurated President of the United States of America. All in due time and realize the difficult times of today are but a passing moment in time, much like market consolidation. Investors who rationalize the current market consolidation using the following key points are likely to breeze through the next month or two:
- Market consolidation is an operational commonplace and to be expected.
- The final 2-months of the year usually deliver positive results and a Santa Claus rally.
- A vaccine distribution period is near-term and Moderna is likely to announce positive Phase III results as well.
- Science has delivered a vaccine in record time, while media pundits and analysts have largely heralded the improbability of such feats of strength. The media often highlights pessimism and fear. You might avoid the hyperbole and emotional discourse.
- If as an investor/trader you can click the buy button and not concern yourself with near-term drawdowns, understanding that volatility is a normal part of the investing landscape, you’re well ahead of many.
- Know the history of markets suggests 2021 is also likely to produce positive returns. (See chart below)
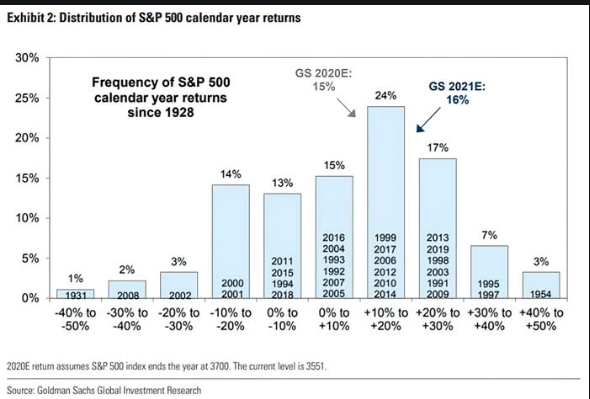
With the historic chart of market returns above, recognize that near-term market weakness is probably your opportunity to buy the dip. When stocks go on sale, liken it to a sale at your local department store, not something to be feared, but something to find with favor. And yes, 2020 remains very much like 2009 whereby investors had no greater certainty for 2010 as they do today for 2021. The circumstances are different today when compared to 2009, but human behavior has proven quite constant.
If we rewind to April, recall the following data from LPL Financial:
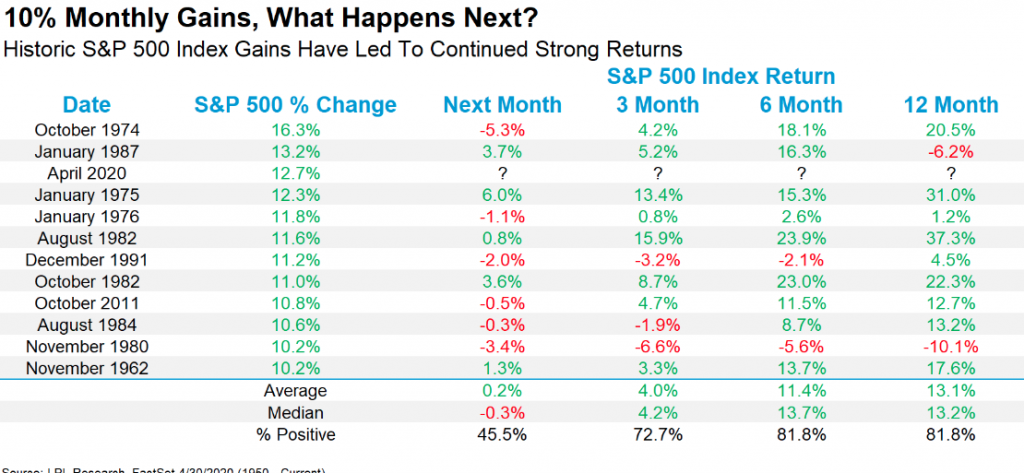
In April the S&P 500 gained more than 12% for the month. Ten percent monthly gains tend to resolve that much higher going forward, as shown in the study above. The average return 6 months after a huge gain was 11.4 percent. The S&P 500 this time around gained 12.3% the 6 months after a huge month and is up 81.8% of the time. Now look at the 12-month’s return after a huge 1-month gain. History is still on your side bulls and while history doesn’t always repeat, the probabilities look quite strong. Before we get there though, here’s another frightful statistic for Friday The 13th.
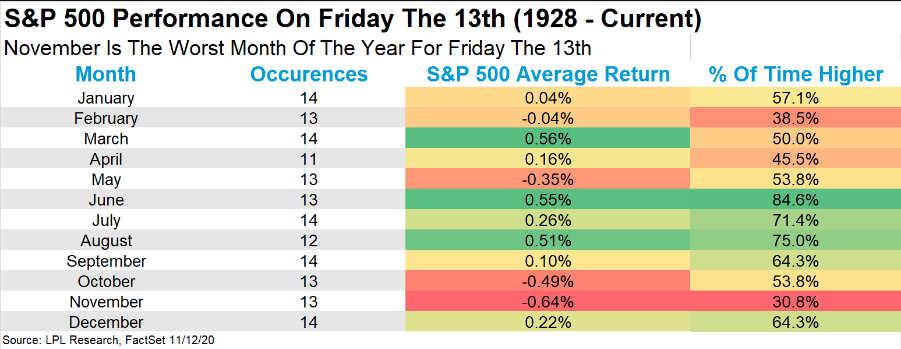
The worst month of the year for stocks on Friday The 13th is November. 2020, can we not just end this year already!!


