
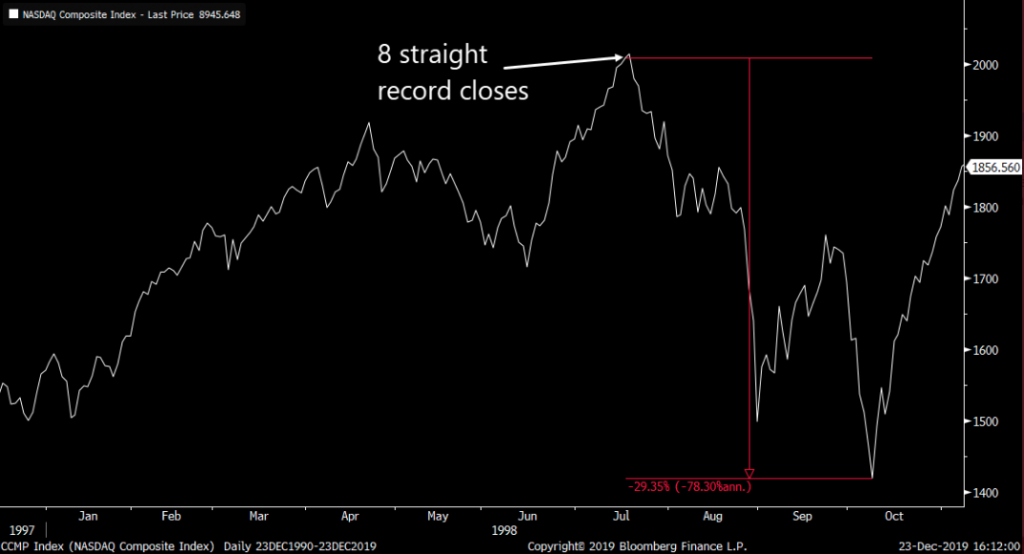
Once again and with the defined Santa Claus rally in full effect, the major averages finished higher on Monday. The Dow Jones Industrial Average (DJIA) led the way with a gain of nearly 100 points or up .34 percent. The S&P 500 (SPX) was up nearly 3 points with another record close and the Nasdaq (NDX) rose 20 points, up .23% on the day. Monday made 8 straight record closes for the Nasdaq which happened only once before. What happened thereafter wasn’t too pretty, but keep in mind the sample size is just ONE! (1998)
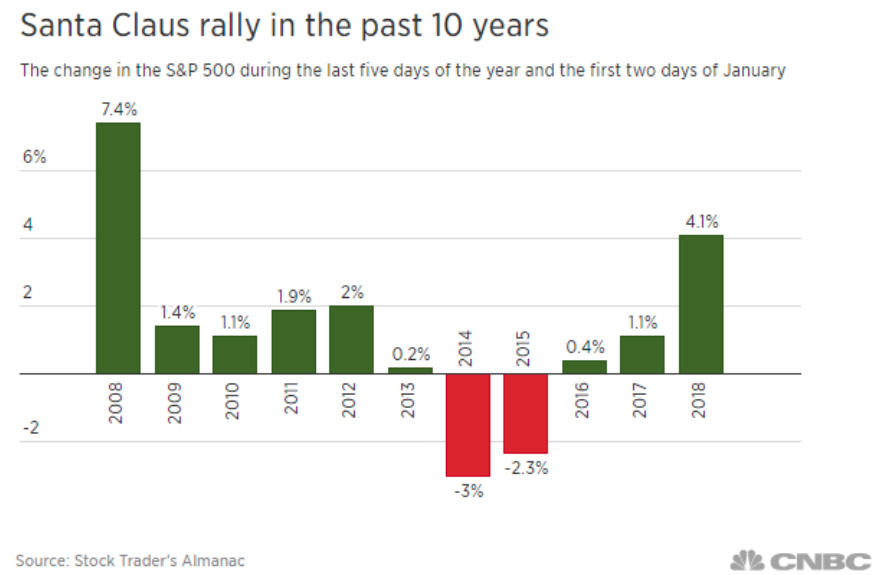
As the markets’ rally continues to leg into the final trading days of the year it’s clearly embracing the Santa Claus rally. The stock market tends to produce a strong performance during the final five trading days of the year and the first two trading days of the New year, which Wall Street defined as “the Santa Claus rally.” The S&P 500 has posted a 1.3% gain on average since 1950 during those periods, according to the Stock Trader’s Almanac.
Despite the pain felt amongst the investor community in December 2018, the Santa Claus rally did actually take place, even if only delayed until the first trading day after Christmas.
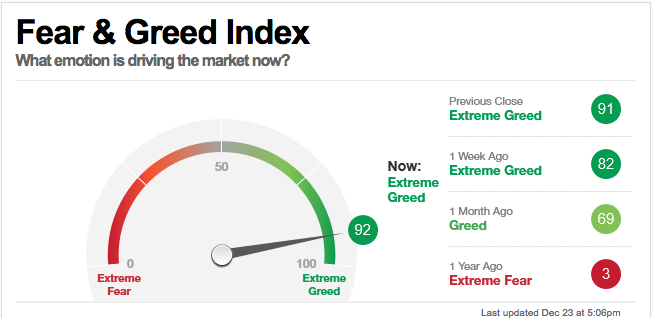
Investors are feeling more optimistic about equities in Q4 2019 and as we approach 2020. The level of fear has been reduced in the market as investors have become increasingly greedy according to the latest CNN Fear & Greed Index. While many might think this to be a contrarian indicator, it is usually better to await its turn from Greed to Fear before attempting a contrarian market position.
With the market’s “fear gauge”, the VIX, also at relatively complacent levels through much of the 4th quarter, protection hasn’t been the agenda of the average investor. While the headlines in 2019 haven’t been found without a certain amount of angst surrounding trade war threats, recession probabilities in the future and FOMC mandate efficacy, the markets have behaved oddly well. The odd part is that for what seemed to be weekly anxiety surrounding the trade war and other economic threats, markets have been relatively calm.
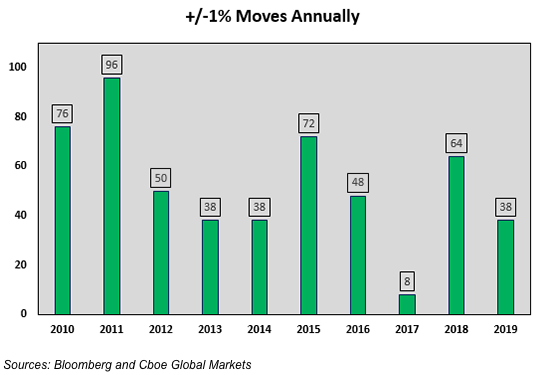
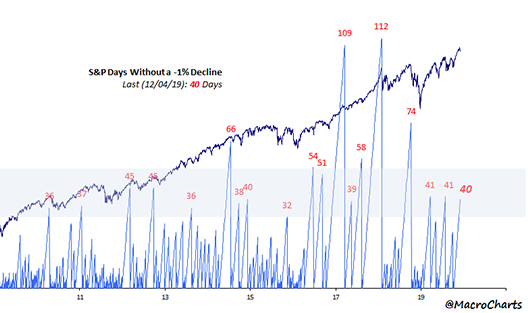
There are usually 252 trading days in a calendar year. Over the past decade, on average, there have been 52.8 moves of +/-1% (close over close) in the S&P® 500 per annum. Through December 6, there have been 38 in 2019. So over the past decade, on average, there’s a 1% S&P® 500 move roughly once every five trading days. The chart below lays out the data.
The last 1% decline in the S&P 500 Index was October 8. There have been 51 trading days since the last 1% drawdown (close/close) in the S&P 500. There were two other stretches in early- and mid-2019 that ended after 41 day “droughts.” There was also a stretch between late 2017 and early 2018 where the S&P 500 didn’t decline by 1% for 112 straight sessions.
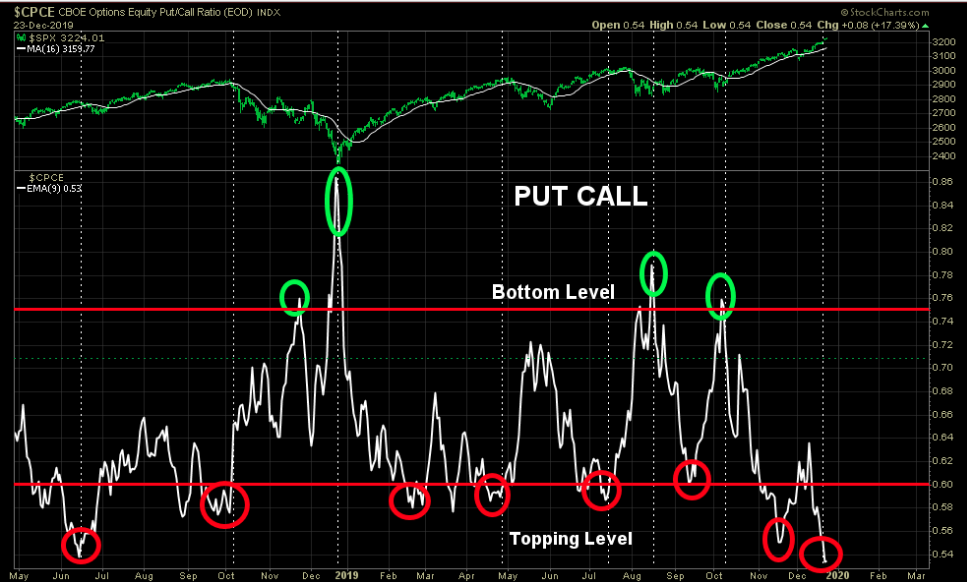
And if the tranquility in the S&P 500 doesn’t convince one of how complacent the market has been and how strong the trend higher has been, we can always look to equity put/call readings. According to the CBOE’s Equity Put/Call ratio, investors have been found without the need for protection in the event of a market correction.
Markets have gone for a tremendous ride to the upside of late, which generally marks an end of a rally near-term. It wouldn’t be a bad idea to align oneself with the notion that in Q1 2020, a reasonable 3-5% correction ensues.
Moreover, if there is one variable on investors’ minds when it comes to a possible market moving event near-term, it’s an end-of-year repo spike. Repo-market participants need funds at the end of the year, when financial institutions wind down their lending operations to avoid receiving regulatory surcharges that impose requirements for holding additional capital. The worry is that in the absence of banks providing cash to short-term money markets, investors will be faced with a similar spike in rates experienced in mid-September, when the borrowing rate for financial firms jumped from around 2% to 10 percent.
So why is there a repo-rate problem being forecast and feared at year’s end? For one thing, the recent rise in stock-market values can lift the scores that determine whether a financial institution is considered too-big-to-fail and compel the firm to raise more capital as a buffer against losses — possibly translating into a bank that is less inclined to extend loans. These liquidity coverage requirements, as part of the Basel III banking rules, were introduced in the wake of the 2008 financial crisis.
Unlike 2018 when the market and bank assets were devalued, this year the asset values are rising and as such the repo-rate issue was absent in 2018 but present and of concern in 2019. But should it be of concern is the real question that J.P. Morgan’s analysts led by Josh Younger aimed to answer in recent notes to clients.
“A key difference this time around, however, has been the sharp rally in bank equity valuations.
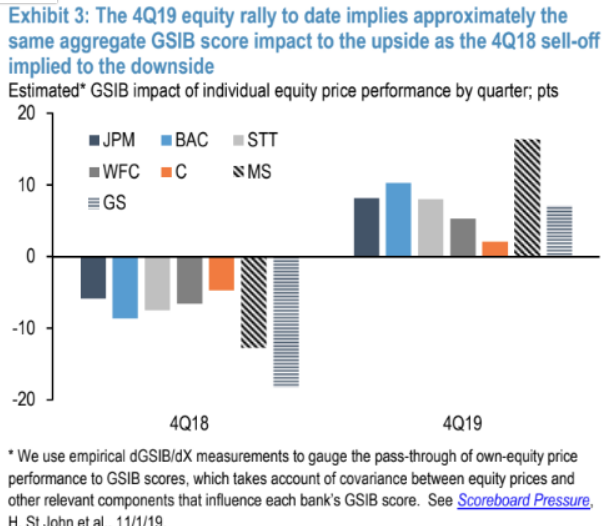
Since the end of the third quarter, the rally in bank stocks have contributed to a 57-point increase on the G-SIB scoring system across the U.S.’s major banks, according to J.P. Morgan estimates. This was a reversal of the fourth-quarter of last year when U.S. equities were pummeled, dragging down their G-SIB scores (seen in chart below).
The Fed is adding funding to the market presently and as of last week, market participants don’t seem to much “in need” of all that the Fed is offering by way of short-term lending provisions through it’s repo operations. Market participants did not fully take up the $35 billion of 14-day repurchasing operations offered by the Fed last week Thursday morning, as part of an estimated half a trillion dollars that the Fed could pump into short-term funding markets for the year-end period. The Fed’s website shows that $31.3 billion of bids were accepted.
Scott Skyrm, executive vice president at Curvature Securities, said in a tweet that an under-subscribed term repo operation could indicate that overnight lending rates at the year-end period may not climb to worrisome levels as some feared. Skyrm also hinted that it’s possible to reach another conclusion; banks may no longer have enough capacity on their balance sheets to borrow funds from the Fed’s repo operations.
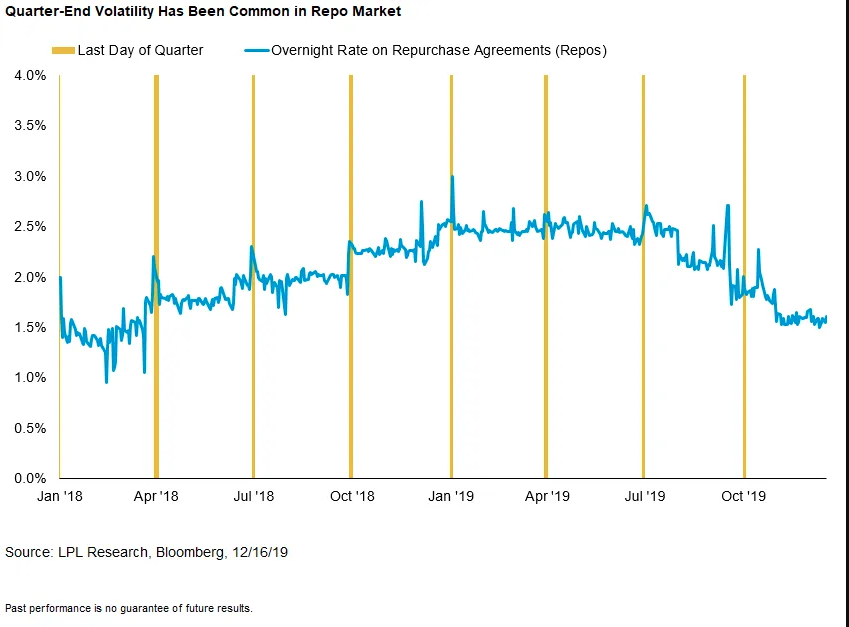
As shown in the LPL Chart, repo market liquidity gaps are common around quarter-end as corporate demand for cash typically increases.
One way or the other, the answers surrounding the repo-market will be found soon enough. Finom Group isn’t of the opinion the end-of-year/quarter/decade repo market concern is one that will prove systemic or material whatsoever (redundant I know). The repo market is only a fraction of the size it was before the 2008 Great Financial Crisis, when surging lending rates ultimately led to a significant breakdown in fixed income markets, aiding in the exacerbation of equity market fallout. Beyond this obstacle for funding markets lay 2020, for which many expect a continuation of the 2019 markets’ rally. On Monday, it was suggested by Thrasher Analytics that after a year in which the S&P 500 gains 30% or more, the following year is often found with markets struggling.
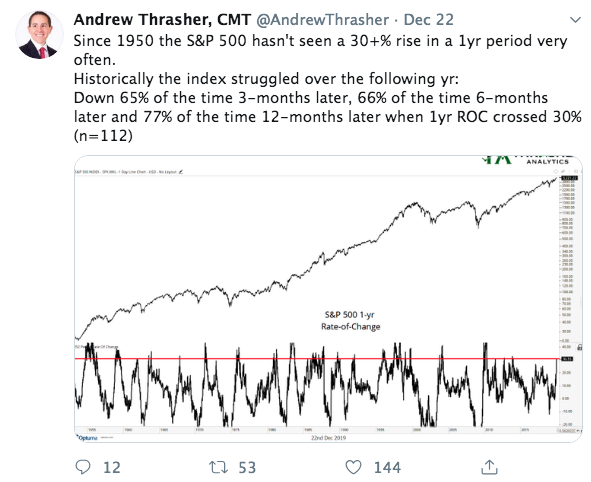
Finom Group ran its own study and found a very different outcome for markets. The following table identifies all the years in which the S&P 500 gained 30% or more and the returns for the very next calendar year.
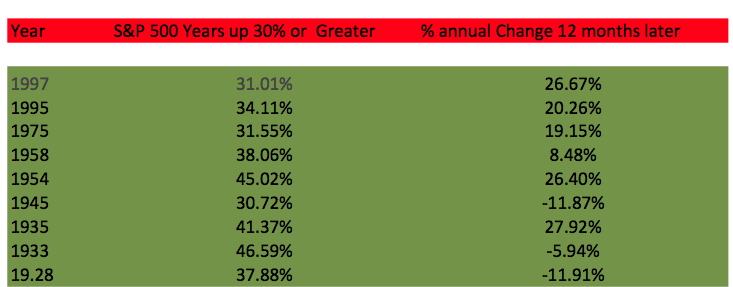
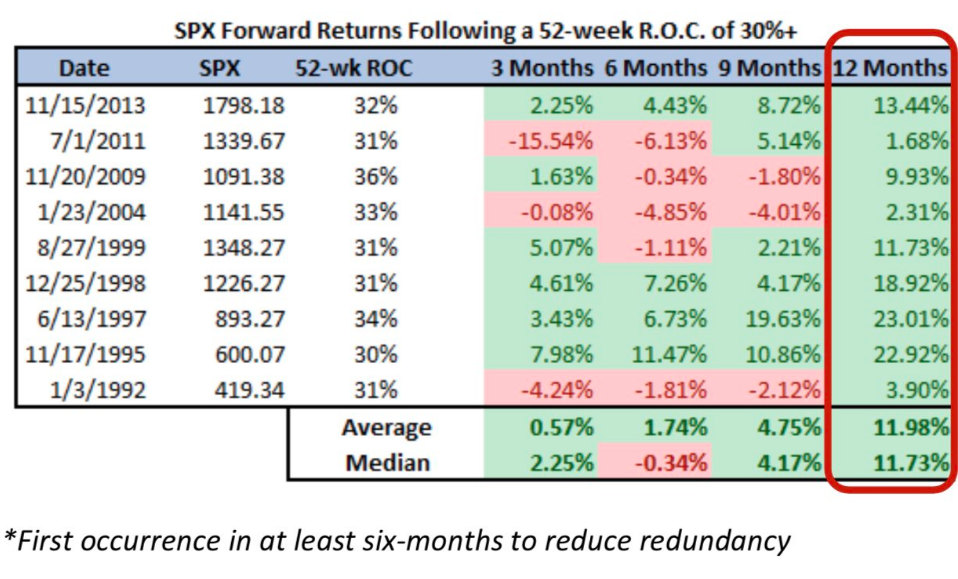
Of the 9 times the S&P 500 produced a 30% or greater return in a calendar year, only 3 times did the index finish lower in the next 12 months. Since the 1950s, the S&P 500 has never been lower in the following 12 months after producing a 30% gain or better. Keep in mind that this study on the S&P 500 was not inclusive of the index dividend. If we include the dividend it looks more like this since the 1990s…
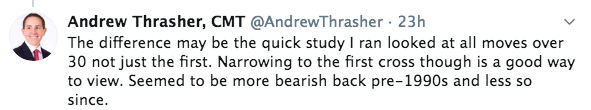
Anyway you slice it, dividend or ex-dividend there is simply no way we can accept the findings from Thrasher Analytics as valid. Data can be incongruent sometimes and highly dependent upon the parameters offered, something we think Thrasher Analytics recognizes per a recent tweet that questioned their original findings/offering.
Data tracking CRIME anyone?? That is what we aim to uncover at Finom Group. We sift through the various statistics to find the facts and develop a more sound view on forward-looking market probabilities. We wouldn’t be of the opinion that chart crimes or even data tracking crimes are intentional, but sometimes they are a matter of starting and endpoints.
We’ve seen a ratcheting upward of 2020 S&P 500 price targets lately. Julian Emanuel, BTIG managing director & chief equity and derivatives strategist, offers his prediction for the S&P 500, with CNBC’s Scott Wapner last night and suggests that 4,000 isn’t out of the question.
One of the reasons Emanuel offers this bullish probability for the S&P 500 is predicated upon the strength of the markets in 2019. Statistically speaking, once again, after a strong year the market tends to keep with strength into the following year.
“After years like 2019, the average return 12-months later is 14%, said Emanuel.”
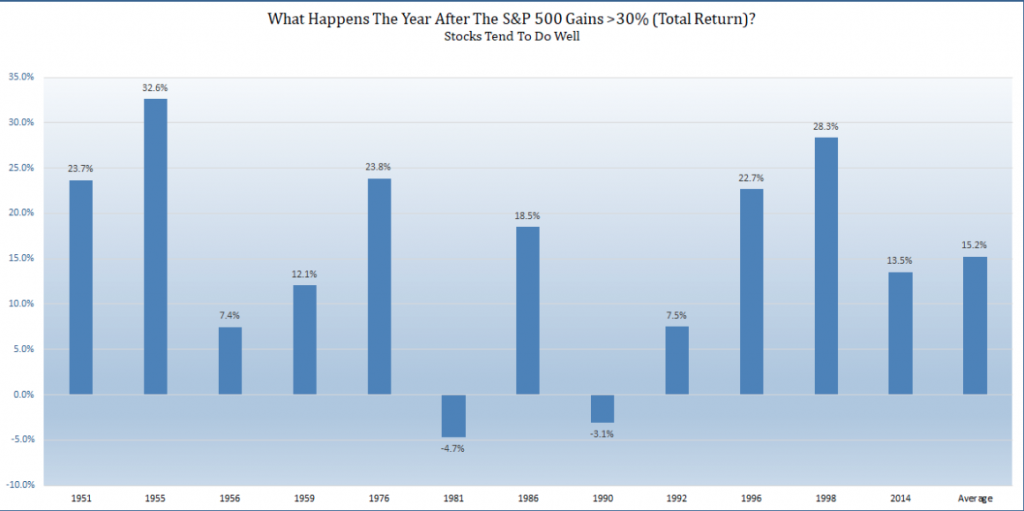
Actually, Emanuel was undercutting the statistical data as we discovered by way of LPL Financial data. S&P 500 could be up >30% (total return) in 2019. Historically, the following year has been higher 10 of 12 times and the avg. return is 15.2 percent, as shown in the bar chart below.
Again, starting and endpoints matter, but we’re not going to worry over a percentage point, given the double-digit gains purported by both Emanuel and LPL Financial. Markets shmarkets, nobody knows what the future may hold and history doesn’t always repeat. Having said that, the goal of due diligence is to seek out and discover the probabilities going forward, as nothing is guaranteed. Now let’s check out some of the latest economic data.
New home sales for November were reported at 719,000. Sales for the previous three months were revised down, combined. Sales were above 700 thousand SAAR for four consecutive months, and in five of the last six months, marking the best six month stretch since 2007.
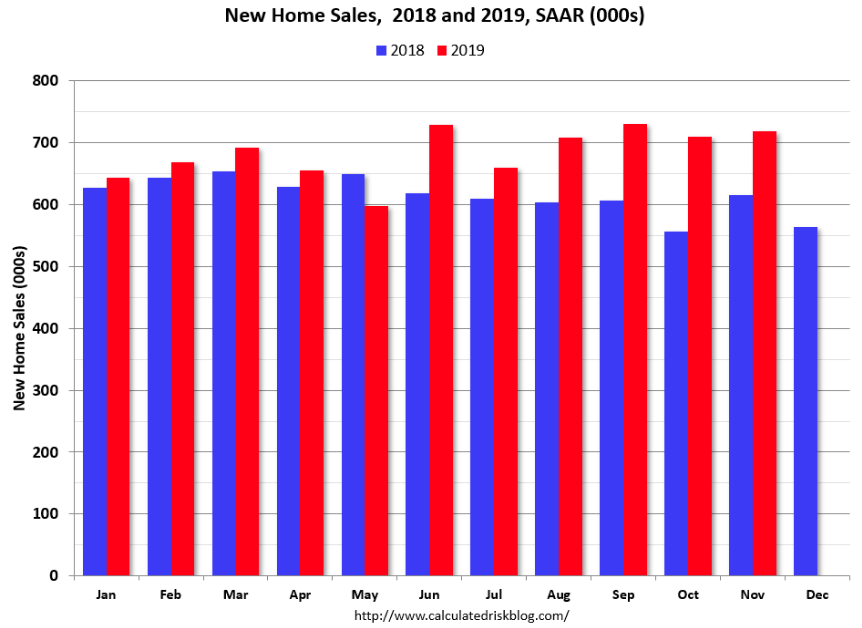
Sales of newly-constructed homes in the U.S. increased 1.3% on a monthly basis in November. Sales in November were up 16.9% year-over-year compared to November 2018. Year-to-date (through November), sales are up 9.8% compared to the same period in 2018. The comparison for December is easy, so sales will likely be up double digits in 2019 compared to 2018 – a solid year for new home sales, according to Bill McBride.
The government estimated there was a 5.4-month supply of new homes available for sale, up slightly from October’s 5.3-month supply. The supply of new homes last peaked at the 7-month level back in December 2018.
Housing sector data has remained very healthy/strong since the spring and it looks like the strength has the ability to persist into the Q1 2019 period, and as long as rates and the unemployment rate remain low while wages are rising.
Unfortunately, the strength from the Housing sector data was not felt in Durable goods orders. Orders for durable goods sank 2% in November. This is the biggest decline since May. Economists had expected a strong 1% rebound in durable-goods orders in November as a result of the end of the General Motors (GM) strike. But orders were dragged down by a major decline in defense aircraft combined with a small drop stemming from Boeing’s (BA) ongoing issues with the 737 MAX.
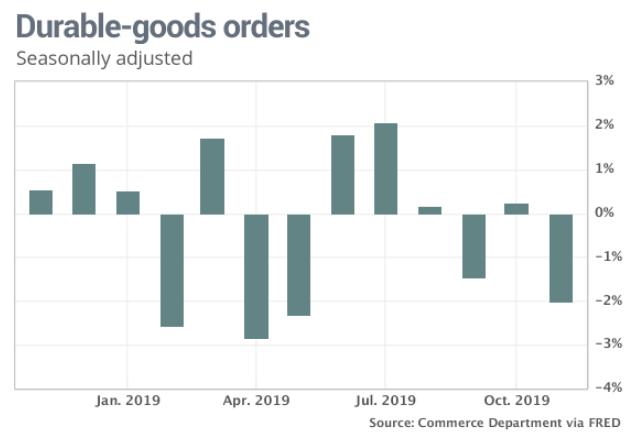
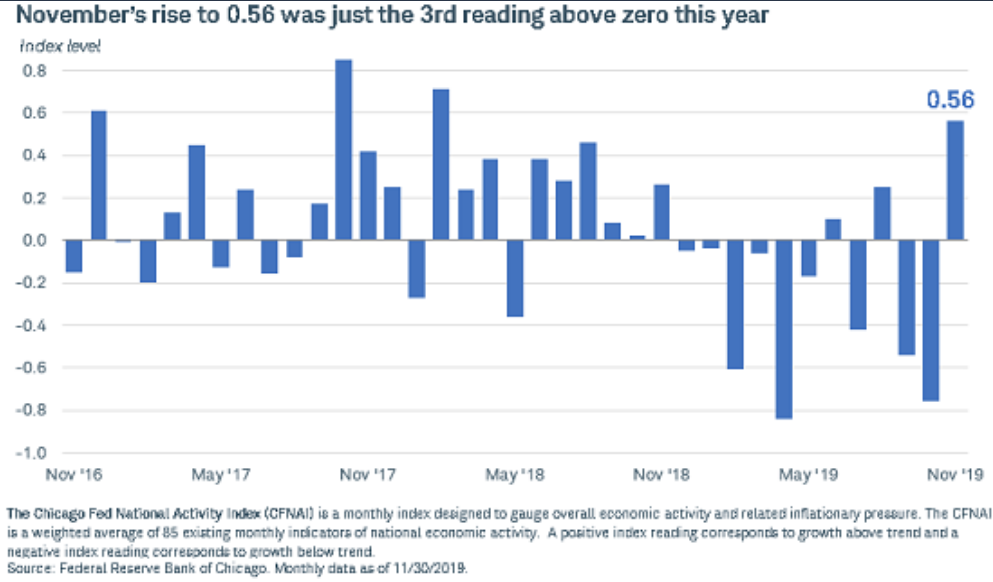
Orders in October were lowered to a 0.2% gain from the prior estimate of an 0.5% increase. On a more positive economic data note, the Chicago Fed National Activity Index rose to produce the strongest reading all year.
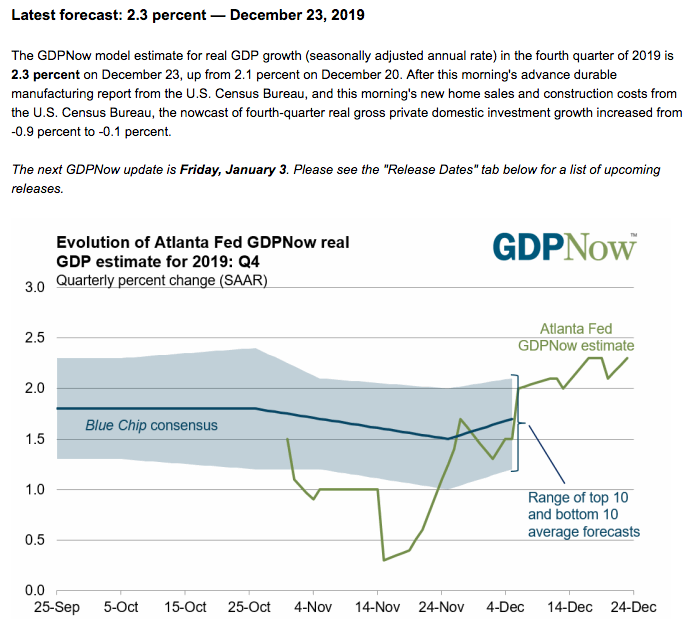
With these 3 main economic data releases on Monday proving mixed, but mostly positive, Q4 GDP forecasts have been revised. According to the Atlanta Fed GDPNow forecast, Q4 GDP is now expected to rise 2.3%, from a previous forecast of 2.1 percent. The next revision is due out on January 3, 2020.
Looking back on 2019, which obviously hasn’t culminated just yet, we can’t help but to think of what could have been. The tailwinds from the Tax Cuts and Jobs Act of 2017 should have been more lasting. Unfortunately it appears as though the tailwinds have been obstructed by the headwinds from uncertainty surrounding the protracted U.S./China trade war. The tailwind from this issue also pulled down European economies, as China proved the largest trading partner for the German economy. Much of the economic growth that should have followed 2018 into 2019 was offset by the trade feud. Fortunately, as we round out 2019, the trade issue may take a backseat with an impending phase-1 trade deal and a more concentrated focus by the White House administration on the presidential election cycle. No incumbent has ever won re-election during a recession. It’s only one of the many reasons the White House Administration will do what is necessary to keep the engine of the economy humming along in 2020.


