
After beginning the trading session on the lows Monday and for the first full trading week of the New Year, the major averages rallied throughout the day and to finish at the highs of the trading session. One thing was made very clear during Monday’s turnaround, FAANG delivered the biggest support for the market, ultimately pulling the broader markets higher as the day moved forward. When it was all said and done on Monday, the S&P 500 traded down some 18 points at the open only to finish higher by 11 points and producing a nearly 30 point intraday move. This is what we refer to as realized/historic market volatility that doesn’t necessarily find itself identifiable in the volatility index (VIX) itself. The VIX is a measure of implied volatility over a 30-day period, not realized daily market volatility.
With a little fearful trading carried forward from last Friday’s market downturn, which is centered on the newly arisen U.S./Iran conflict, the VIX nearly touched 16 in the premarket trading hours Monday. As the market was bought up from the opening of trading on Wall Street, the so-called “fear index” also tumbled throughout the day and finished in the red. Speaking of volatility or more volatility given the abundance of hedging activity that has proliferated alongside the S&P 500 achieving multiple record highs through December and early January, the latest Northman Trader a.k.a Sven Henrich “missive” was published by Zerohedge on Monday. To know Sven Henrich is to know his permabear narratives and fear-driven promotional materials. It’s not to say that a trader/investor can’t find value in them, but confidence would certainly be found wanting, as most of his “market crash” publications simply never come to fruition. Recal his November 11, 2019 publication via Zerohedge titled VIXtermination and Megadeath?
Oh that Sven Henrich and is colorful titles and chart patterns. Need we offer any adjectives of greater characterization? And from within that hopeful November 11th publication, here’s just some of what he had to offer readers, which could only be recognized as pessimistic, bearish and be found with thousands of traders whom read the article. Had you hedged your long exposure, what you really did was tax your potential profits.
“Since the summer I’ve stated clearly: For bulls to convince they need to break above the trend line, then successfully retest the trend line and then they can move onto the melt-up move if that’s what they want to do.
Does this confirm a breakout? From my perch the answer is no as no retest has taken place yet, and without such a successful retest risk remains that the breakout will prove to be false.“
In Sven Henrich’s latest, bearish market breakout dismissal for cause, as he believes there to be cause, he also fashions a narrative pertaining to the VIX complex.
“And it is right here in this moment in time that VIX short positioning has taken on record proportions, exceeding even the previous record short right at the January 2018 highs right before holders of the doomed $XIV product got massacred as VIX exploded higher:
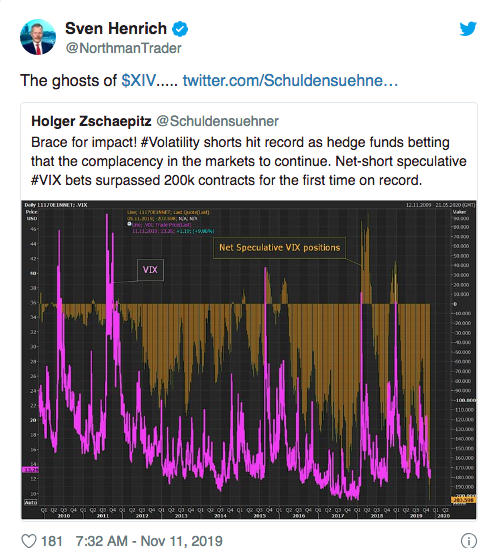
“With many participants celebrating the demise of the megaphone pattern they are doing so with $VTI not yet having exceeded the upper trend line and record short $VIX positioning in place. Perhaps it is not the megaphone that will experience megadeath, perhaps it will be complacent positioning.”
So here we are with the market clearly haven broken out before and beyond November 11th at least and trending bullishly with a melt-up having occurred through year-end 2019. And we are also sorry to announce that there was not another XIV-like event for which was so colorfully offered in Sven’s tweet.
WRONG! If there is one thing that Sven Henrich knows how to do consistently and with inserted caveats narrated for the sake of those known consistent failed forecasts and analysis, it’s WRONG! But of course we emphasize WRONG with consistency.
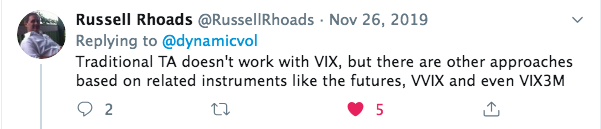
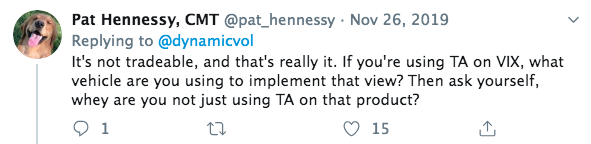
We have chronicled the failed forecasting and analysis of the Northman Trader over the years; the early 2019 failed forecast also comes to mind. In this analytical piece published by MarketWatch in March 2019, the offering once again stokes fear by attempting to chart, yes chart the VIX. One more time if you’re not paying attention, chart/technical analysis the VIX. This is a no-no folks!
There’s no such thing as using technical analysis on a stochastic, oscillating process that is an un-tradable derivative. Yes, that is what the VIX is folks, all of that coupled without the ability to trade it. Technical analysis conducted on the VIX lacks efficacy and/or utility Technical analysis does not apply to volatility as it’s a statistic and not a security which is what technical analysis would apply to as securities have a supply:demand equation.
Here is what Sven offered in his March 2019 missive to review:
One would have been warned nearly 2 months too early before the markets began pulling back in mid-May with an uptick in volatility that barely held the VIX at 20 for more than a day. Nonetheless, Henrich warned of the VIX possibly achieving 50 based on his chart offering in the March narrative:
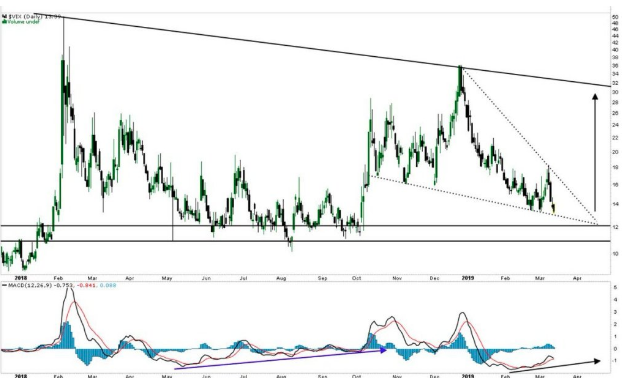
“This chart shows relative strength in VIX despite lower prices while forming a bullish pattern. It supports not only the notion of a VIX gap fill at 24/25, but perhaps a spike into the 30s. She also still has a pattern that suggests a potential run to VIX 50 coming.“
So much for mid 20s, 30s and of course VIX 50 as none of the offerings came to fruition. Why is all of this relevant you might be asking? Well, for a former fund manager of sorts, YouTube personality and frequent guest on CNBC with hundreds of authored narratives found with remarkable failed forecasts, Sven has a new one for traders/investors to consider. If there’s one thing to consider when it comes to his narratives that we can say is that they are also more recently found for recognizing the Fed’s efficacy for providing sentiment to financial markets. Finom Group denotes and more accurately characterizes the sentiment provisions from the Fed, while Sven says the Fed is pumping the market/SPX with liquidity. His understanding is completely at odds with the facts, which are irrefutable.
Finom Group has outlined throughout 2019 that market liquidity was poor and as the final quarter of the year rolled around, liquidity hit its lowest levels. This, of course, while the Fed was deemed “pumping the market full of liquidity”. The Fed was definitively buying up treasuries and expanding its balance sheet, but as it pertains to the equity markets, and at best, all it can provide is a sentiment boost amongst investors who would otherwise lack risk appetite for equities. Recall from our December 8, 2019 Research Report discussion on market liquidity:
“Nonetheless, we’ve denoted recently that that corporate buybacks have contributed to an already low liquidity market regime, which is aiding as a backstop during any pullback. Trading volumes in U.S. equities are also at record low-level.“
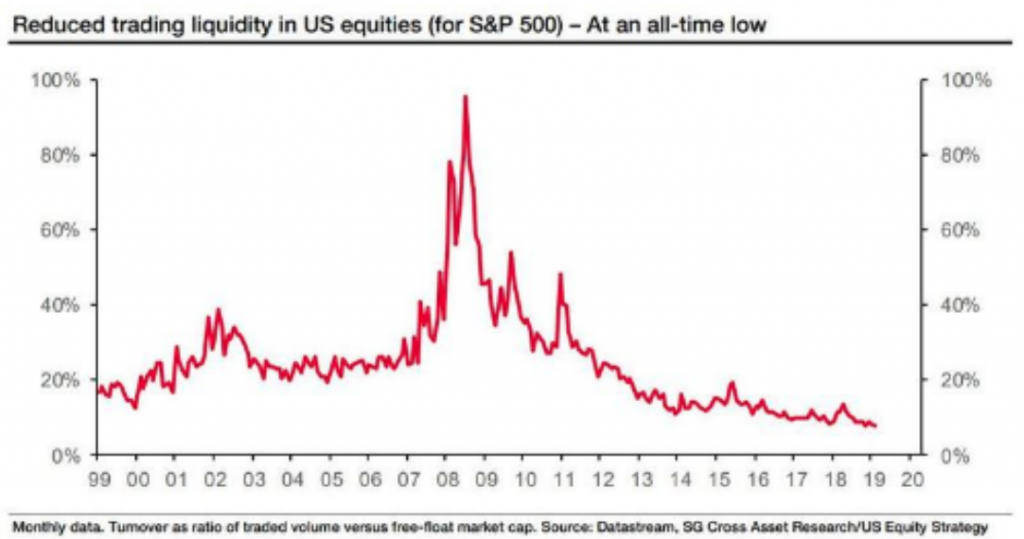
“The lack of market liquidity, as measured by S&P 500 turnover – the ratio of trading volume vs free float market capitalization – has exacerbated the impact of share repurchases on U.S. equities”. (SocGen)
Those are the facts folks. You don’t have to like facts, but if you choose to ignore facts you likely do so to your own detriment. And let’s not confuse facts with fake news if you will. Believe it or not there is also a difference between right/wrong and fake news. By and large, what is characterized as fake news is simply the news one doesn’t like or something that is misreported without actual intent; the report is simply found with error in the future. And that’s what Sven Henrich has been found with more often than not. He’s not offering fake news, just errand/wrong analysis/forecasts. Does he learn his lesson? It’s unlikely if you’ve just read the facts about market liquidity compared to what he thinks qualifies as market liquidity, driven solely by the Fed. In his latest YouTube discussion he literally states the following at the very onset of the video:
“This is the first video I’ve done in the last few weeks because there was no price discovery courtesy of the U.S. Fed.”
Within the first several minutes of the video he goes on to correlate the totality of the 2019 S&P 500 gains with Fed activity, low rates and balance sheet expansion. Finom Group doesn’t discount some of this as playing a role, but Sven wasn’t complaining or sarcastically debasing the market when it was declining in 2018, which if you review the liquidity chart above of the S&P 500, shows the exact same liquidity levels to that of late 2019. Fed hiked, liquidity was low. Fed eased and grew its balance sheet, liquidity was low. Fed be darned folks, as Sven’s understanding of Fed activity and market liquidity are misnomers and falsehoods. His lack of understanding won’t lead us to suggest he’s spreading fake news, but rather that he might be found one day with a greater understanding. But that is what Finom Group is here for and has been doing over the last couple of years, debunking false narratives from the mass media offerings. And that brings us to…

That’s right folks, Sven Henrich’s latest and greatest VIX forecast is offered through his Zerohedge publication. So let’s get into it shall we and now that we’ve reviewed some of Sven’s previous failed calls if not altogether un-tradable calls, as outlined by his VIX technical analysis focus.
“US markets experienced two major volatility events with $VIX running above 40 twice during the past 4 years: 2015 and 2018. In both cases the $VIX spiked into the high 40’s. Charts suggest another volatility event of such magnitude may be coming in 2020.
Volatility events of this magnitude are rare these days. Indeed volatility is again very much contained as it always is when central banks are intervening. And ever since the Fed went from tightening to flip flopping and then outright cutting and balance sheet expansion the $VIX has been engaged in a pattern of lower highs since the December 2018 lows:
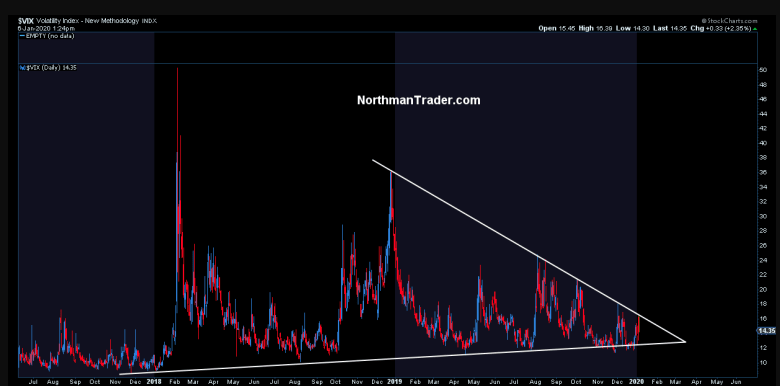
Sven loves his triangles and megaphone pattern charts. Ohhhhh, they are so pretty and uniform!
“But look closely at the chart. There is a lower trend line as well and despite all the liquidity injections and despite the torrent run in equities with little to no two way price discovery in December the $VIX continues to hold support, support that has held since late 2017.
So you see a compression pattern has formed. A massive one. Lower highs on the one hand and higher lows on the other hand. This pattern is coming to a conclusion sometime in the first quarter. We can’t know when, but it’s clear the pattern is running out of gas.
How meaningful is this pattern? See for yourself:
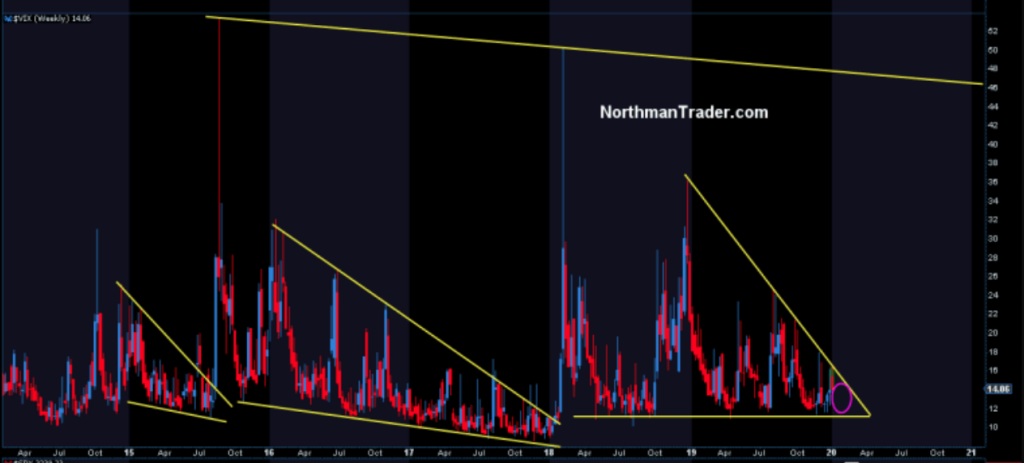
“The previous mega spikes in the VIX came following compression patterns and ironically the spikes came as the compression patterns were running out of gas, most infamously in late January 2018 going into February 2018 following another massive liquidity rally. One can’t help but compare the situation to now. In 2017/2018 the liquidity run came as a result of the US tax cuts, this liquidity run here being Fed driven.
During the previous events $VIX spiked into the 40’s. As $VIX appears to be very precise with its patterns one can envision a run toward the upper trend line connecting the two previous spikes to bring about a correction that could go a long way to fill many of the open market gaps.”
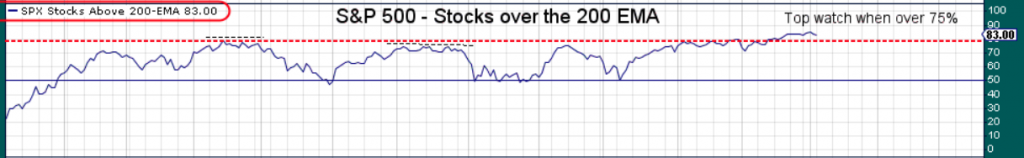
Alright, enough about Sven as Finom Group is also of the opinion that a rise in volatility to some degree, which we won’t wast our time on forecasting as it is a futile exercise, will be in store for markets near-term. Simply put, the markets remain overbought and with breadth at elevated levels. The percentage of S&P 500 stocks trading above their 200-EMA is currently at 83%, typically where the market proves to top and subsequently commence a pullback or distribution phase.
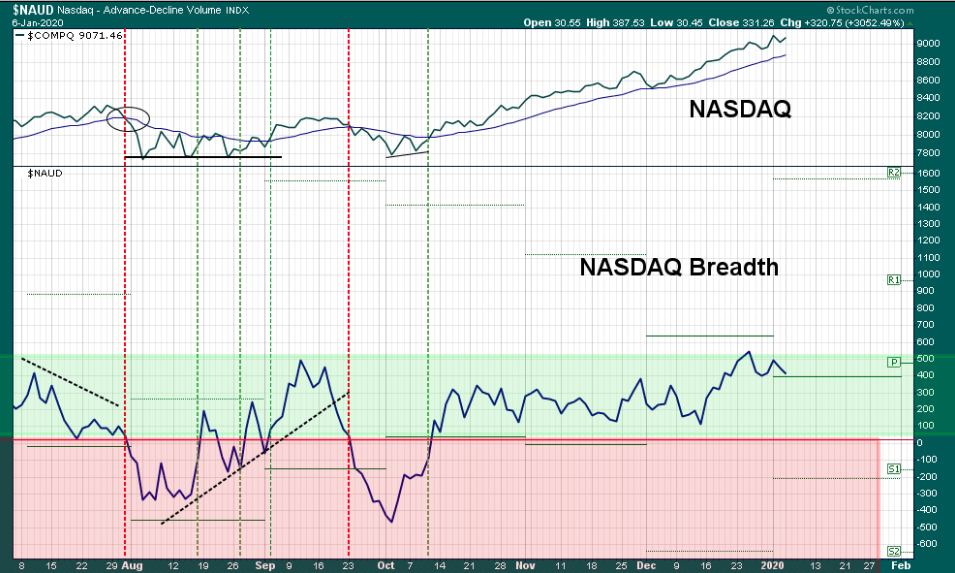
A quick look at the Nasdaq’s (NDX) breadth also identifies extreme sentiment and/or market internals at work. At some point, investors will find a catalysts that reinforces investing disciplines such as profit taking and rebalancing.
While overbought conditions and strong market internals have been persistent for at least the last 2 months now, it’s anybody’s guess as to what will spark a countertrend move in the markets. One would have thought the latest U.S./Iran flare-up would have done so, but even that seems to have a fleeting market impact. It’s early in this latest geopolitical issue, however, and with many still waiting for Iran to retaliate against the U.S. and/or U.S. interest. For this reason alone, CNBC’s Jim Cramer suggests that investors exercise caution near-term.
“I’m still recommending proceeding with caution, at least until we get a clearer sense of Iran’s next move.
If this turns out to be like the last few conflicts,” such as heating tensions with North Korea in 2017, Syria in 2018 and Iran last September, “then history says … you needed to buy when things were most ugly, which would have been this morning.
The market is overbought and that there’s “way too much complacency” and “not enough fear.
I think today’s buyers … [are] being a little too glib. We have no idea what Iran’s going to do, but they seem pretty darned resolute — seems irresponsible to bet that they’ll just let this thing go.”
While Cramer admittedly thinks dips will to have been buying opportunities longer-term, Mark Newton of Newton Advisors says the market will rise in the coming days.
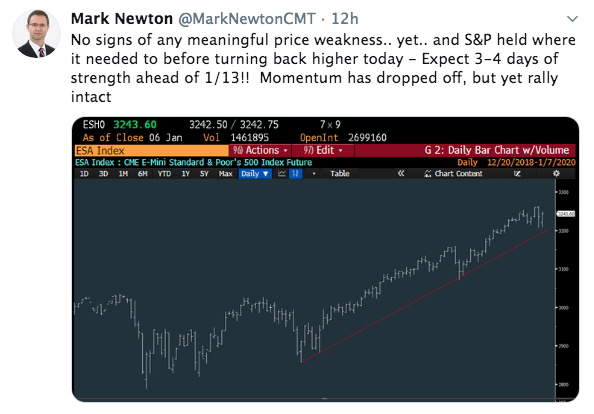
Well, what do you think folks? Will Newton’s latest forecast prove accurate? Keeping in mind these widely popularized advisors, television personalities and permabears have thousands upon thousands of followers on Twitter, that doesn’t mean they have a good track record or even meet the benchmark average return annually for their own portfolios. Most of these folks underperform, to even Jim Cramer’s admission. But again and as it pertains to Mark Newton’s forecast it pays to have tracked these folks over the years. Here is the most popular and recent forecast offered by Newton and as we chronicled from the past.
Back on October 30th, Newton was on CNBC promoting a pullback in Apple (AAPL) shares heading into earnings.
“Coming into the Company’s earnings report, Mark Newton of Newton Advisors expressed worrying signs for the technical trading aspects of AAPL shares. In looking at the relative strength of the stock, he suggested the stock would pull back, as the breakout was concerning. “I don’t like the stock all that much here.”
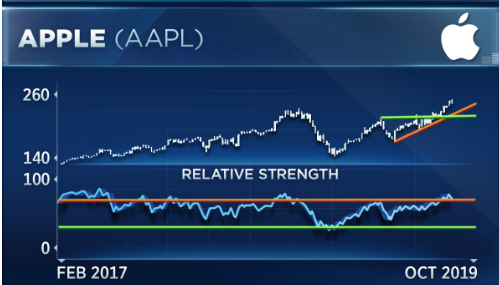
“The stock is a lot higher than we were when we peaked last September, but yet momentum is nowhere near that,” Newton said, adding that Apple’s weekly chart, above, shows “what we call negative momentum divergence, [which] can be a problem in suggesting if a stock likely has gone a bit too far too quickly to the upside.”
Well, that call on AAPL didn’t work out! But one poor stock call doesn’t exonerate the worth of Newton’s total works would it? Of course not, but that’s why we also offer his late October S&P 500 call to accompany the failed AAPL forecast. See his notes below, which we chronicled back in October, below:
“Market Newton of Newton Advisors is expecting for the S&P 500 to reverse course “next week”. We highlight the quotes because he barbells the occurrence happening either at the beginning of the week or the end of the week.
In Newton’s latest notes, he discusses his outlook for the coming trading week as follows:
“I am expecting a reversal of trend for the S&P 500 Index, which might start Friday, or early next week. Market breadth should be peaking today. The uptrend has not followed through as robustly as I thought possible last week.
Market breadth is starting to wane, and could start to turn down in the next few days. Stock indices like SPX have largely stalled out near former highs. While a push to minor new highs was thought possible into late October, the risk/reward is poor for new longs here, and Defensive positioning continue to be recommended. Upside resistance lies near 3014 and then 3027-45, while downside support is found at 2975-82 and thought to be important.
Overall, most of the cycles related to late April and July are all pointed to late October for some kind of turn and given the rally in October, it’s thought to be a peak. Defensive sectors have outperformed, not just for the last week, but the 1, 3 and 6 month basis, despite some Technology strength to hold up stocks in the last month, largely out of the large-cap Value space like Apple, while Semis have also held up, albeit in a shaky fashion. The fact that Equal-weighted Tech has turned down sharply to new monthly lows relative to the SPX is a minor concern here, as its thought that the broader space should be vulnerable in the weeks ahead. For now, while most S&P targets are up near 3027-45, the price action in the last week has been more consolidation than any real rally, just as this key time zone for trend change is approaching. Can markets get there? Potentially. But the risk/reward is turning sub-optimal to initiate new trading longs within most sectors, particularly Tech.“
Well, that didn’t really come to fruition as the S&P 500 continued to rally through November. Can’t win them all folks, but to the point of Newton’s call on the coming trading sessions, let’s hope his crystal ball is found with greater results.


