
If someone had asked you on Tuesday, “Do you think the market will finish at the highs of the trading day”, what would you have said in response? And why are we asking that question now…? Well, let’s look at the obstacles the market faced on Wednesday.
- ADP private sector payrolls
- GDP Q3 2019
- FOMC rate cut and press conference
- Mega-cap earnings from AAPL, SBUX and FB
Sentiment coming into Wednesday’s key economic data releases, FOMC rate cut and mega-cap earnings results was rather concerning and which was recognized with the VIX rising from Monday through Tuesday and up to the FOMC rate announcement. Although the S&P 500 found new highs early in the trading week, investors were also protecting their YTD gains.
This was something Finom Group had anticipated and even forecasted to take place, which we outlined in our weekly Research Report this past Sunday.
“With all this being said about the VIX, we can’t help but to recognize the current low reading may begin to show a divergence with its typical inverse S&P 500 correlation. At these levels, and as seen in the notable trade initiated, protection becomes cheap with the S&P 500 approaching record levels. As such, we can expect that even if the S&P 500 trends higher and breaks out, the VIX may move higher as well.“
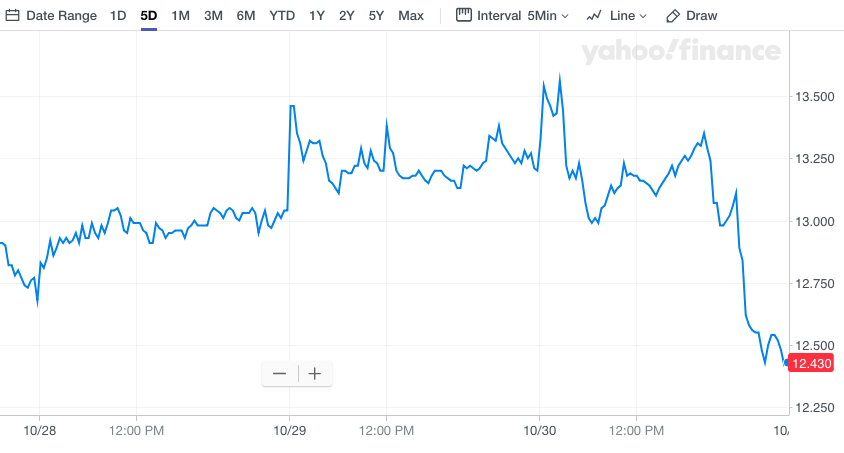
After the economic data came in better than expected, with ADP payroll beating the 100K estimate, coming in at 125K, and Q3 GDP first look coming in at 1.9% vs. the estimate of 1.6% and coupled with a precise Fed statement/rate cut, the VIX collapsed. Protection was quickly sold, as shown in the chart of the VIX above that denotes the past 3 trading days. But was that protection sold too quickly given the headline breaking news Thursday morning and equity futures tumbling in response?
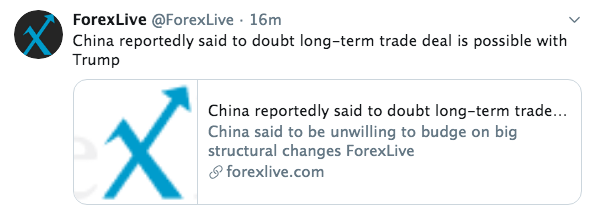
No trading day is complete without some form of a trade headline that causes markets to gyrate and second guess the efficacy and implementation potential of a “phase 1” trade deal of sorts. Wednesday’s trading day found a similar concerning headline as Chile decided to cancel the APEC Summit.
President Donald Trump and Chinese leader Xi Jinping were scheduled to meet at the gathering to discuss a possible “phase one” deal that the two countries are close to finalizing. The cancellation was due to protests, according to Chilean President Sebastian Pinera.

“This has been a very tough decision … but it is based on the wise principle of common sense,” Pinera said in a media address Wednesday.
With futures pointed to a lower open on Wall Street and the VIX rising sharply Wednesday morning, let’s take a look at why investors took a risk-on approach to markets after the Fed’s rate cut and statement. Below is the Fed’s statement and what changed from the last meeting:
Information received since the Federal Open Market Committee met in July
Septemberindicates that the labor market remains strong and that economic activity has been rising at a moderate rate. Job gains have been solid, on average, in recent months, and the unemployment rate has remained low. Although household spending has been rising at a strong pace, business fixed investment and exportshave weakened.remain weak. On a 12-month basis, overall inflation and inflation for items other than food and energy are running below 2 percent. Market-based measures of inflation compensation remain low; survey-based measures of longer-term inflation expectations are little changed. Consistent with its statutory mandate, the Committee seeks to foster maximum employment and price stability. In light of the implications of global developments for the economic outlook as well as muted inflation pressures, the Committee decided to lower the target range for the federal funds rate to 1-1/2 to 1-3/4to 2percent. This action supports the Committee’s view that sustained expansion of economic activity, strong labor market conditions, and inflation near the Committee’s symmetric 2 percent objective are the most likely outcomes, but uncertainties about this outlook remain.As theThe Committeecontemplates the future path of thetarget range for the federal funds rate, itwill continue to monitor the implications of incoming information for the economic outlookand will actas it assesses the appropriateto sustain theexpansion, with a strong labor market and inflation near itssymmetric 2 percent objectivepath of the target range for the federal funds rate.
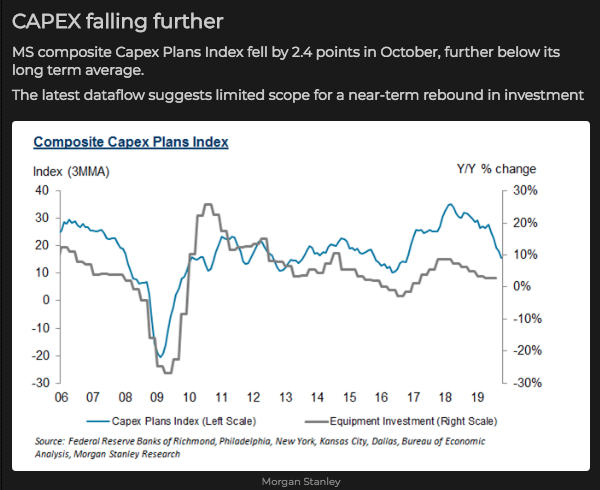
Within the revised Fed statement, from the October 2019 meeting, is the characterization of business investment (CAPEX and other investment/spending). The Fed has recognized that as an adverse reaction to tariffs and the ongoing trade war, business investment has moved from weakening to prolonged weakness. The chart below from Morgan Stanley identifies what is now 2 straight quarters of YoY declines in CAPEX spending plans.
Recall that Goldman Sachs had also forecasted the Fed would remove the language stating it will “act as appropriate to sustain the expansion” that has been in play since June. Turns out, Goldman Sachs nailed this prediction. However, that which was removed was simply altered to reflect a very similar definition and add flexibility for future Fed actions or inactivity. Here’s what Goldman Sachs had to offer after the Fed event on Wednesday:
GS: FOMC Cuts Rates and Drops “Act as Appropriate”
- The FOMC lowered the funds rate target range to 1.5-1.75%, as widely expected. The policy outlook section removed the phrases “as the Committee contemplates the future path of the target range for the federal funds rate” and “will act as appropriate to sustain the expansion,” and more generically stated that the Committee would “continue to monitor” incoming information about the outlook. The phrase “uncertainties about this outlook remain” remained in the statement. Boston Fed President Eric Rosengren and Kansas City Fed President Esther George once again dissented in favor of keeping the funds rate target unchanged.
- The statement’s growth characterization was essentially unchanged. As in the September statement, growth was described as “moderate,” and the unemployment rate as “low.” Household spending was again characterized as “rising at a strong pace” despite its Q3 deceleration. Business fixed investment and exports meanwhile “remain weak.”
- The statement’s inflation discussion was similar to expectations, retaining the “running below 2 percent” characterization of current inflation. It also retained its assessment of inflation expectations, despite net softer readings since the September meeting.
When it was all said and done Wednesday, equity markets remarkably found a trifecta of market headwinds more easily overcome than would otherwise have been assumed heading into the trading day. And now that Apple, Starbucks and Facebook have all reported Q4 and respective Q3 results that beat most analysts’ metric estimates, investors will move on to the next item in what is the ever-lasting “wall of worry”. One such variable market participants might focus on near-term is the seemingly overbought market conditions that can be seen through the Bespoke Investment Group Index ETF tracker.
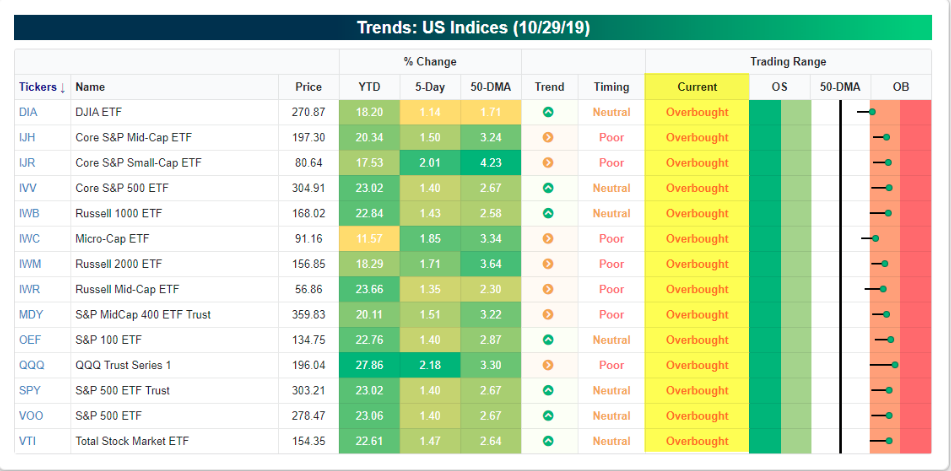
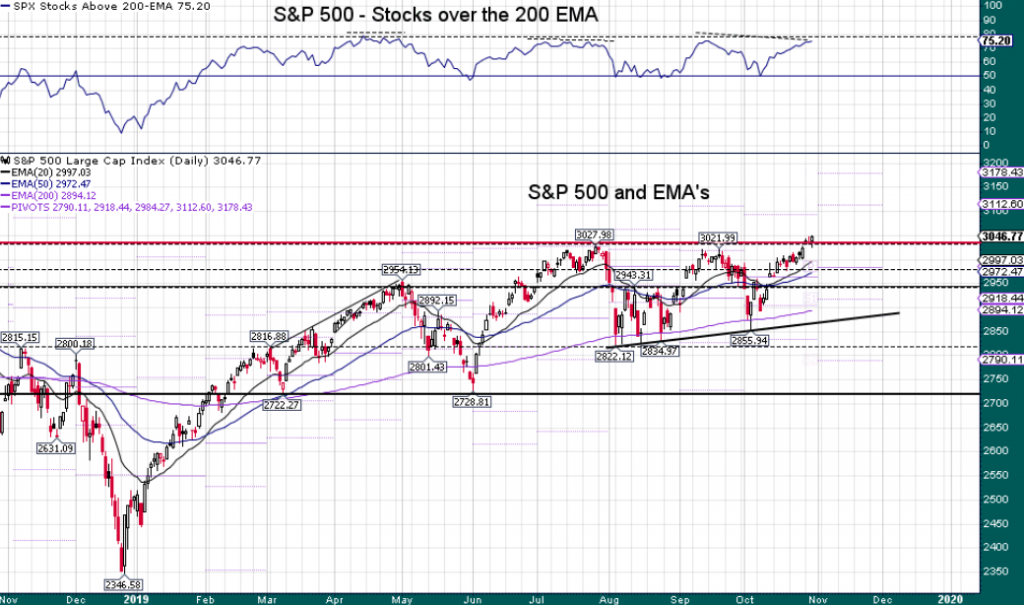
Every single index ETF is in overbought condition territory presently. In addition to this indisputable table, when we look at market breadth indictors, some are also showing that the S&P 500 having achieved a record closing high might also be topping out. Stocks trading above their 200-EMA have reached the 75%-level. This is generally where stocks have topped out in 2019, as shown in the top portion of the chart below. Having said that, trends like records, are made to be broken. We’ll see if that is the case this time, but even if it is, discipline suggests traders look for rebalancing opportunities. Another way to look at this chart, for future actions, is to simply manage one’s “Things To Buy” list.
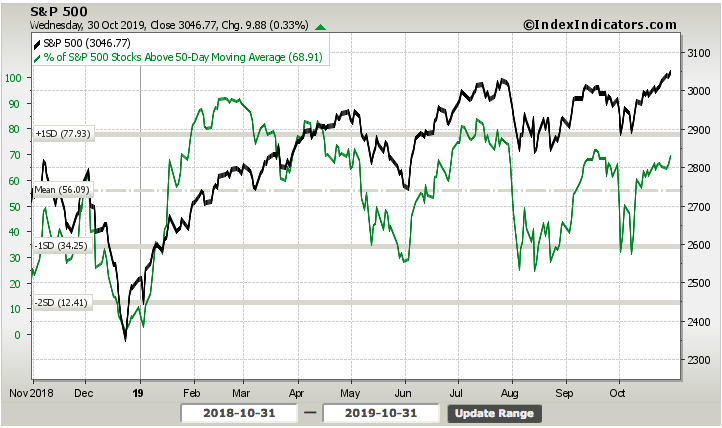
Complementing the breadth indicator above is a look at the % of S&P 500 stocks trading above their 50-DMA. A quick look at this market internal also shows that it has accelerated to nearly 70%, a level that has marked a market reversal in 2019.
Sometimes, in order to elicit a market reversal, the market demands a catalyst. It would appear that with the Dow Futures off some 110 points in the pre-market trade Wednesday, the geopolitical headline has provided the impetus for a market reversal. Nonetheless, Finom Group would suggest investors whip out that shopping list, and refer to it for long-term consideration. And our impetus for this suggestion is the longstanding dual “Puts” that have facilitated record-levels in the S&P 500 during 2019. Least we not forget the Fed and Trump “Put” have been well-tested by the markets and found for great efficacy throughout the year. That wall of worry has been overcome time and time again! Does this mean investors should buy everything in sight, go “all in”? Absolutely not! Discipline, discipline, discipline is/are the key to long-term capital returns. So let us take a look at some of Wednesday’s key economic data releases and prepare for the remaining economic data slated to be released this week.
It’s no secret that the key to the U.S. economy is a strong consumer. With economic growth slowing YoY and even QoQ, growth estimates have come under pressure alongside sentiment for future growth. Nonetheless, the average household continues to benefit from above average wage growth for the expansion cycle, a robust labor market and a strong household balance sheet. The household balance sheet is in the best condition it has been in roughly 50 years.
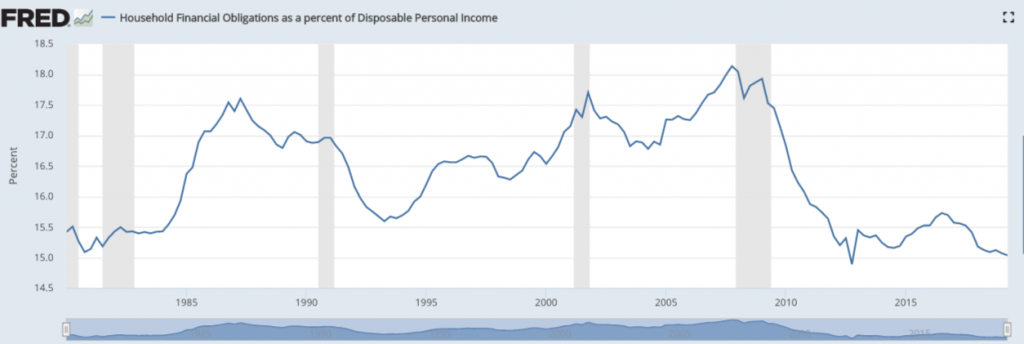
This is not to say that household debt hasn’t reached all-time high levels but rather it suggests that the debt is easily serviceable by the average household and they have grown increasingly conscious of the balance sheet. With that being said, the latest GDP release for the Q3 period shows that the consumer continues to support economic expansion, as consumer spending was the strongest factor boosting GDP above economists’ estimates for the quarter.
Gross domestic product, the official scorecard for the economy, grew at an 1.9% annual pace in the third quarter, the government said Wednesday. That’s down just a tick from 2% growth in the spring.
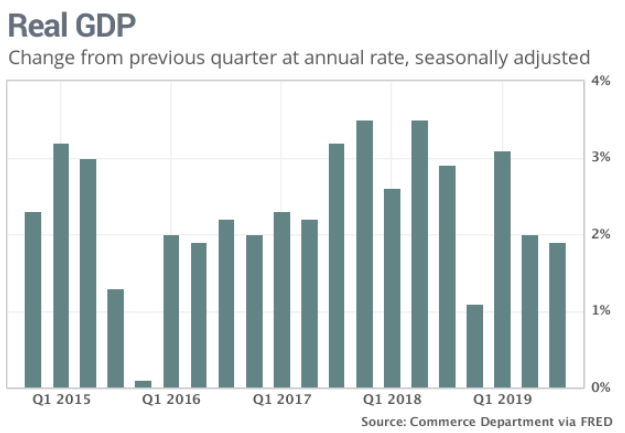
Although consumer spending didn’t match the second quarter’s heady 4.6% increase, outlays still rose a very healthy 2.9 percent. Consumer spending accounts for about 70% of all U.S. economic activity. Americans spent more on new autos, food, health care and housing.
“A not-so spooky GDP report showed that consumer spending remained buoyant offsetting the ongoing business investment slump,” chief U.S. economist Gregory Daco of Oxford Economics wrote to clients. “ However, with the U.S. economy no longer fiscally insulated and businesses feeling the pinch from squeezed profit margins, economic momentum is poised to slow into 2020.”
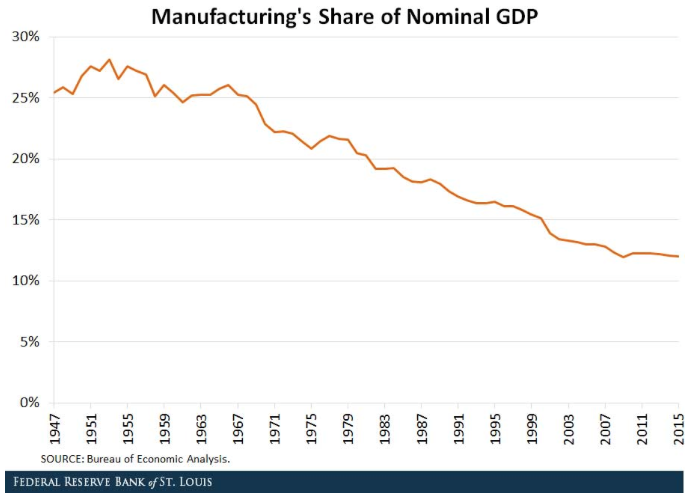
While the U.S. manufacturing sector has dipped into contraction territory, as recognized in the September ISM Manufacturing Index (47.8), manufacturing remains a small part of economic output. It’s relevant, don’t get us wrong. With each passing year, however, it’s relevancy is diminished, as shown in the chart below:
Q3 GDP coming in better than expected was coupled with a mixed result from the latest ADP private employment report on Wednesday. U.S. private employment growth showed slight acceleration in October on the strength of service-sector gains, but goods producers cut jobs for a second straight month.
Employers added 125,000 jobs last month, the ADP National Employment Report showed, slightly topping the median forecast in a Reuters poll for a gain of 120,000 jobs. The increase came as private payrolls growth in September was revised down to a four-month low of 93,000 from an originally reported 135,000 increase. The report typically offers insight into the Bureau of Labor and Statistics Nonfarm Payroll report, which is slated to be released on Friday. Estimates are rather subdued for the Nonfarm Payroll report, showing economists expect only 75,000 new jobs to have been created in the month of October. Bank of America Merrill Lynch has an even more sanguine estimate:
- “We look for Nonfarm payrolls growth of 25k in October, as the GM strike should weigh on employment growth. Our private payrolls tracker is looking for -41k suggesting that there is risk of an outright decline in payrolls.”
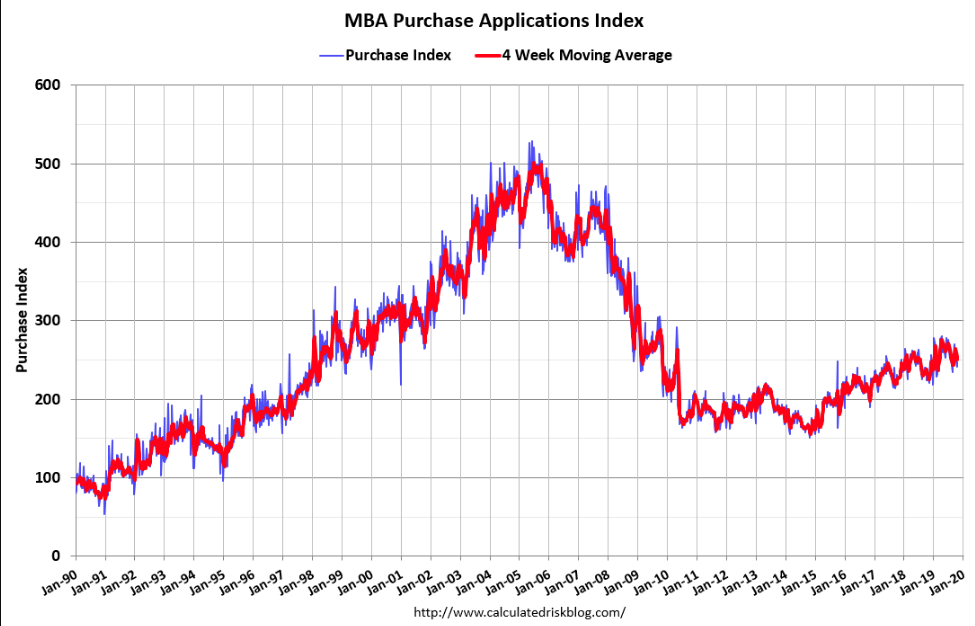
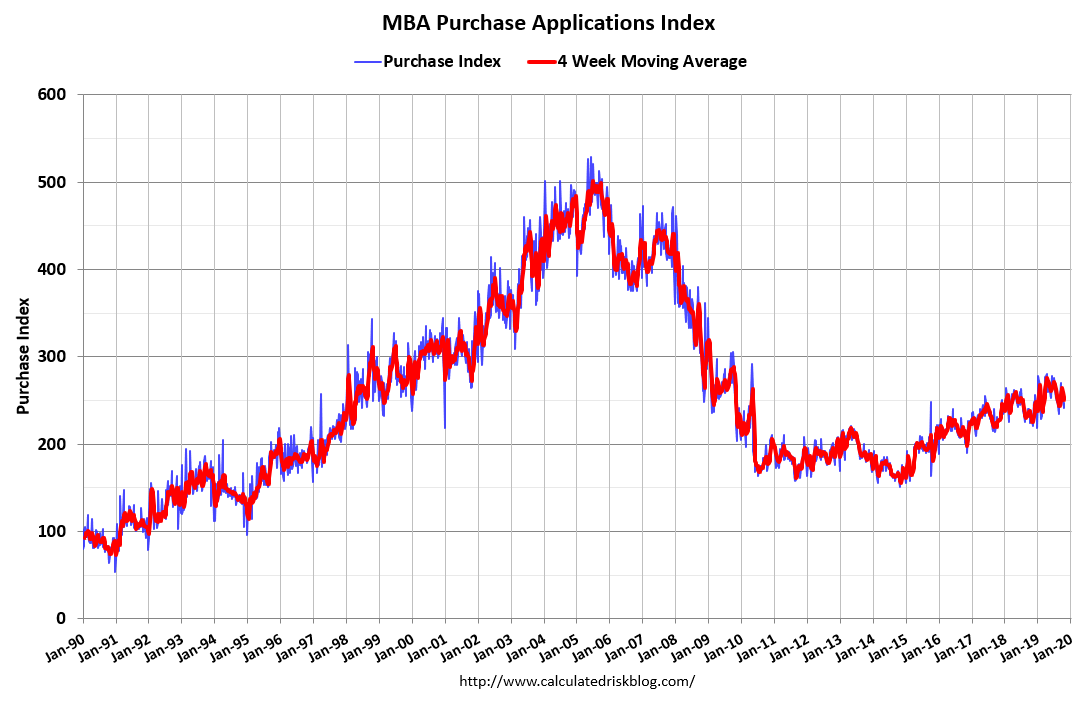
With all the hooplah surrounding the biggest economic data headlines on Wednesday, a lesser headline surrounding mortgage applications went under the radar. Mortgage applications increased 0.6% from one week earlier, according to data from the Mortgage Bankers Association’s (MBA) Weekly Mortgage Applications Survey for the week ending October 25, 2019.
The Refinance Index decreased 1% from the previous week and was 134% higher than the same week one year ago. The seasonally adjusted Purchase Index increased 2% from one week earlier. The unadjusted Purchase Index increased 2% compared with the previous week and was 10% higher than the same week one year ago. Mortgage application data is hovering at cyclical highs.
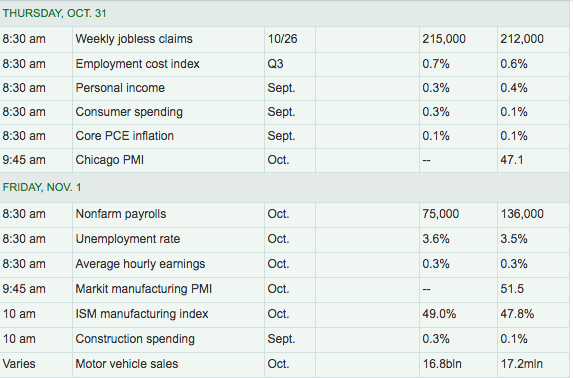
While the hard economic data has come in better than anticipated and will likely revive the Citi Economic Surprise Index once again, their remains highly relevant economic data for the week that is noted in the following table from MarketWatch:
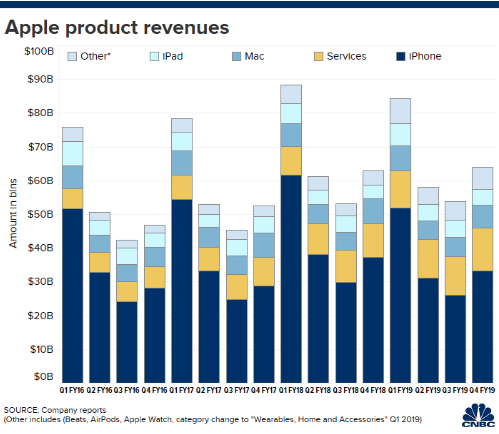
We can outline all the favorable results found in the Facebook and Starbucks earnings, reported after the close on Wednesday, but for the sake of market cap size and greatest market drive we’ll simply offer that both outperformed analysts estimates and revert to Apple’s results. Apple drives the market folks, and is almost always the most concerning and focal point for investors. Fortunately, Apple performed as it usually does, with outperformance and positive guidance. Here’s how the company did compared with Refinitiv consensus estimates:
- Revenue: $64 billion vs. $62.99 billion estimate.
- EPS: $3.03 vs. $2.84 estimate.
- Q1 revenue guidance: $85.5 billion to $89.5 billion vs. $86.92 billion estimate.
- iPhone revenue: $33.36 billion vs. $32.42 billion estimate.
- Services revenue: $12.51 billion vs. $12.15 billion estimate.
AAPL shares were rewarded for beating analysts’ estimates. Probably more important, however, was the forward looking expectations. Investors were watching Apple’s guidance for the all-important holiday quarter, which was in line with analyst estimates. Apple is signaling that it expects growth over last year’s holiday quarter, where it was hit by a major downturn of iPhone sales in China. It also suggests that Apple has a chance to beat the record $88.3 billion in revenue it posted in the quarter ending December 2017.
Apple’s total cash on hand was $205.9 billion, which was down 2.2% from the previous quarter as the company continues its aggressive buyback strategy. Apple said that it spent $18 billion on share buybacks and $3.5 billion in dividends during the quarter. Apple also said it would give people using its branded credit card, Apple Card, no-interest financing on new iPhones.
Coming into the Company’s earnings report, Mark Newton of Newton Advisors expressed worrying signs for the technical trading aspects of AAPL shares. In looking at the relative strength of the stock, he suggested the stock would pull back, as the breakout was concerning. “I don’t like the stock all that much here.”
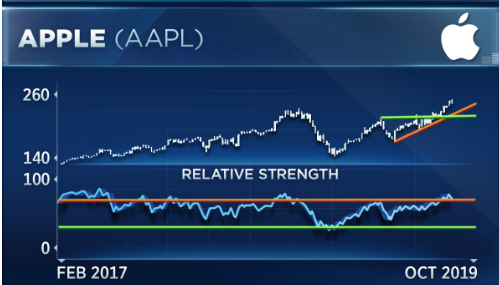
“The stock is a lot higher than we were when we peaked last September, but yet momentum is nowhere near that,” Newton said, adding that Apple’s weekly chart, above, shows “what we call negative momentum divergence, [which] can be a problem in suggesting if a stock likely has gone a bit too far too quickly to the upside.”
Seriously, this is a bias of great concern. Let’s face facts folks, the breakout in and of itself is a net positive, even if it shows the probability of a near-term pullback. What’s most relevant, however is not displayed in any chart, but in Apple’s balance sheet and use of cash on-hand. It’s the buyback program folks. And this is something that goes widely overlooked by most investors and even infamous fund managers like Morgan Creek Capital’s Mark Yusko. You remember this guy right?
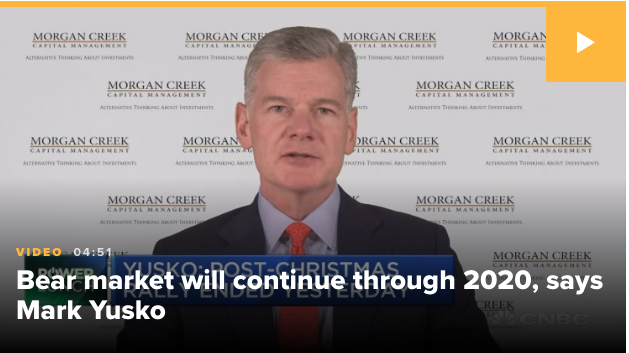
Apparently, Yusko still thinks we’re in a bear market. Where’s the “SMH” emoji when you need one?
“Morgan Creek Capital’s Mark Yusko is sticking by his October call that stocks must drop nearly 50% to reach fair value.
On CNBC Wednesday, the firm’s founder and chief investment officer doubled down on his Oct. 11, 2018 prediction that equity prices could lose half of their value. He likened the current market conditions to the tech bubble of the early 2000s.“
In disbelief of Apple’s recent surge to record high levels, the fund manager who typically underperforms the average annual market return offered this in a tweet:
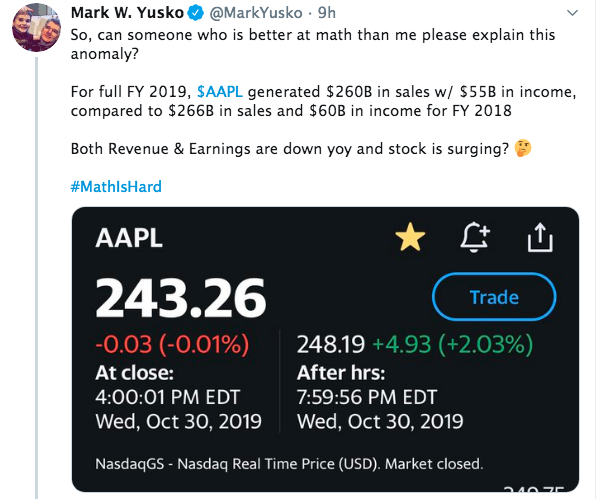
While nothing within the tweet is found for error, sales and income are both lower YoY, but that’s not what drives the share price over time. What drives the share price and broader market over time are earnings, EPS. Those earnings are up YoY. And why are those earnings higher YoY, cost controls and that all-important cash balance that fuels a strong share repurchase program.
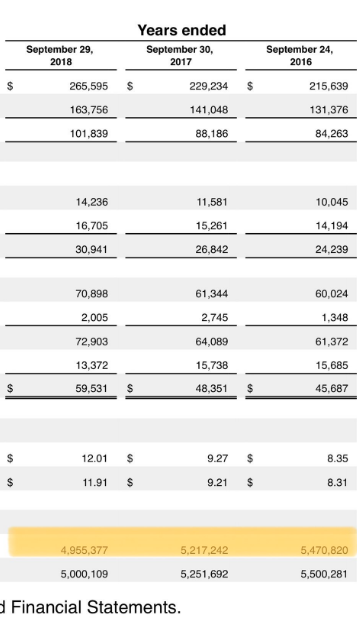
Apple has effectively grown its EPS, in part, due to the removal of shares from its float for the last several years. Based on financial statements and the float count, about 250,000 shares per year from 2016-2018 have been eliminated, not including that which have been repurchased in 2019. And this goes back to our former comment regarding the technical analysis offered by Mark Newton: “What’s most relevant, however is not displayed in any chart, but in Apple’s balance sheet and use of cash on-hand. It’s the buyback program folks.” This doesn’t mean one should go out and buy shares of AAPL today. Having said that, selling shares is mathematically, fundamentally and historically not advisable. The best course of action along all the aforementioned lines of analysis suggest AAPL shares should be rated as Overweight and a consistent “buy the dip” stock.
So in referring to Mark Yusko’s tweet, that’s the math and it would appear that the bear market suggests there are a great many better at math than he. Fund manager of the year? Logic dictates, always!
And yet none of this diverts attention away from what remains a likely turbulent end to the trading week. Thursday’s release of Initial Jobless Claims and Personal Income and Expenditures data will find anxious investors either validated or exonerated of such fears. Geopolitical headlines will be met with analysts scrutiny and hyperbolized in the media. But when it is all said and done… earnings, earnings earnings, which are the key driver of markets over time. With earnings coming in better than expected, Finom Group continues to anticipate positive weekly forecast revisions from the likes of FactSet and Refinitiv. When we look at the J.P. Morgan chart below, we are also forced to recognize why the market is ignoring or rather looking beyond a minor earnings recession, depending on your GAAP vs. NON-GAAP focus.
This is the first quarter of 2019 that even Finom Group anticipates an actual earnings decline on a YoY basis, albeit a slight one at that. However, we continue to buy dips as we believe earnings are finding a trough period for which they will rebound more prominently from Q2 2020 and through the year. Our EPS outlook is correlated to our economic outlook, but remains prone to unforeseen exogenous economic shock. With that being said we were able to take advantage of recent market moves as shown in two of our recently completed trade alerts to Premium Members. And there are more trades to come. Year-to-date, Finom Group has issued and profitably completed 208 of 211 trade alerts in 2019. Terribly decent performance!


Finom Group doesn’t suggest the market won’t or can’t pullback near-term. In fact, the seasonality of the markets suggests a near-term dip is likely, which would be found favorably given overbought conditions. No, it’s not about whether or not the market can or will pullback; it’s about what the average trader or investor might benefit from doing when such a pullback presents itself. To those stubborn bears waiting for the pullback to get back in and who say, “Where’s the marginal buyer for stocks up here”, we give you the mother of all “fuel charts”.
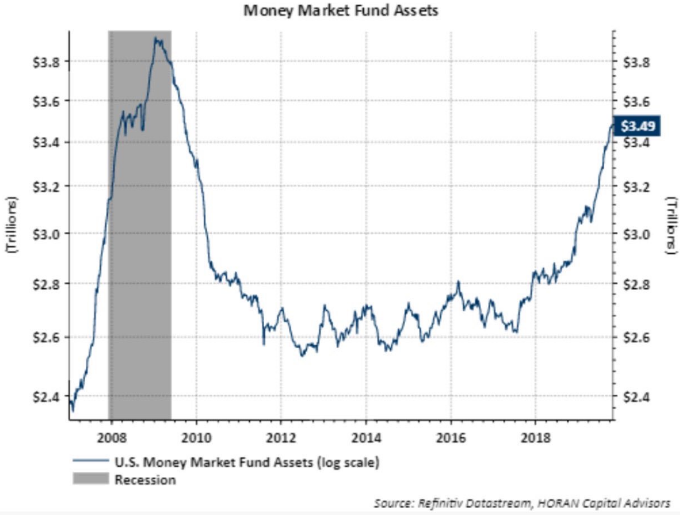
There’s soooooo much money that’s been found wrong-footed in 2019 and as the S&P 500 has surged more than 20 percent. Trade carefully and with a long-term premise folks!


