
While it wasn’t “bombs over Baghdad“, there was certainly an Iranian retaliation against the U.S. and its installments in Iraq Tuesday evening. Iran launched more than a dozen ballistic missiles against multiple bases housing U.S. troops in Iraq, Pentagon officials said on Tuesday.

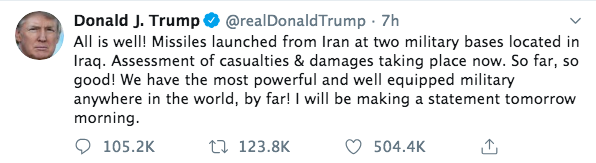
It was reported by CNN that no U.S. service members were hurt in the strikes. The White House decided against a formal address to the nation Tuesday night. President Donald Trump offered the following in a tweet Tuesday night, regarding the attacks.
Equity futures, initially, too a steep dive in the 6:00 p.m. EST hour on the heals of headlines concerning the attacks. Finom Group has been discussing the optimal strategy and/or patience with capital allocations ahead of the previously announced/warned retaliation to come from Iran last week and in recent trading days with finomgroup.com members. Our thoughts on the subject matter dovetailed with our already affirmed opinions that suggested a market pullback was to occur over the next 30-45 days.
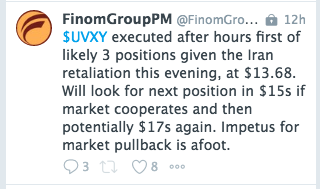
Although equity futures did indeed tumble on Tuesday evening, Finom Group was actively positioning in the after hours market. Chief market strategist Seth Golden offered the following on StockTwits:
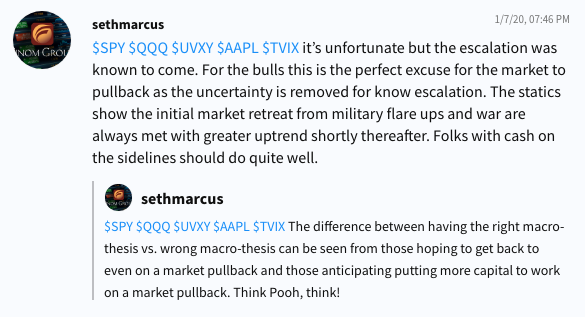
As Seth has studied and recognizes the strength of markets during and through war times, initial reactions to headlines do stoke fear amongst investors, but patience and prudent capital deployment is always rewarded. In Finom Group’s weekly Research Report, we identify how the market trades during war times and Middle East flare ups as follows:
“The table below identifies Times of War dating back to 1926 and how different asset classes performed.“
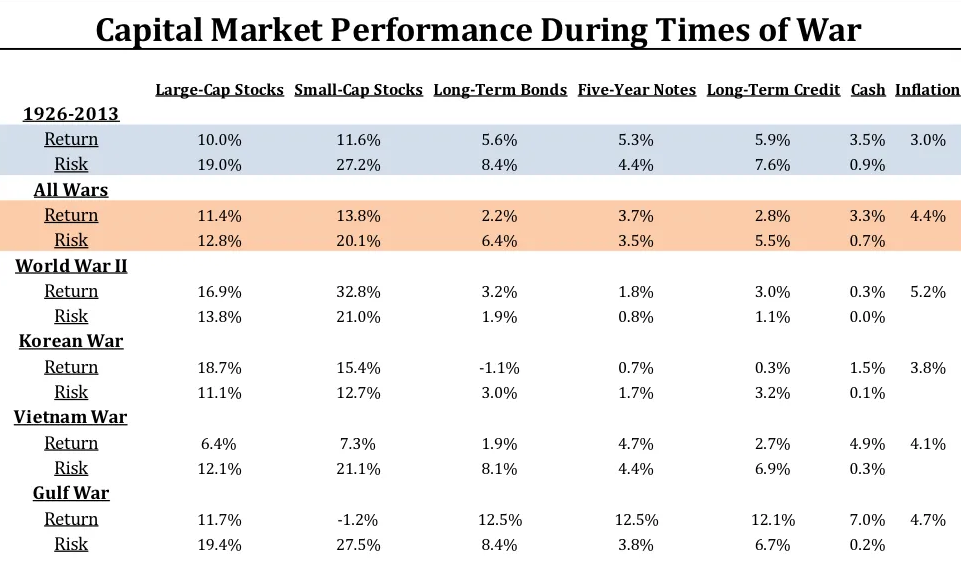
“So the question you might be asking yourself is, “Can we get a little more granular with respect to these different conflicts and what about 9-11?” The answer is yes, yes we can.
For long-time Finom Group members you know that what we like to do is debunk myths. One market myth surrounds an old rule of thumb that suggests investors hate uncertainty more than anything, and there are few situations more uncertain than the threat of war. With this in mind, let’s take a dive into past flare-ups and wars by way of the “way-back” bullet points that follow for each wartime occasion dating back to WWII:
- Hitler invaded Poland on September 1, 1939. When the market opened on September 5, the Dow rose almost 10% higher that day.
- When the attack on the U.S. naval base at Pearl Harbor occurred in early December 1941, stocks opened up the following Monday down 2.9%, but it took just a month to regain those losses.
- When the allied forces invaded France on D-Day on June 6, 1944, the stock market barely noticed. The Dow rose more than 5% over the ensuing month.
- From the start of WWII in 1939 until it ended in late 1945, the Dow was up a total of 50%, more than 7% per year.
We all still together here, seeing the forest for the trees? It’s not as bad as the media might have us believe for the economy or the markets. Let’s continue…
- The Korean War began in the summer of 1950 when North Korea invaded the South. That conflict ended in the summer of 1953. In that time, the Dow was up an annualized 16%, or almost 60% in total.
- U.S. troops were sent to Vietnam in March of 1965. The Dow would finish the remainder of that year up almost 10%. By the time the last of the U.S. troops were pulled out of Vietnam in 1973, the stock market was up a total of almost 43% in that time, or just under 5% per year. And then came the oil crisis in 1974 that coincided with President Nixon’s impeachment hearings.
- The Cuban Missile Crisis had the world on the brink of nuclear war in October of 1962 when the U.S. faced a standoff against Russia. The confrontation lasted 13 days. In that two-week period, the Dow lost just 1.2%. For the remainder of that year, the Dow would gain more than 10%.
- The terrorist attack on U.S. soil on Sept. 11, 2001 saw stocks fall sharply, down almost 15% in less than two weeks following the tragedy. The economy was already in the middle of a recession at that point, and stocks were in a free fall from the bursting of the dot-com bubble. But within a couple of months, the stock market had made back all of the losses that occurred in the aftermath of 9/11.
- The U.S. invaded Iraq in March 2003. Stocks rose 2.3% the following day and finished up the year with a gain of more than 30% from that point on. Although it is important to note these gains were coming off the brutal 2000-2002 bear market.
In addition to the notes and table from our weekly Research Report above, according to @StovallCFRA, looking at the past 20 major geopolitical events since Pearl Harbor, the S&P 500 falls about 5% on average at the onset of conflicts. The good news, however, is that after the lows it recovers in less than two months.
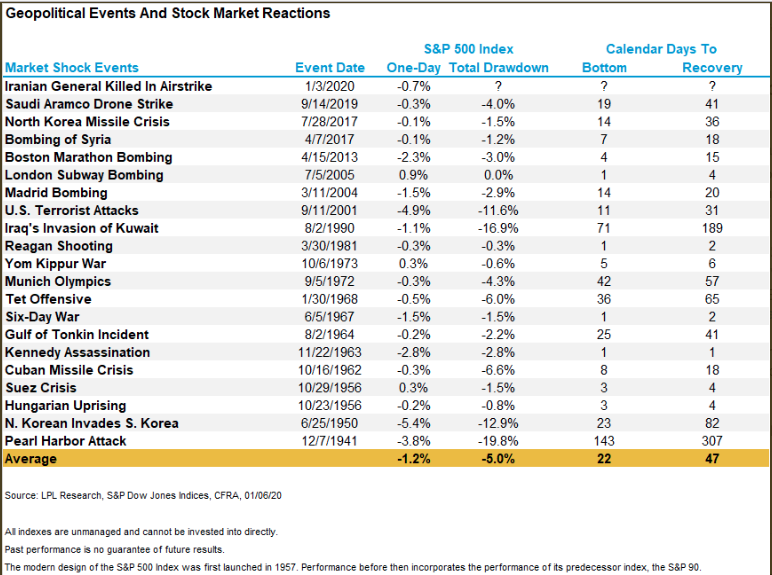
As we can ascertain from the table/study above, most of the largest drawdowns came during the Pearl Harbor Attack, the North Korean war, the Cuban Missile Crisis, Iraq’s invasion of Kuwait and 9-11. From the initial S&P 500 decline, the longest it has taken the benchmark to recover was 307 days when Pearl Harbor was attacked only to be followed by a far less 189 days from the Iraq invasion of Kuwait. From a recency bias standpoint, the 9-11 attacks found the S&P 500 recovering in just 31 days from trough to even.
Tuesday’s market action was anything but inspiring as a great deal of churning took place that didn’t evoke a great deal of volume. It was more sector rotation than outright buying and selling. When it was all said and done on Tuesday, all 3 major averages lost gain. The S&P 500 lost 9 points on the session, almost all that it had gained on Monday. With 2 trading days completed here in the trading week, the benchmark index has risen just two points. Keep in mind that the weekly expected move is $44/points.
Retail stocks were found in favor once again on Tuesday and as analysts’ notes seemed to contradict each other. J.P. Morgan’s Matthew Boss offered the following regarding the retailers he covers for the firm:
“Our work points to a robust Holiday ’19 overall led by continued consumer strength (unemployment at 50 year low / ~4% wage growth) with ~76% of companies across our Department Stores & Specialty Softlines coverage universe tracking to meet or beat current 4Q Street Consensus same-store-sales by our work.”
If you don’t know Boss, he does a ton of fieldwork to find out how retailers are doing. He’s saying that his work shows that a number of store chains could have better-than-expected earnings. Remember, the comps are easier this past holiday shopping season than in 2018. During the 2018 holiday shopping season, President Trump went toe-to-toe with Chuck Schumer and Nancy Pelosi in the White House and live, on-air whereby the President confidently threatened to shutdown the government. This sparked fear amongst consumers which ultimately resulted in a poor December retail holiday period as consumer spending dropped off sharply.
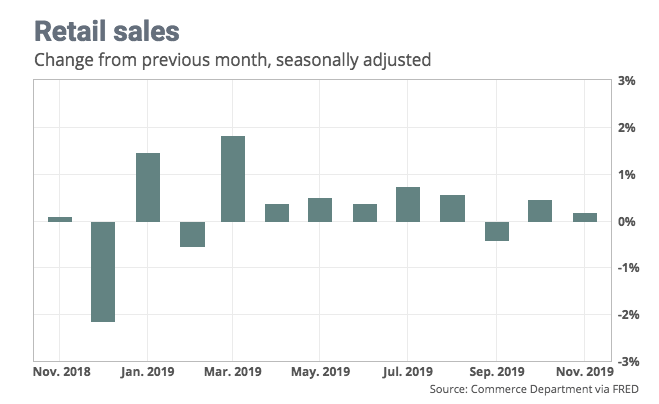
Retail sales sank 1.2% in December 2018, the U.S. Census Bureau offered when it released results in early 2019. It proved the largest drop since September 2009, a few months after the end of the Great Recession. Nonetheless, Finom Group believes that this set up very easy holiday comps for many retailers, which is playing out in Matthew Boss’ retail checks during the holidays this year. Finom Group believes these easy comps, however, will be somewhat buffered by forward-looking guidance once retailers report Q4 results in early 2020.
Boss says that 76% of companies across his universe of department store and specialty softlines should meet or beat expectations, with stores like Macy’s (M) , Kohl’s (KSS) and most important, Nordstrom (JWN) can have a very strong quarter. Boss says Nordstrom, with a 3.6% yield and same store sales projection of 2.3% versus the street at 1.6%, could ignite a short squeeze in the stock.
Boss has a sell on Macy’s, but he still raised his same store sales to minus -1.5% versus minus -2.5%. He says it offers incremental upside, but it yields 8.7% and the balance sheet keeps improving. The improvements, however, are largely due to inventory cuts, monetization of real estate assets and curbed capital expenditures.
The one retailer that was found with mixed analysts’ notes is Kohl’s. Boss says that same-store sales could rise as much as plus 1.5 percent. That means Kohl’s can beat or meet Street earnings estimates which would be somewhat interesting if not for the understanding of the easy comps. Like Macy’s, this retailer also has a high dividend yield at 5.36 percent, which tends to keep the shorts at bay.
Some think Kohl’s is getting a boost from its partnership with Amazon.com Inc., but Jefferies analysts still expect same-store sales and margins to decline due to weakness in key categories like women’s and children’s. Jefferies downgraded Kohl’s shares to hold from buy and cut its price target to $52 from $65.

“We like management’s traffic-driving initiatives, partnering with Amazon and Planet Fitness, but Kohl’s results continue to be muted, regardless of the multiple self-help initiatives in place,” Jefferies analysts led by Randal Konik wrote.
“Active, men’s and digital have been strong, but we believe momentum at competitors such as Target is likely to continue to nip at Kohl’s heels.”
Moreover, Jefferies analysts don’t think strength in the active category can offset weakness in core categories. Women’s and children’s accounts for 41% of Kohl’s sales.
“Until we see an inflection in business trends, competitive pressures ease, and a clear ROI from the Amazon partnership and other investments, Kohl’s shares will have trouble seeing multiple expansion. Positive catalysts have dwindled, visibility is low, and risks are rising.
UBS analysts don’t think Kohl’s can avoid losing market share, writing in a December 2019 note that 17% has gone mostly to off-price retailers like TJX Cos. (TJX), individual brands and its partner Amazon since 2011. However, UBS thinks the company can make up its losses from department stores, which have struggled.
Moreover, analysts are bullish about Kohl’s partnerships and initiatives, its loyalty program, which is getting a refresh, and improvements the retailer is making to its assortment.
“These initiatives mirror how consumer shopping preferences are evolving,” analysts said. “They could help Kohl’s actually take market share over the long term.”
In the spirit of full disclosure, Finom Group does not view the prospects for the retail sector as favorable long-term, especially the department store retailers. While Q4 2019 comps set up low bar beats, the competitive landscape continues to plague department store retailers and will likely continue to do so for years to come. Discretionary household spending remains healthy, but consumer demographic purchasing trends favor online retailing for the foreseeable future. Technology has also stifled pricing initiatives and forced traditional brick and mortar retailers into a position whereby they are constantly found without pricing power and discounting in perpetuity. Through the invent of mobile technology, the consumer can essentially determine the best price of any non-exclusive good and service.
The following chart from J.P. Morgan on pricing trends since smartphones and tablets have attracted mass market consumer adoption is at the heart of the trend in retail pricing in-elasticity.
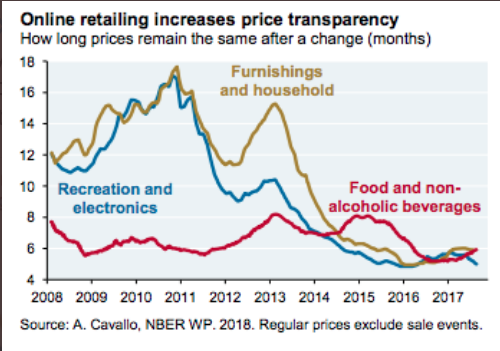
Retailers simply can’t fight this issue other than to participate as an omni-retailer, with both physical store fronts and an online retail presence. The problem for these retailers, even with an omni-channel presence, is that it’s simply too little too late and as Amazon proves to tall a hurdle to overcome. Amazon captures some 50% of U.S. online sales for which the other retailers fight over the left over market share, with lesser gross margins available. The need to have an online presence is a forced margin detraction from the whole of the traditional brick and mortar retailer pie, so to speak. The department and specialty store retailers are darned if they do and darned if they don’t, again, so to speak.
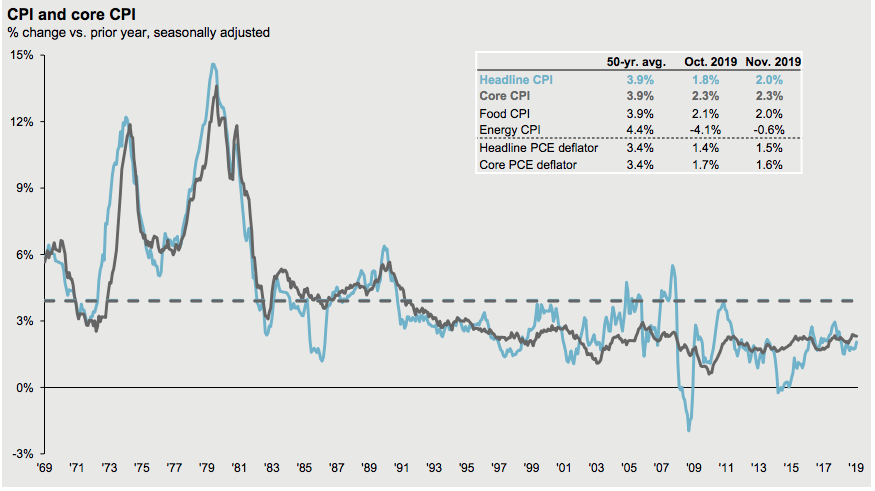
In terms of the pricing pressures noted above, this is also one of the under appreciated reasons the Fed is now understanding and messaging the likelihood of persistently low inflation.
As we look forward to the market’s open of trading on Wednesday, Dow Jones Industrial Average (DOW) futures are only down about 40 points. This compares with Tuesday’s futures plunge of more than 400 points at the low. Quite the turnaround to suggest modestly. The whipsawing action, however, doesn’t find much turbulence or fear in the market Wednesday morning as the VIX is also up less than 3% or .26 in the 6:00 a.m. EST hour. These conditions, however, could change when the President makes his announcement later Wednesday morning, as proposed. Speaking of market volatility…
We can gauge “realized/historic” equity market volatility by tracking how many days the S&P 500 rises or falls by 1% or more in a given trading session and throughout the year.
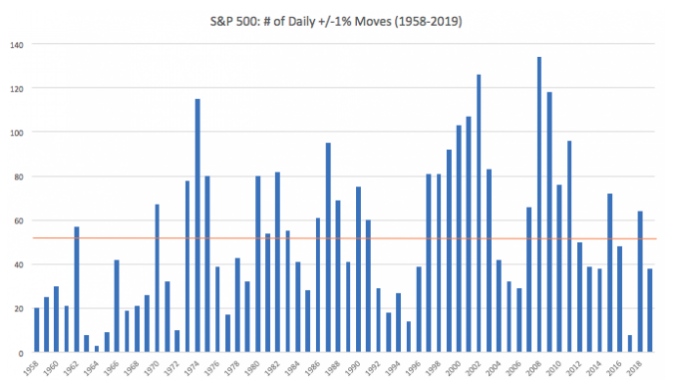
Last year (2019) proved a rather complacent year for markets, although I don’t think many would have characterized it as such given the trade war headlines that coupled with recession fears. Nonetheless, by the measure of +/- 1% daily moves for the S&P 500, it truly was a docile year. The following notes dissect recent, realized market volatility from DataTrek:
- There was a total of just 38 days when the S&P 500 had a daily return of +/- 1% in 2019 compared to the annual average of 53 since 1958 (first full year of data). Under normal market churn, there should be about one 1% day a week.
- The bar chart of annual S&P 1% days (above) shows a clear pattern over the last six decades. Big market swings happen during the start of a bull market, abate and then rise again towards the end of annual sequential gains in US stocks.
- This last cycle has been more mixed than usual. The post-Great Recession low will likely be 8, one percent days in 2017. 2018 was more in keeping with late cycle norms at 64, one percent days versus the annual average of 53, but last year was below average again. We attribute this lower volatility to the Federal Reserve switching its policy back to a more dovish stance early last year.
Given the notes and a look back at 2019 offered, what can we expect going forward. Again, here is what the study, provided by DataTrek has to suggest:
- Quarterly volatility: The quarterly average number of 1% days is 13 in Q1, Q2 and Q3 respectively, and 14 in Q4. Last year, however, volatility ran below pace in Q1 (11 one percent days), Q2 (7 days) and Q4 (6 days). It was slightly above average in Q3 at 14 one percent days due to trade and recessionary concerns.
- Seasonal volatility: Another way we measure volatility is by tracking how many times the VIX has peaked or trough in each month for the year since it was created in 1990.
History says January is either particularly volatile or calm. It’s the one month that has a high level of extremes in both directions. As for Q1 as a whole, the VIX has peaked twice in February (2016 and 2018) and has never bottomed during that month, and has peaked once and bottomed twice in March. Additionally, since 2000, the S&P 500 has declined 10 times in 20 years in January. The recent weakness can be seen in the below January seasonal pattern chart.
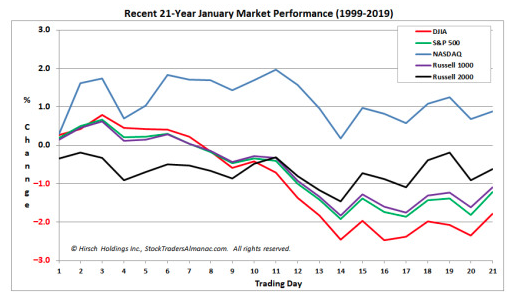
Over the last 21 years, Only the NASDAQ (NDX) has posted a full-month average gain. DJIA, S&P 500 and Russell 1000 have started January positive, only to surrender early-month gains by the eighth trading day. Greatest weakness has appeared just after mid-month, the eleventh trading day. Mild average losses on or around the eleventh trading day quickly swell to over 2% for DJIA and nearly as much for S&P 500 and Russell 1000.
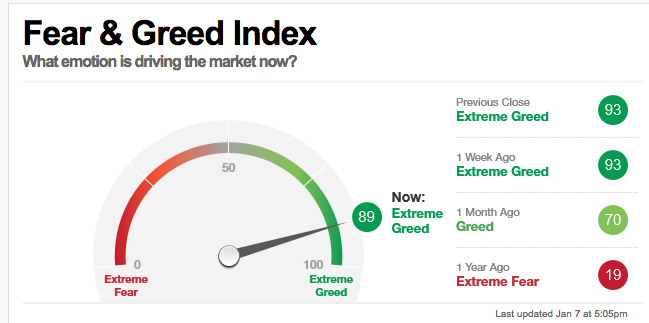
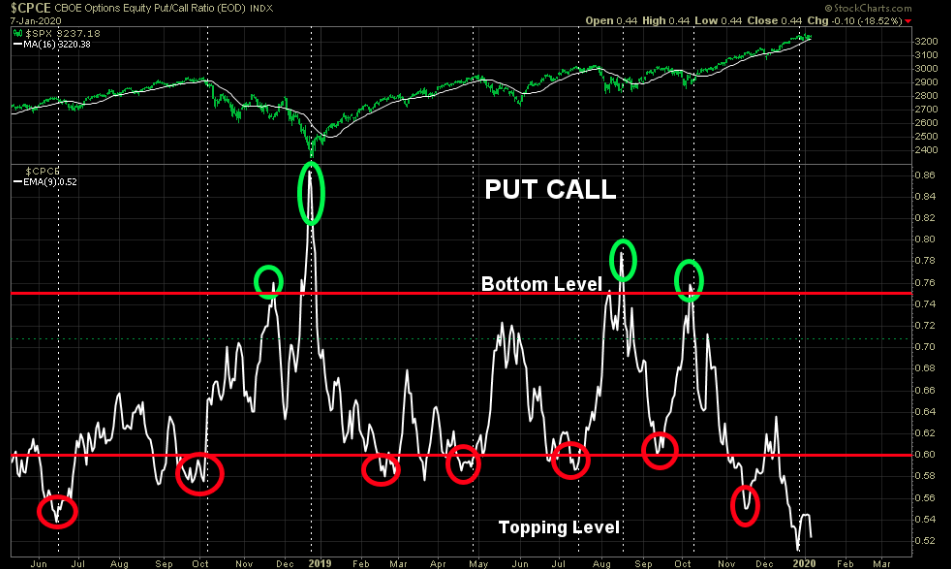
With recent bouts of volatility understood for the latest U.S./Iran conflict, we likely going to see a real test of the President’s resolve soon enough. Finom Group remains of the opinion that markets are overbought and found with extreme sentiment when one reviews the put:call ratio and CNN Fear & Greed Index.
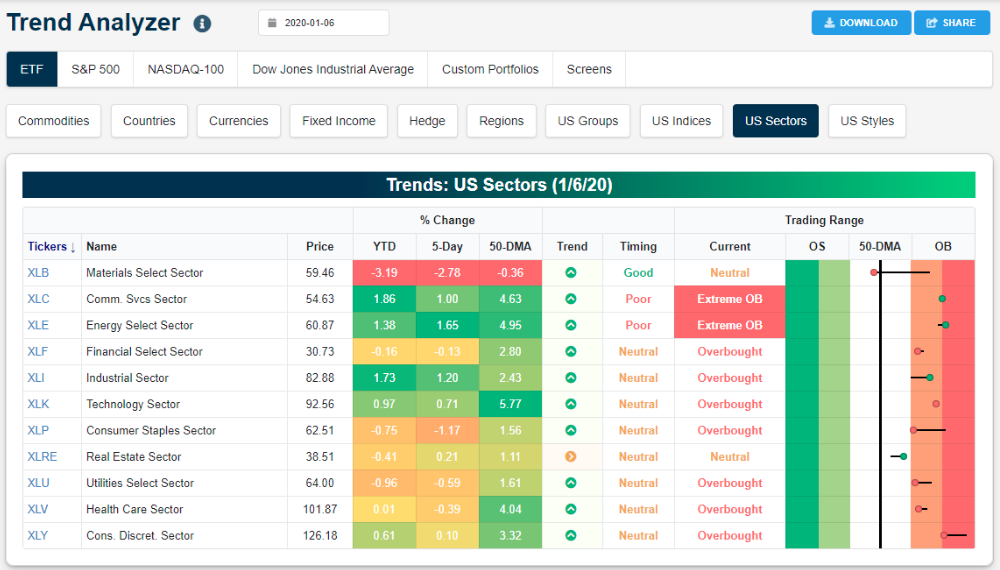
In addition to these two indicators of sentiment, we can see that most every S&P 500 sector ETF is currently within their trading ranges and overbought. Nine of 11 sector ETFs remain in overbought territory. Materials (XLB) has broken below its 50-DMA to begin the New Year. (See Bespoke Investment Group’s Trend Analyzer for sector ETFs below)
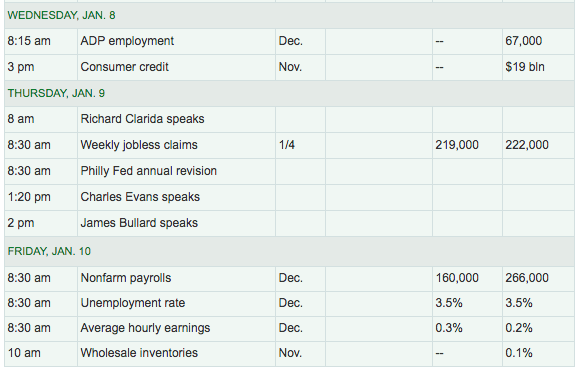
As we wrap up this morning’s daily market dispatch article, some key economic reports have already been delivered this week, most of which have met expectations and/or slightly beat economists’ expectations. On Wednesday, investors will await a bit of a preview to the Friday release of the Nonfarm Payroll report via today’s ADP private sector payroll report. Accompanying today’s ADP report, which will be released at 8:15 a.m. EST will be consumer credit report, a lesser followed report. On Thursday, jobless claims will be the focus as initial jobless claims have declined for 3 straight weeks, but remain above the recent 4-week moving average range.
Looking back on this week’s already released economic data points and as it proves in keeping with the notes on the state of holiday retail sales, the ISM non-manufacturing index came in better than expected on Tuesday. The enormous service side of the U.S. economy sped up at the end of 2019, coinciding with solid holiday sales and reduced trade tensions with China.
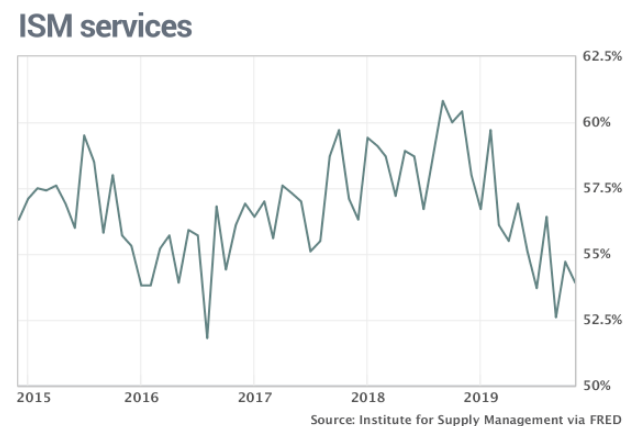
The Institute for Supply Management’s survey of service-oriented companies such as banks retailers and restaurants rose to a four-month high of 55% in December, from 53.9% in the prior month.
New orders grew more slowly, however, as did employment. Both indexes were still positive, though.
“The respondents are positive about the potential resolution on tariffs,” said Anthony Nieves, chairman of the services survey.
There remains a contraction in the manufacturing sector of the economy, but that is not seeping into the larger, services sector of the economy, as factually disseminated. The divergence remains large between the two sectors.
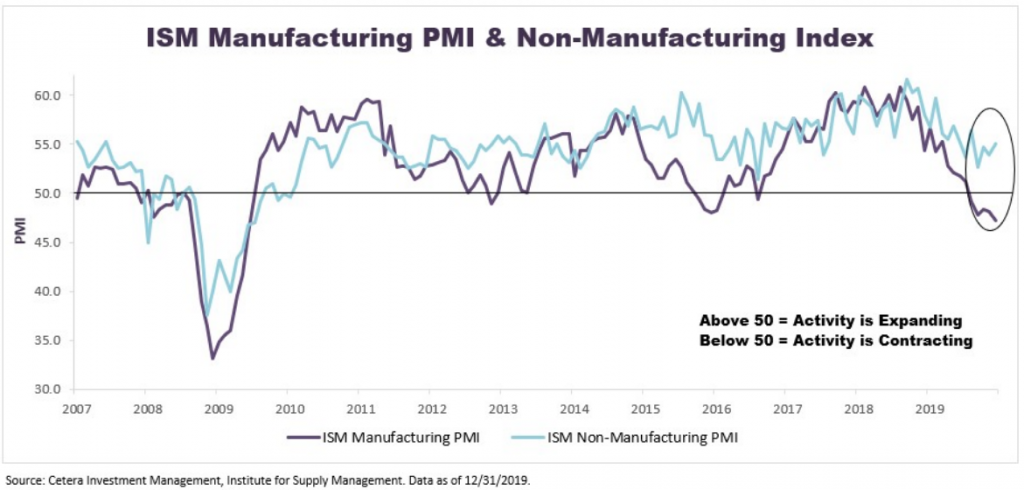
We urge readers to consider that for all the angst over the manufacturing recession, it simply doesn’t lend itself as a recessionary signal. Here is what John Lynch of LPL Financial had to offer with regards to the contraction in the manufacturing sector more recently:
“We’re still constructive on economic fundamentals, even amid manufacturing’s malaise. Manufacturing has historically been a bellwether for the economic outlook, but its role in output has shrunk. Manufacturing accounts for about 11% of gross domestic product, according to Bureau of Economic Analysis data, so it’s unlikely the sector alone will drag the rest of the economy down. ISM’s PMI has dropped below 50 three other times this cycle without a recession materializing, and other key segments of the economy still look solid.“
I think we’re set up nicely for the opening of trading on Wall Street. And by the way, if you don’t think Finom Group’s chief market strategist Seth Golden wasn’t trading the after hours volatility, see the trade alert issued to Finom Group Premium members below:
Trade safely and we’ll see what Wednesday’s market activity has in store for us all!


