
Wall Street bulls were found jubilant yesterday as the markets soared on the heels of what may prove to be a reprieve from trade war rhetoric for weeks and months to come. President Trump’s treasury secretary said Sunday the U.S. will not impose $150 billion in tariffs on China while the two countries negotiate a deal to reduce America’s trade deficit with its economic rival.
“We’re putting the trade war on hold,” Treasury Secretary Steven Mnuchin said on Fox News Sunday. “We have agreed to put the tariffs on hold while we try to execute” an agreement under which China would increase its purchases of U.S. goods.
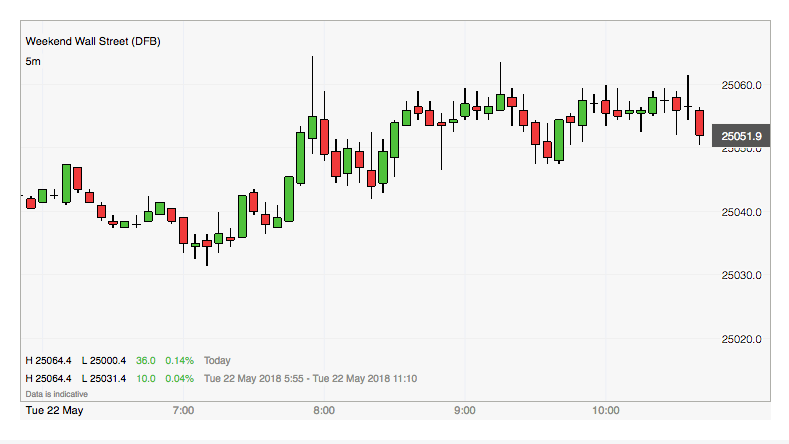
The Sunday afternoon headline sent betting for a positive Monday market open sharply higher. It’s never too early to see which way market sentiment is tilting, even over the weekend through this fun app .
With investors breathing a sigh of relief from Treasury Secretary’s announcement on U.S./China trade relations, equities found favor. The Dow Jones Industrial Average rose 298.20 points, or 1.2%, to 25,013.29, marking its highest close since March 12. The S&P 500 rose 20.04 points to 2,733.01, a gain of 0.7 percent. The benchmark index also recorded its best finish since mid March. The Nasdaq Composite Index rose 39.70 points, or 0.5%, to 7,394.04. As equities found favor in yesterday’s trade, the appetite for Gold was once again found under pressure while the USD gave up much of its earlier gains. The 10-yr Treasury yield was slightly lower ahead of Wednesday release of Fed minutes.
Thus far, yesterday’s equity sentiment has carried over into Tuesday’s pre-market trading session. 2018 has been an interesting year for investors as strong corporate earnings results have given way to a greater period of market consolidation than most would expect and appreciate. But of course, nothing on Wall Street occurs in a vacuum. Investors are forced, more so than in the last decade, to also consider rising rates and yields when weighing risk premium and bond/equity exposure. As such, the benchmark S&P 500 has undergone and likely will continue to undergo some degree of multiple compression.
At present, while Finom Group does believe that a net inflow for equities has been increasing, we also understand that a good portion of the recent market rally has come from shorts covering positions. Q1 2018 was found with a significant increase in short exposure according to Goldman Sachs.

Hedge fund net short positions have increased in most sector ETFs, while Goldman’s Very Important Short basket, containing S&P 500 stocks outside of the VIP list with the largest notional value of short interest, has underperformed the S&P 500 by 180 bp. YTD. But at the onset of Q2 and through much of the corporate reporting season, short interest has been squeezed. The energy sector was found to have the largest YOY short increase in Q1 2018 and has subsequently been the best-performing equity sector thus far in Q2 2018 to date.
In quite the shift in market sentiment and movement over the last 2-3 weeks, there has been a good deal of favorable insights for traders and investors to latch onto. The consolidation period, while only lasting a couple of months, seems like forever with hindsight. But Sameer Samana of the Wells Fargo Investment Institute likens the market’s action to an individual with a broken leg.
“This phase typically can’t be hurried; it can take anywhere from months to years as the leg (or in this case, the market) heals,” wrote Sameer Samana, a global equity and technical strategist at the firm. “In this phase, it is important not to overreact to every market move higher and lower, and it is more valuable to confirm that buyers continue to engage at important support levels.”
In discussing the market consolidation that investors have witnessed in 2018, Samana offered that while the S&P 500 dipped below its 200-DMA several times, it only closed below it once.
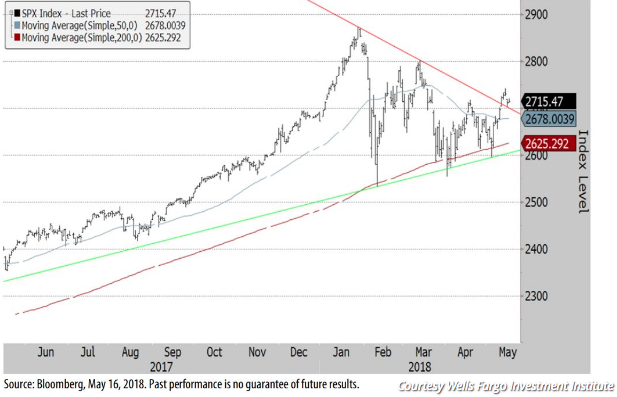
In his opinion, this denotes strong support for equities at the key level. Moreover, when the consolidation period ends, Samana states that it is typical for equities to recapture the former trend of the markets, which has been positive. With the resumption of markets moving higher post the consolidation period, now, the main question shifts toward how long the markets can continue to march higher.
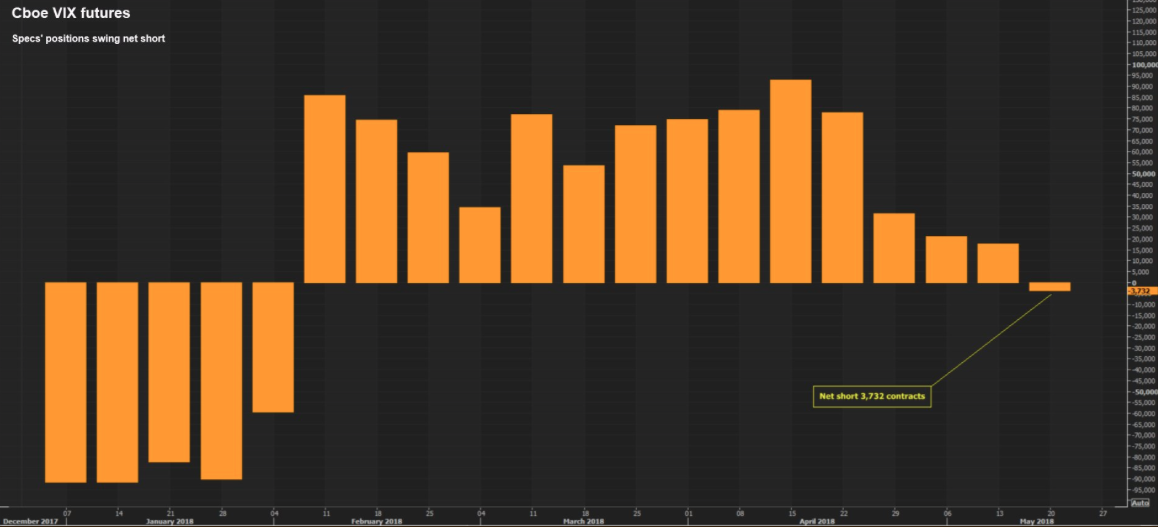
Alongside improving sentiment for equities in recent weeks has been a return of market complacency as measured by the VIX. The fear gauge has been on a steady decline over the last 5-6 weeks and currently sits at just under 13. In fact, the non-commercial net-position in VIX futures has moved back to being short for the first time since the volatility spike in February. See chart below:
Moreover, VIX futures term structure has seen its largest contango percentage since January as of late. More importantly, the term structure itself across the spectrum of monthly futures contracts has elevated when compared to 2017. In 2017, one could easily find term structure depressed with back month futures contracts in the 12s and 13s. The reality is that the more depressed the curve, the greater the risk to volatility sellers when juxtaposed to the historical median reading of the VIX and given the precedence for the VIX to mean revert. Of course this did not prove to be the case in 2017, an anomaly as it may be characterized. Now, with term structure elevated toward a more normalized reflection of historical volatility levels, back month contracts are in the 17s, closer to the historic median VIX reading of 19-20.
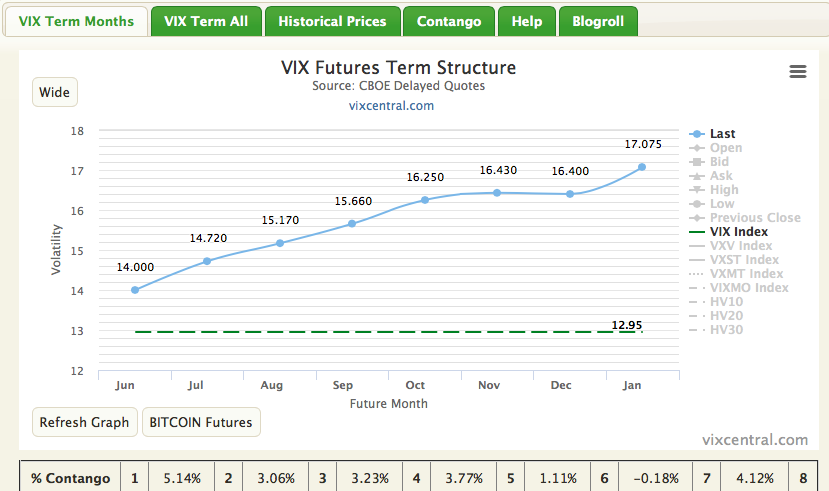
Although VIX Futures contracts in the 17s implies higher volatility in the future, it gives shelter to volatility sellers along the curve, who might otherwise fear a more violent move in the VIX from a more depressed term structure. It has obviously not been favorable to be long VIX futures since the Feb 5 volatility event. In general, it is not favorable to be long the VIX complex as it requires substantial timing and/or luck.
We’re not out of the woods yet, as they say! Despite recent positive market sentiment, investors will still contend with rates, yields, Fed tightening, reflation in various forms, Presidential tweets and mid-term elections to come. And these are just some of the knowns. The unknowns can be a much longer list of variables yet to be discovered. Nonetheless, the market is responding to what historically drives markets, earnings.
At Finom Group, we continue to trade what the market offers. Last Friday, we entered a short VXX position at $34.96. With the markets soaring and VIX futures falling on Monday, shares of VXX dropped significantly. As shown in the screen shot taken from Finom Group’s subscriber-Twitter feed below, this position was covered for a healthy profit at $34.05 a share.

In addition to our successful trade in shares of VXX, we closed out an intra-quarter trade (one of many) on shares of Target Corp. (TGT). In a prior research report, which analyzed the retailer’s Q4 2017 results and FY18 guidance, Finom Group’s Chief Market Strategist Seth Golden offered the following to subscribers back in February:
“Valuation/Rating/Target Price Objective
Finom Group rates shares of TGT as a Buy with a 2018 price target of $77 a share. We believe that the midpoint of Target’s stated EPS guidance is achievable. At roughly $5.30 in EPS we utilize a historic PE on the stock of 14.5 to come to our price target. We do not anticipate multiple expansion for the retail sector at present. In 2018, the current rate of retail sales has shown growth of 3.8% YOY although the MoM trend has shown signs of slowing retail sales. Department store sales have remained strong since the December 2017 period and apparel sales have had broader strength. The consumer should get a boost in 2018 from tax reform legislature that is accompanied by somewhat higher wage growth on a YOY basis. All of this should come together more favorably for Target shareholders in 2018.”
After selling-off on the heels of the retailer’s guidance, shares have returned to their former 90-day trading price with many analysts having higher price targets. Finom Group will reevaluate its price target and issue a new 12-month price target post Target’s Q1 2018 results that are due out tomorrow morning. **Seth Golden maintains ownership in shares of TGT, acquired in 2017 at roughly $53 a share and within the Golden Capital Portfolio.**


