
On the surface, Tuesday’s bounce-back, market rally looks promising and proposed a respite from the extreme selling pressure on Monday. Underneath and adjacent the equity market rally, however, caution is being expressed and demands of it investor/trader attention.
Investors took to safety on Monday as China allowed the yuan to slump to its lowest level in a decade after President Donald Trump’s threat last Thursday to impose 10% tariffs against an additional $300 billion of imported Chinese goods, effective Sept. 1. On Tuesday, U.S. stocks finally rallied after six days of declines. The Dow Jones Industrial Average (DJIA) rose 311.78 points, or 1.2%, to end at 26,029.52, while the S&P 500 (SPX) index climbed 37.03 points, or 1.3%, to close at 2.881.77.
China’s move overnight to restrain the fall in its currency came despite the decision late Monday by the U.S. Treasury Department to label China a currency manipulator for the first time since 1994, opening the door to new sanctions and ratcheting up already high trade tensions into a possible currency war also.
“The market overreacted Monday to concerns that the trade war would turn into a currency war as well,” said Ed Yardeni, president of Yardeni Research “The Chinese have made it clear they don’t want to see a significant devaluation of their currency, which could trigger massive outflows and would be bad for the Chinese economy. So when the currency stabilized, investors jumped in.”
Even as equities rallied on Tuesday, by and large, so did treasuries and with yields continuing to remain flat to lower. To the extent that the market had been suggesting the “alligator jaws” would close near term (S&P 500:TNX), it has only worsened.
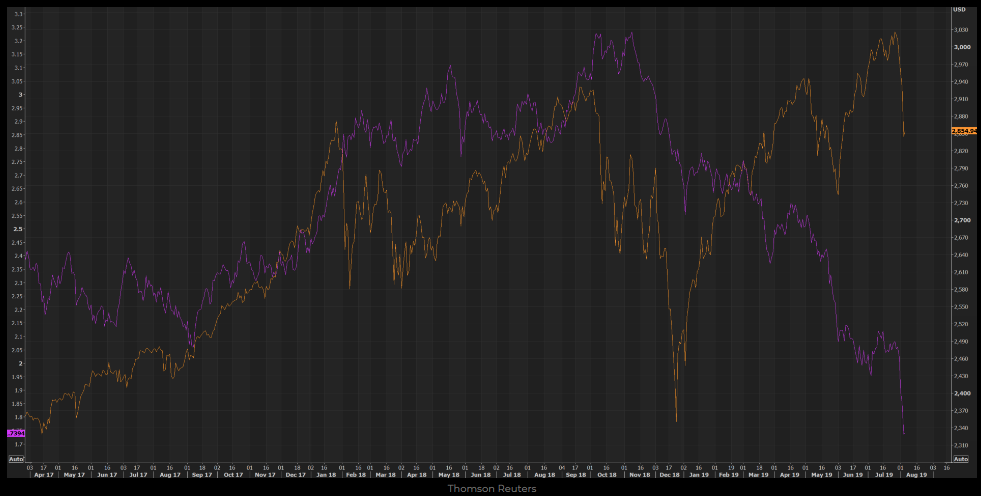
When equities have fallen of late, so have bond yields, thus the chart depicted above has found the typical correlation in SPX:TNX with continued divergence. What’s more concerning is the bond yield curve that continues to remain inverted at the front end (3-month to 10 year) and flatten at the long end (2-year to 10-year).
It was only Tuesday that the 2-year to 10-year Treasury spread was roughly 16 bps. For investors waking up on Wednesday to flat equity futures, they are also awakening to an even flatter yield curve of just 11 bps spread.
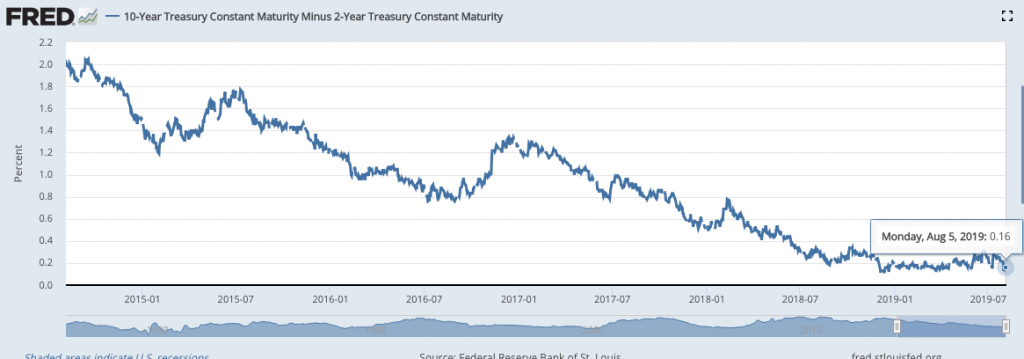
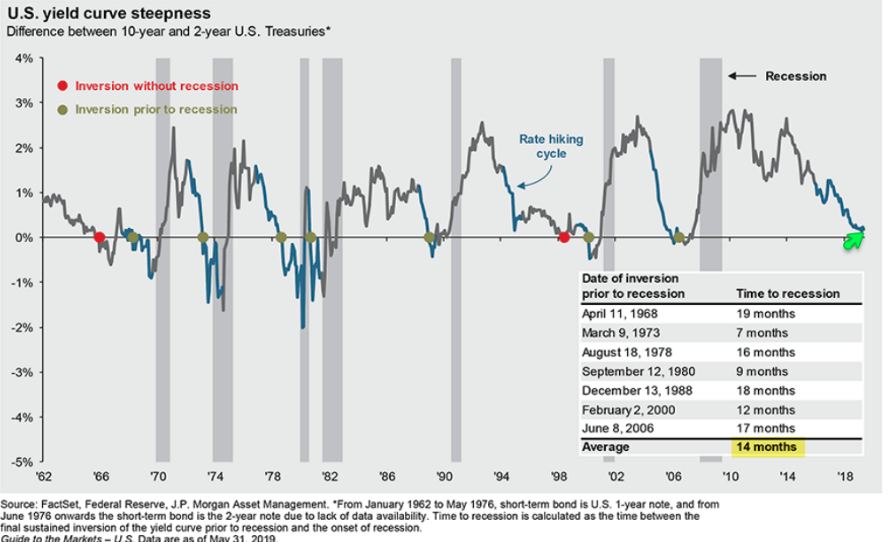
Finom Group denoted, in its most recent Research Report, that the yield curve had not yet inverted (2s/10s). With Wednesday’s continued rally in bonds, forcing yields lower, the long end of the yield curve is nearing its flattest point of the expansion cycle (Dec. ’18) once again and on the verge of inverting. Historically, once the long end of the yield curve does invert, it heralds a recession. As shown in the J.P. Morgan Chase (JPM) chart below, the average duration between the yield curve inversion and a recession is 14 months. The longest period of time between inversion and a recession is 19 months and the shortest period of time between inversion and a recession was 7 months in 1973.
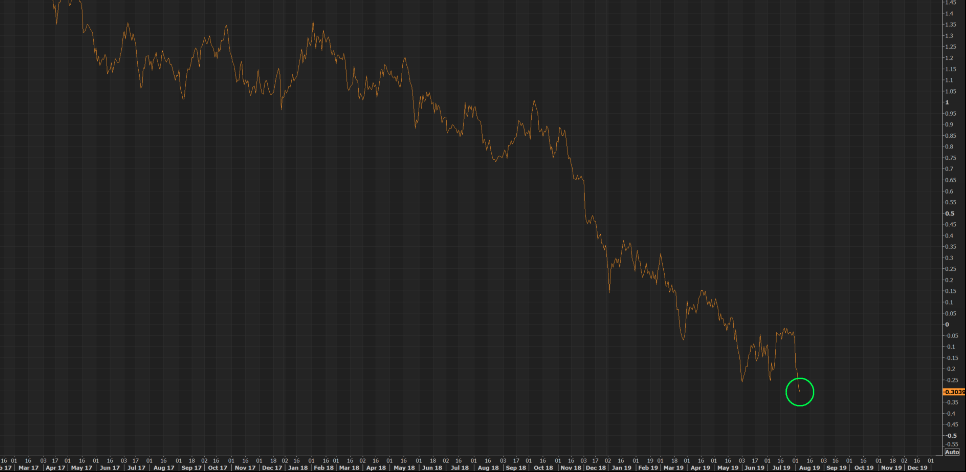
While the markets are playing a game of “look over here, look over here”, investors would be wise to keep their head on a swivel presently and with so much economic uncertainty. And this as the 3-month/10-year yield curve remains inverted with what seems like a global rate race to the bottom. (Chart of 3-month/10-year yields)
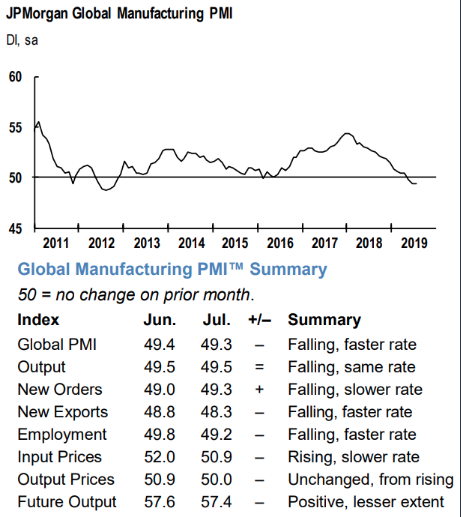
As J.P. Morgan points out in a chart of the yield curve and Global PMIs, investors are fleeing to treasuries as global manufacturing has slowed. Some areas of the world have shown manufacturing in contraction territory over the last few months. What’s important to rationalize in the wake of a global manufacturing contraction is that the United States, unlike China and other industrialized nations, is more of an import economy as opposed to an export economy. The U.S. is more service-oriented than it is a manufacturing based economy. It’s one of the major reasons for which the U.S. economy has remained the bright spot in the global economy. Nonetheless, concerns of contagion remain with investors as trade feuds have carried on for better than a year now and exact a toll on the global economy.
In speaking of the 3-month/10-year Treasury yield inversion that has persisted for months now, this part of the yield curve is now at its most inverted point since April of 2007 at -.36 percent (Wednesday morning).
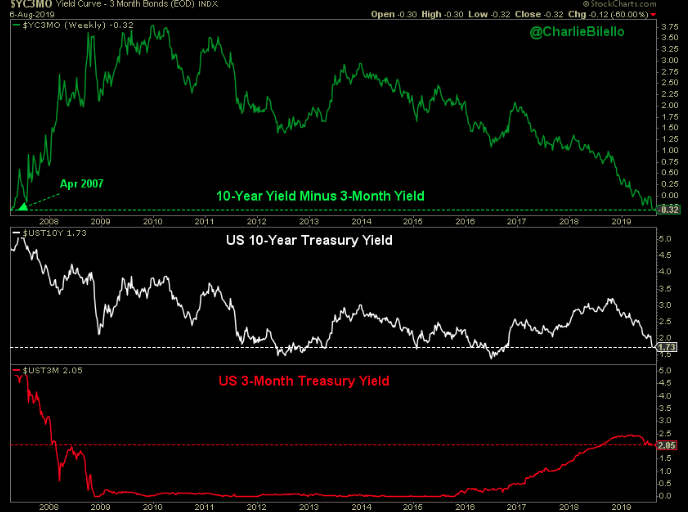
U.S. 10-Year minus 3-Month Treasury Yield:
- Aug ’09: 3.62%
- Aug ’10: 2.71%
- Aug ’11: 2.57%
- Aug ’12: 1.49%
- Aug ’13: 2.63%
- Aug ’14: 2.46%
- Aug ’15: 2.19%
- Aug ’16: 1.31%
- Aug ’17: 1.24%
- Aug ’18: 0.89%
And how does the stock market tend to perform across varied yield curve performance deciles:
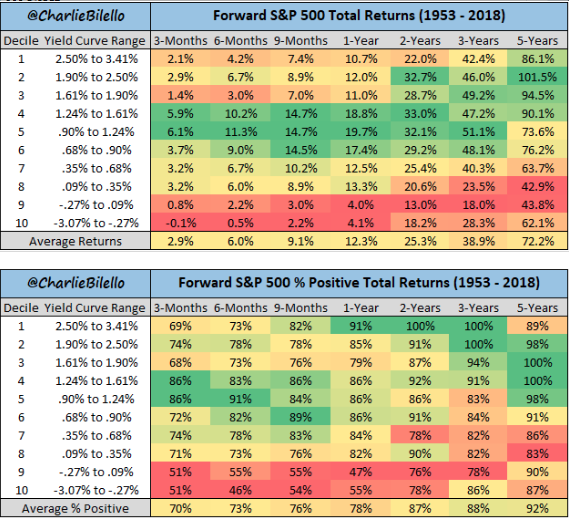
Despite the ominous tone and apparent concern over market positioning, combined with a recent 6% pullback in the S&P 500, forward returns with an inverted 3-month/10-year yield curve have been positive in the past. This lends itself to the occurrences for which the Fed embarks on easing cycles of course.
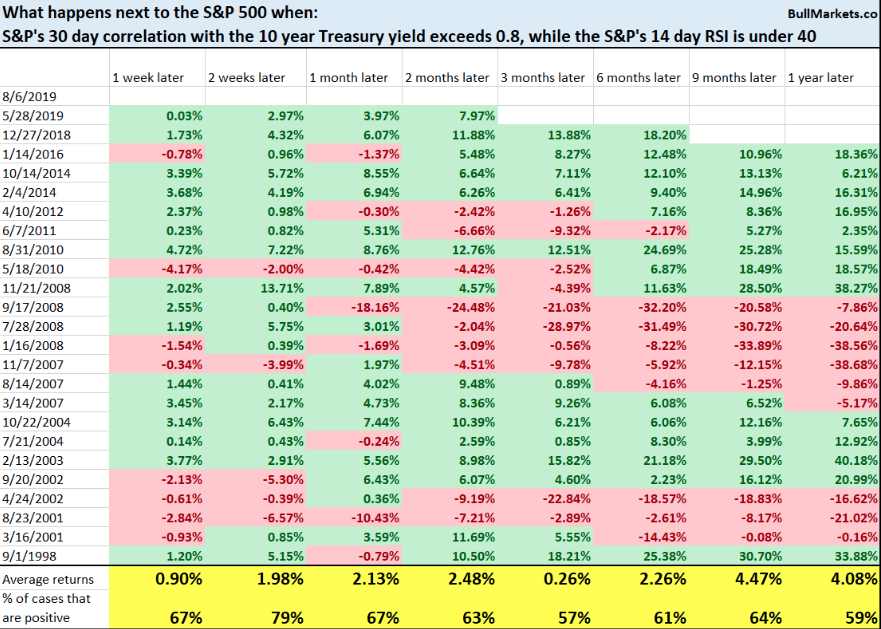
The stock market and Treasury bond yields have a strong positive correlation. Yields are falling when stocks move lower, as investors bid up safe assets, and yields go up when stocks rally. Correlation between stocks and bonds, however, is reaching negative extremes. Since yields and bond prices move inversely, stocks & bond prices have a strong negative correlation right now. Historically, this has typically corresponded to a ‘risk-off’ stance which has been a good contrarian indicator, according to Babak. The S&P 500/TLT ratio is presently above .80 while the S&P 500’s 14-day RSI is under 40.
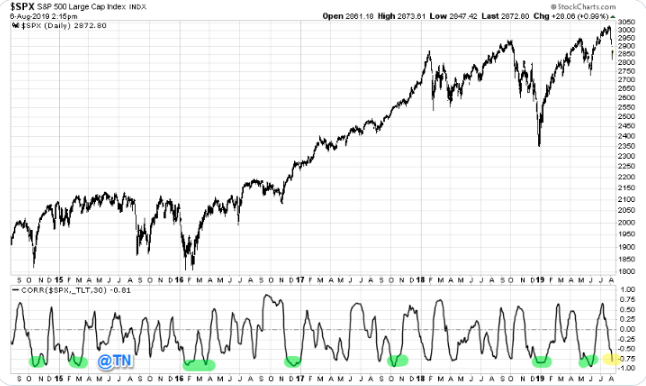
According to Bullmarkets.co, here’s what happened next to the S&P 500 when its 30-day correlation with the 10-year Treasury yield exceeded 0.8, while the S&P 500’s 14-day RSI was under 40 (i.e. risk-off when stocks are in a downtrend).
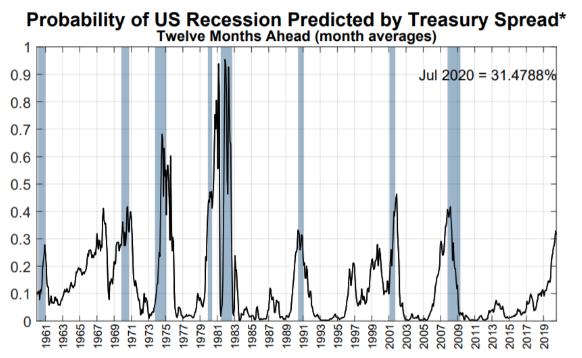
So are we just worried about nothing? We’ll only know in hindsight as history doesn’t always repeat and there are many studies for a wide variety of market correlations and metrics to consider. Having said that and reverting to J.P. Morgan’s yield curve inversion signal for an oncoming recession in the future, we can see that recession risks have continued to rise with consideration of the yield curve. The New York Fed’s Recession Probability Model has now been above 30% for 2 months in a row.
Historically, this has not been good for stock returns over the next 6-12 months, as shown in the following study:
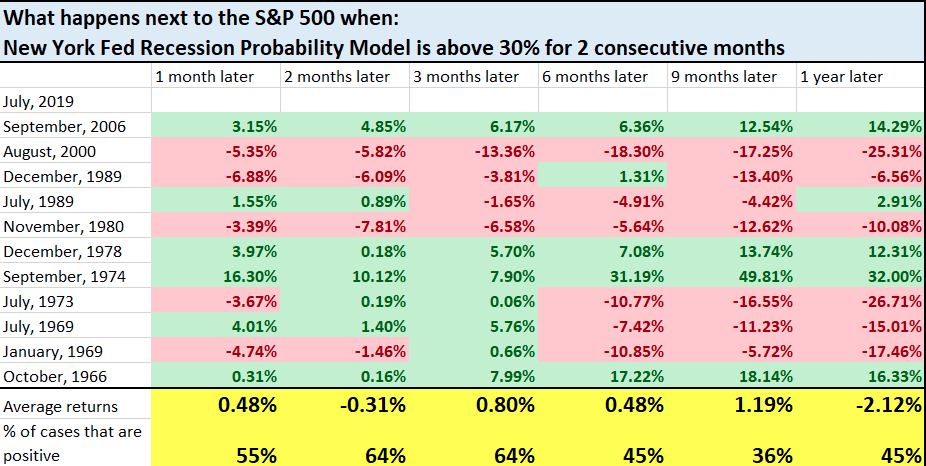
What one study giveth, another taketh away. There is no exact likeness to present day conditions and as such we urge investors to acknowledge the statistics, but lean against relying on them for purposes of investing and trading capital.
As we look forward to another trading day on Wall Street and with a strong rebound in U.S. equity markets Tuesday, investors want to know if “we’re out of the woods”. According to CNBC’s Jim Cramer, the answer to that question is not yet or maybe if…
“Those three prongs of panic that crushed us yesterday — currency, yields and earnings — still have not been resolved, despite the nice bounce today,” Cramer said. “I think we’ve got more wood to chop before we can have a sustainable rally.
The 10-Year Treasury yield fell more than a quarter point from the week prior to 1.74%, which Cramer said is a measure that signals the economy is “headed into a recession.” Because of this, money managers ignored further context – that other countries have lower rates than the U.S. – and assumed the economy was cratering, he said.
“This is what happens when lots of money flows to the U.S. from overseas: rich foreigners … companies, trusts, they buy Treasurys, which sends prices up and pushes yields down,” Cramer said. “Don’t get me wrong, that’s not good. It creates a strong dollar, hurts American exporters, but it’s not necessarily a sign that we’re headed for a recession and it does make mortgage money cheaper.
I think we’re in much better shape in this trade war than the conventional wisdom would have you believe, and certainly the talking heads,” he said. “And even if it drags on, there are plenty of companies that will do just fine.”
And with respect to the trade and tariff issues with China that are escalating, Cramer does not believe the tariffs will plunge the U.S. into a recession.
“We are not going into recession, people. We’re not because the tariffs are not going to do that,” Cramer said. “We have too much steam to fold.
We’ve got a strong job market, incredibly low inflation, plentiful natural resources. China’s facing a mass exodus of jobs, thanks to the tariffs and their economy was already fragile,” Cramer said. “At the end of the day, we don’t need to make a deal. However, I think that’s actually a bad and unnecessary outcome … [but] it’s still not going to wreck our whole economy.”
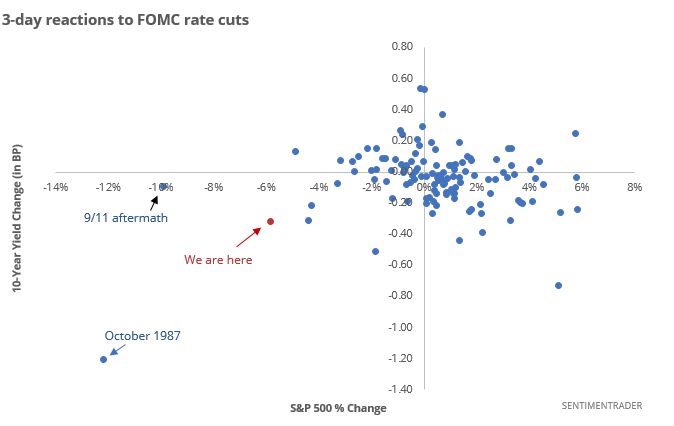
It’s been a whirlwind of a market since the last FOMC meeting, whereby the central bank cut its Fed Fund Rate by 25 bps. The drawdown in the market was initially blamed on the Fed’s mixed message surrounding future rate cut probabilities and dependency, but then it was usurped for reasons surrounding geopolitical trade tension escalation. And then the drawdown has been exacerbated by Yuan currency support concerns. Nonetheless, this has been one of the worst-ever reactions to an FOMC rate cut. Stocks have tumbled and bonds have rallied strongly in the several sessions since the Fed cut rates.
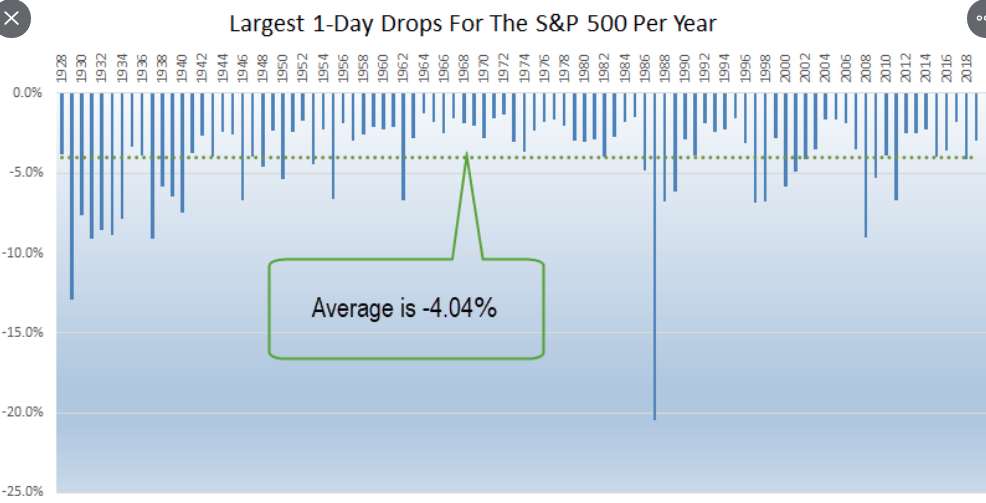
While the market bounced back mightily on Tuesday and is showing signs of additional gains in the premarket on Wednesday, we don’t know if the nearly 3% drop Monday will be the worst day of 2019. Investors should be aware that the average worst day of the year for the S&P 500 is down more than 4 percent. And we saw such moves in 2018. (See chart from Ryan Detrick of LPL Financial)
We don’t know for certain, and nobody does, wether or not we’ve seen another 2019-corrective market bottom. Having said that, hear is what Canaccord Genuity’s chief market strategist Tony Dwyer suggests about the recent pullback and his prescient rebound forecast from August 5th:
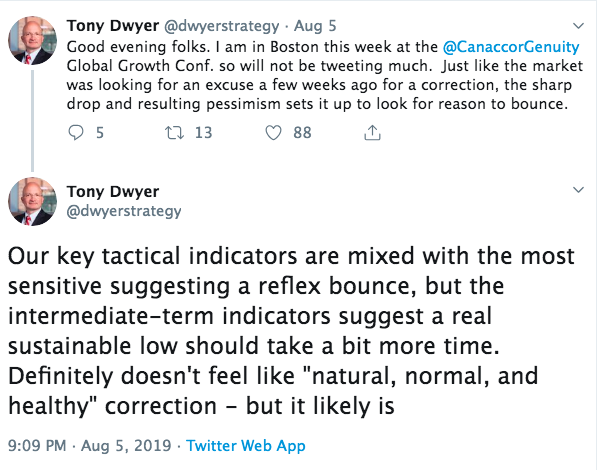
According to the tweet from Tony Dwyer, there may still be some downside ahead, but the current distribution phase is not abnormal and should be recognized as such. The yield curve has not yet inverted at its most important measured part of the curve and financial conditions remain loose and with a strong labor market and consumer appetite. While trade issues loom large and exact a toll on the global economy, the U.S. is somewhat insulated from the greater weight of the trade conflicts.
Moreover, while we can recognize the strengths and merits of the U.S. economy and outperformance in the equity market when compared to its regional peers, all of this is dependent on sentiment and sentiment is easily reversed by fears. It’s about expectations folks. We expect the economy to… and therefore we expect earnings to.. and therefore we expect the market to… Unfortunately, expectations can go awry when exogenous events occur; remember 9-11?
President Donald Trumps decision to escalate the trade conflict with China served as an exogenous event last Thursday that still remains an uncertainty, which in and of itself is damaging enough. It will likely result in global PMIs falling further, the yield curve flattening further and result in potential outsized risk taking as the hunt for yield is forced to accelerate.
Should a positive outcome not result from the latest tariff announcement by the September 1st imposition deadline and regardless of what Jim Cramer suggests its economic impact to be, the market may have another adverse reaction. Investors will not likely await the potential economic fallout and price one into the market… just in case! It’s that broader consideration that Finom Group desires readers to consider. The market and the economy move together over time, but intermittently, they can diverge akin to the current extreme divergence between equities and bond yields presently.


