
Twas another rough day on Wall Street as U.S. indices fell by another 3%+ and as coronavirus fears spread. In the early morning hours, futures were pointed to a higher open for the day and Finom Group urged traders not to trust the early indications, as we’ve seen this movie play out many times before during like conditions and during a market corrective phase. Here is what we offered to traders yesterday with respect to the strong equity futures on Tuesday:
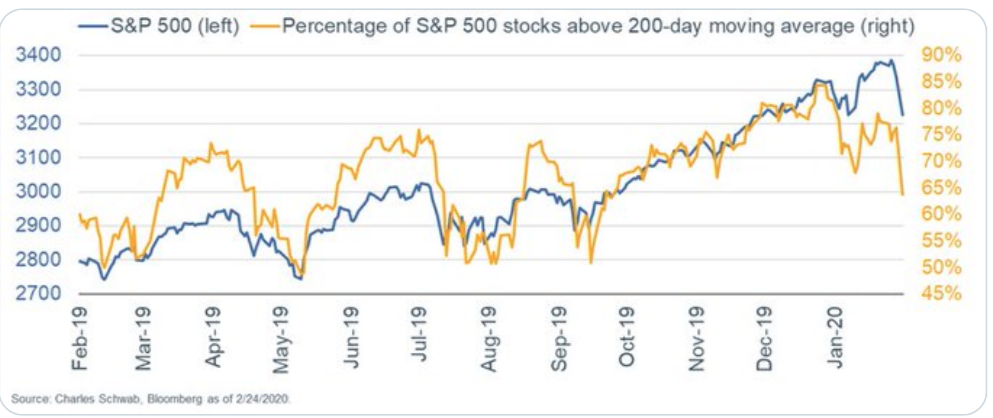
Finom Group is of the opinion that near-term bounces or relief rallies may prove rebalancing opportunities. The percentage of S&P 500 stocks trading above their 200-DMAs sank on Monday along with the benchmark index, further suggesting that breadth weakness wouldn’t support a bounce and demands caution on the part of investors until this breadth indicator more materially improves.
“After the largest selloff since October 2019, the S&P 500 may attempt a relief bounce of sorts. Caution is warranted if such a bounce is presented, as any bounce would form the “right shoulder” of a month long head and shoulders, and setup another leg to 3130. The 3,130 is key trendline support from 2018.”
When it was all said and done Tuesday, market participants were left with little semblance of hope, as the VIX climbed further and certainty seemed miles away. The S&P 500 (SPX) slid 3% to 3,128.21, posting back-to-back declines of 3 percent. The Nasdaq Composite (NDX) fell 2.8% to 8,965.61, and turned negative for the year.
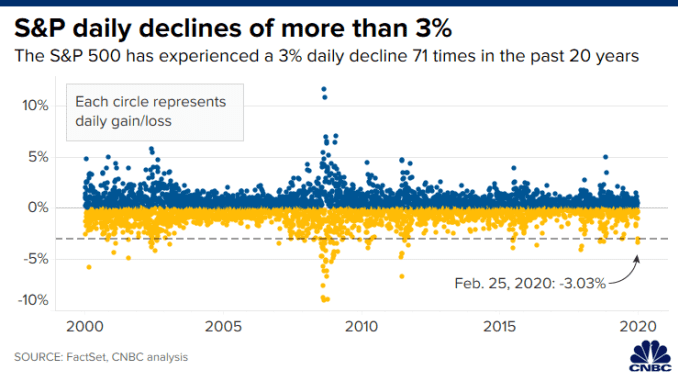
The last time the S&P 500 had back-to-back 3%+ declines was 8/21/15 and 8/24/15. Naturally, after a 2-day drop of greater than 6% and with the benchmark index down roughly 8% from it’s all-time high set just a week ago, breadth has materially weakened and the technical damage has been great. We’re now tied (with August 2015) for the weakest 2-day breadth reading in the S&P 500 since at least 1990, according to Bespoke Investment Group.
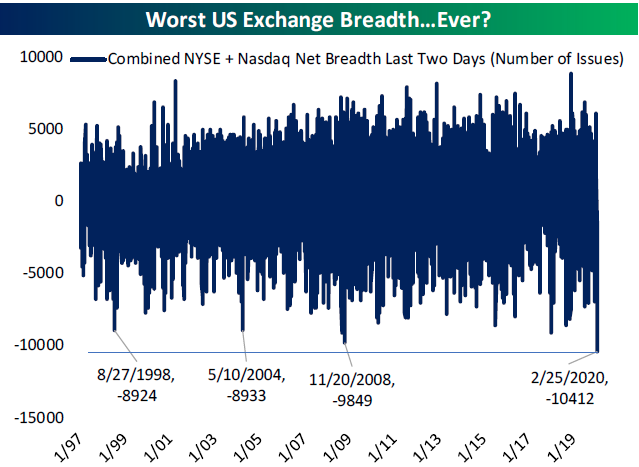
There were more net decliners than any other two-session period in history except for November 20th, 2008 when measured across the NYSE and Nasdaq.
Market breadth that is found so poor demands of it an exogenous event and it’s increasingly more clear that the coronavirus is providing such a driving force where risk-off is the paradigm of the global equity market. Having said that, if you are not excited by the opportunities that this pullback is presenting as a long-term investor, you are either too exposed to risk for your own tolerance and/or not considering that like all past epidemics, this too shall pass. Coronaviruses (CoV) exist all around us and are responsible for seasonal infections like the common cold. Very infrequently a mutation occurs and a novel CoV (nCoV) is created resulting in more severe respiratory infections (SARS & MERS). COVID-19 will pass just as those did. The severity of this coronavirus is mainly correlated to the initial and ongoing measures taken by China, which are inconsistent with the measures China took during SARS and with respect to the size of the regions manufacturing prowess that has grown by leaps and bounds since 2003.
In terms of the technical damage to the S&P 500 having taken place over the last 4 trading sessions…
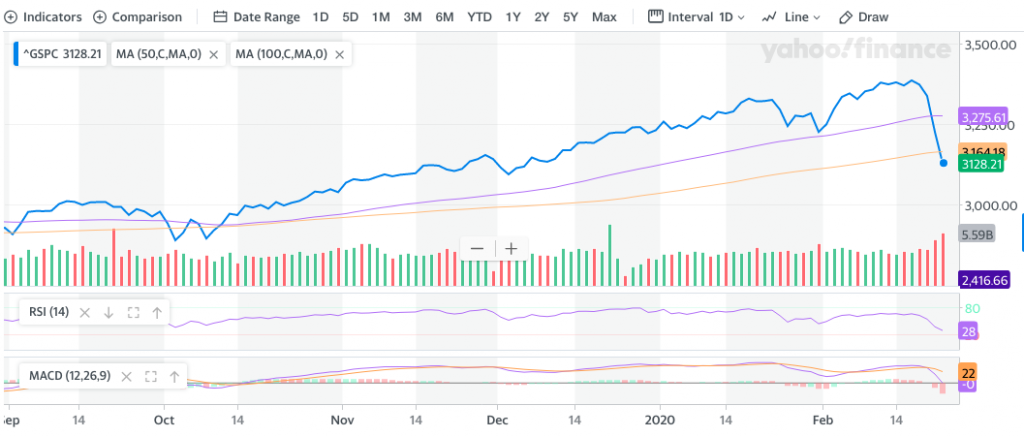
On the daily S&P 500 chart depicted above, the technical damage is clear. The plunge in equities has caused the S&P 500 Index to slice through the 100-DMA, a level that we had been watching for support and a potential bounce. The lack of support identified around this zone makes it difficult to suggest “catching a falling knife” until signs of buying demand materialize. The next level to the downside is very, very key to investor sentiment. The 200-DMA currently hovers around 3044, now only 2.7% below present levels. The benchmark, which was significantly overbought just over a month ago has now entered oversold territory. The Relative Strength Index (RSI) is below 30 and MACD has turned decisively negative in a rather short period of time. It should be understood that the dynamics of the coronavirus have created a very fluid situation in markets that will ultimately test central banks and policy initiatives.
In speaking of investor sentiment, it has plunged in a correlated manner to the major indices. Sentiment on Tuesday alone, as gauged by the put-call ratio, ended bearish at 1.31. This is the highest level since October 3, 2019 which proved to be an excellent time to accumulate equities. Recall, back on October 3rd, an abrupt dip to start the month of October led to a test of the rising 200-day moving average, resulting in a reversal candlestick that suggested buying demand around the long-term hurdle. A similar outcome this time around would be ideal, but unlike October’s trade war concerns, this is not something man can simply fix with the stroke of a pen. Yes, like most occurrences in the market and during an expansion cycle, this time is different.

The CDC officials and the World Health Organization (WHO) sent mixed messages concerning spreading COVID-19 around the world on Tuesday and during a live press conference televised by media outlets. The Centers for Disease Control and Prevention officials said the coronavirus is “likely” to continue to spread throughout the U.S. and outlined what schools and businesses should do if the disease becomes an epidemic.
While these healthcare organizations were offering cautiously pessimistic outlooks regarding COVID-19, the White House Administration marched out “Uncle Lawrence”.
“The virus story is not going to last forever,” Larry Kudlow said on CNBC’s on “The Exchange” on Tuesday.
“To me, if you are an investor out there and you have a long-term point of view I would suggest very seriously taking a look at the market, the stock market, that is a lot cheaper than it was a week or two ago.”
“The markets obviously are reflecting new fears. A lot of volatility out there. I don’t think these are fundamental factors …This thing will run its course,” Kudlow said.
While Uncle Lawrence is seemingly promoting the “buy the dip” investor exercise and will probably be proven prescient in the long run, CNBC’s Jim Cramer suggests a different approach, at least for now.
“Given that the averages hit record levels last week and the froth was as thick as I’ve seen it in ages, I think the slowdown still isn’t [fully baked] in these stocks. That’s why I continue to recommend this heavy cash position.”
“I want to be more aggressive — I do. I want to believe that Moderna’s vaccine works, that Gilead’s antiviral has an impact, that Zoom’s the way to work at home, and then I will have more stocks to recommend as the market goes down,” Cramer said. “But right now, I’d feel a lot more comfortable if there were even more pain in the market to reflect the true ugliness of this situation.”
“If the virus strikes here in a big way, then I think we’ll end up having a lot more downside. Any sector that relies on consumers actually going out and spending money will be in very big trouble, but if it doesn’t come here in large numbers, then the downside will be more limited.”

In reverting back to our focus on the S&P 500 which may still have more declines ahead, and as investors have no greater clarity on COVID-19 from Monday to the present, some strategists are of the opinion that the 200-DMA is not just a support level, but may prove the first stop before algorithms take the benchmark to a key round number.
While a tradeable bounce may be near, the weight of evidence tells us we that the 200-DMA at 3,044 may just prove a pit stop for the S&P 500. The S&P 500 still has a volume pocket towards 3000-3020, such pockets, like gaps are found with an equalizer in algorithmic trading times such as these.
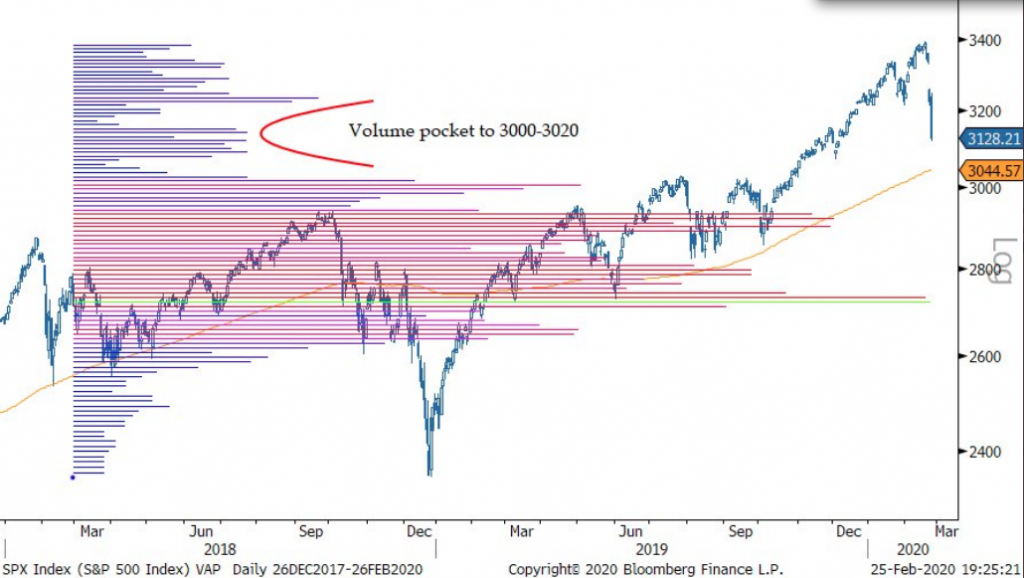
This does not guarantee that 3,000 will be achieved, it simply adds a layer of probabilities for market action and something that traders should recognize as an increasing probability as uncertainty looms large in markets. And while this key level for the S&P 500 also looms large and begs of anticipation on the part of traders, the President is reportedly found with great agitation over the stock market’s plunge. And of course, wouldn’t you know it, the plunge comes right after the latest President’s cheerleading of the markets on February 19th.
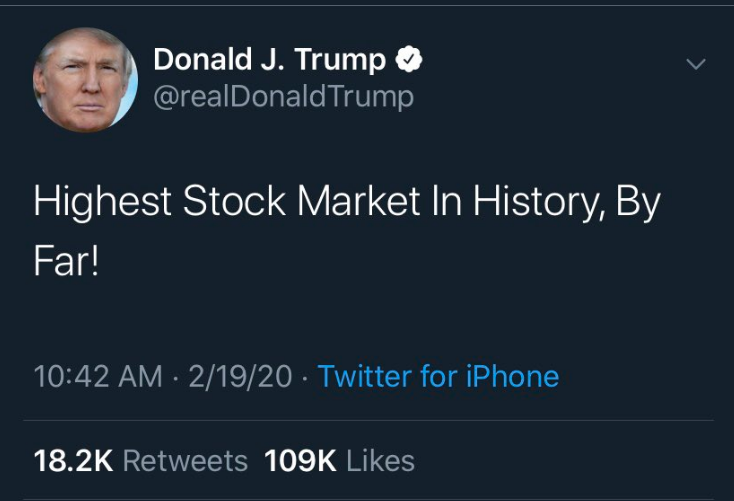
President Donald Trump is reportedly furious that stocks are plunging, believing that health officials’ warnings have spooked investors, The Washington Post reported Tuesday night, citing two people familiar with the president’s thinking. President Trump is expected to meet with aides on Wednesday to discuss the matter, the Washington Post said. Finom Group would suggest investors to be on the “look out” for additional tweets aimed at chiding the FOMC, at least.
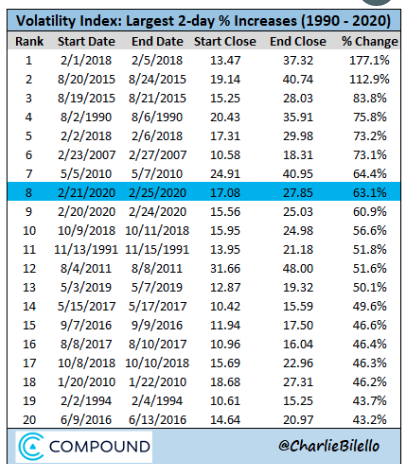
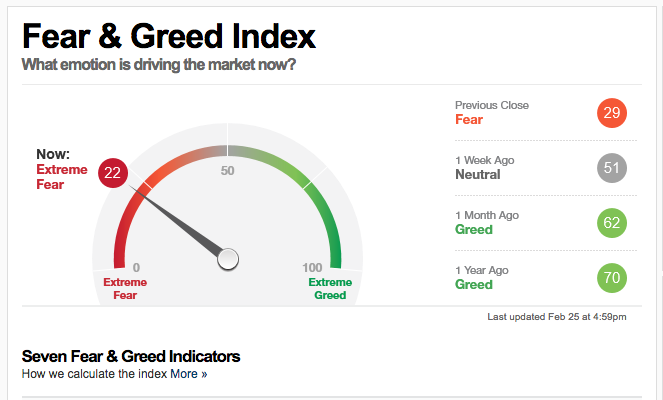
It probably goes without saying that fear is on the rise and it’s probably no better conveyed than in the President’s concerns over the recent plunge in equities and rise in the VIX. At 27.85, the VIX had its highest close since December 28, 2018. It rose roughly 63% over the last 2 trading days, the 8th largest 2-day spike with data going back to 1990.
Despite all the noise in markets, rising volatility and extreme fear presented by markets and from investors, the long-term outlook for equities remains rather solid.
Finom Group is of the opinion with a roughly 8% correction having been expressed in the major averages and with the Nasdaq in negative territory YTD, a good deal of “weak hands” have been flushed out of the market. Froth has largely been eradicated and improved risk/reward is afoot for long-term investors. While we hesitate to suggest a bottom is also afoot, given the developing macro-issues, we can suggest that the risk/reward does now favor long-term investors. We can do so on a technical basis and likely on a fundamental basis. But first, those technicals…
While we have presented weak breadth/market internals, the S&P 500 having sliced through the 50 and 100-DMA and a filling of 4 gaps on the way down, we also take notice of the 200-DMA and 200-WMA remaining in an upward slope.
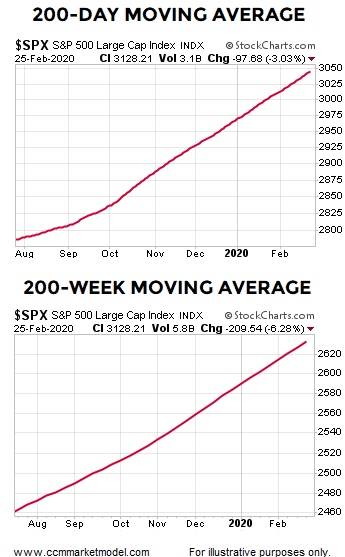
According to Chris Ciovacco, as long as the two charts above look as they do today, the longer-term bias is for the bullish trend to resume and for the S&P 500 to make a series of higher highs. “The charts may shift, but they have not shifted yet.”
Market retracements are normal in a healthy bull market as they offer for improved valuations and fund flows into risk assets. Keep in mind that the average year dating back to the 1980’s has had an average decline of nearly 14% per year. Thus far, the current pullback is normal and in keeping with this historical market trend.
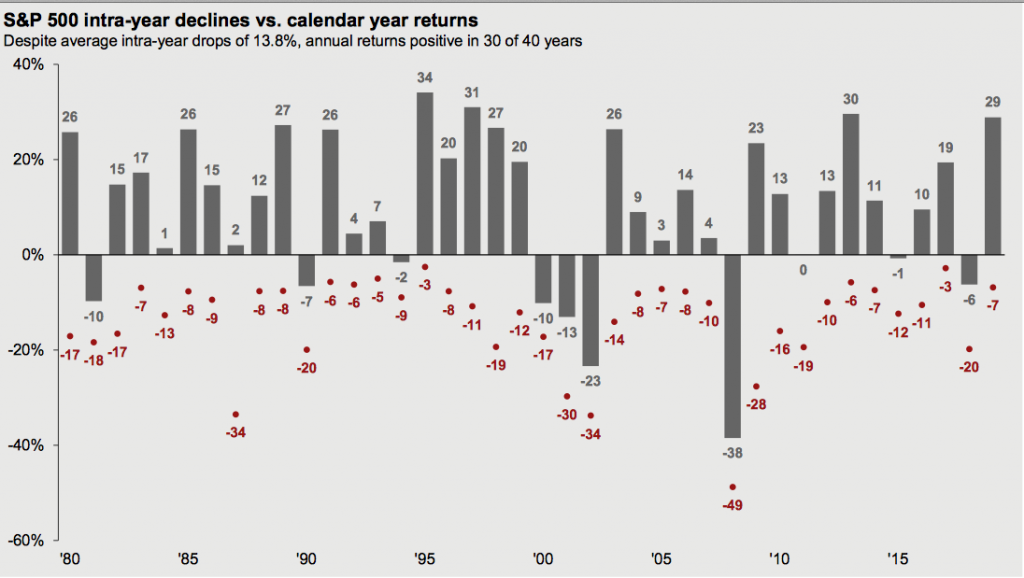
In recognizing the normalcy of pullbacks, Chris Ciovacco emphasizes the point in the following notes to clients:
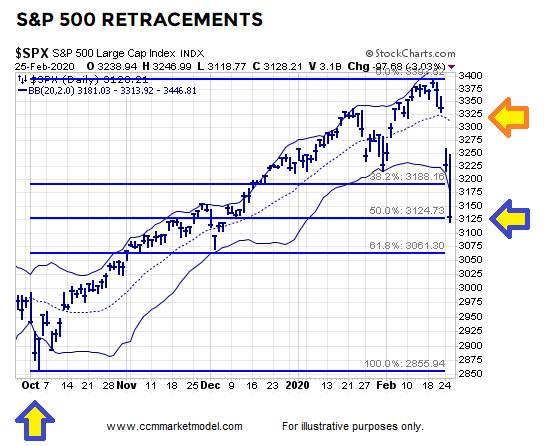
TYPICAL MARKET RETRACEMENTS
- It is not unusual for a market to retrace or give back 38.2%, 50.0%, or 61.8% of the prior rally before resuming the prior bullish trend. For now, the market is still in the typical retracement window based on the prior move from the October low to the recent high.
- The Bollinger Band center line is rolling over which speaks to a waning trend on shorter-term timeframes. It helps us keep an open mind about worse than expected outcomes.
- The S&P 500 closed well below the lower Bollinger Band which says the odds of a short-term move in the other direction have increased a bit.
- There is nothing magical about any of this; these are simply examples of guideposts to better understand risk-reward probabilities.
One of the more pressing concerns for market participants are the unknowns. The most impactful unknown centers on COVID-19’s impact on both global growth and corporate earnings. Without a basis of fundamental understandings on these two key macro-factors, the market finds it difficult to value forward looking earnings. It has only been that recently analysts have started taking down EPS estimates. During the 2/20 week, industry analysts had lowered their expectations for Q1 to only 0.7% y/y.
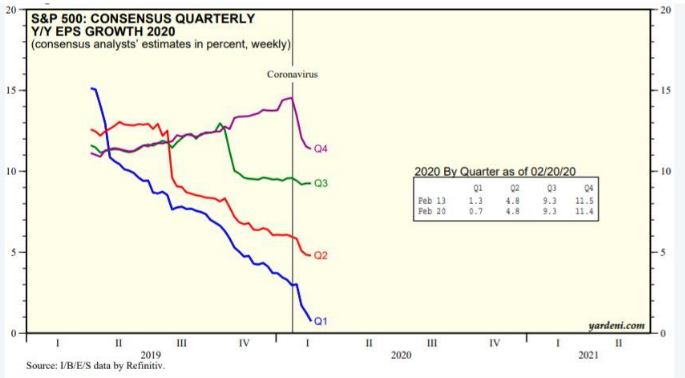
They are still expecting growth rates to improve over the rest of the year, but they are likely to lower them as long as the global health crisis persists. And if the crisis does persist, which is not Finom Group’s base case scenario, we would expect for U.S. consumer sentiment to wane and more aggregously impact consumption thereafter. In speaking of the consumer, the latest reading on Consumer Confidence for the month of February was revealed on Tuesday.
Consumers were still very optimistic about the economy in early February, but if the coronavirus continues to spread rapidly around the world it’s likely to take a toll on how Americans view their balance sheet and wage potential. Consumer confidence rose slightly to 130.7 from a revised 130.4 in January. It was the highest reading in six months, the Conference Board said Tuesday.
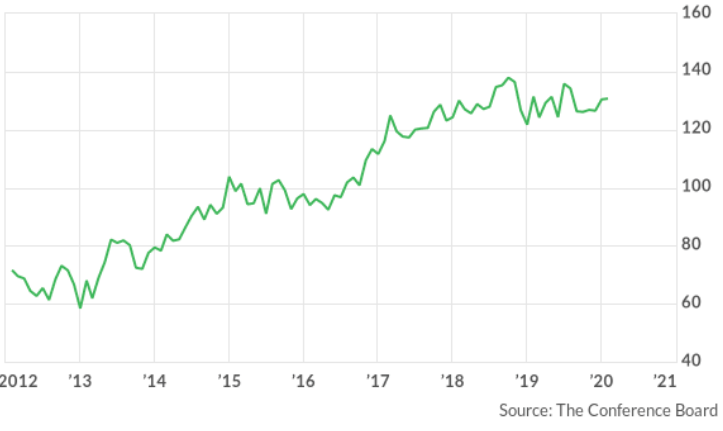
A key detail from the latest survey is the cut off date. The cutoff date for the survey was 2 weeks ago, before the outbreak of the COVID-19 illness spread beyond China to other countries such as South Korea, Iran and Italy. Another sub-index that assesses how Americans view the next 6 months rose to 107.8 from 101.4. That’s the highest level since last July.
“Looking ahead, confidence is going to depend on how everything plays out with coronavirus,” said economists at Jefferies LLC.
In addition to the details that are noted above with regards to the Consumer Confidence index, another key measures helps us to foreshadow the upcoming New home sales data.
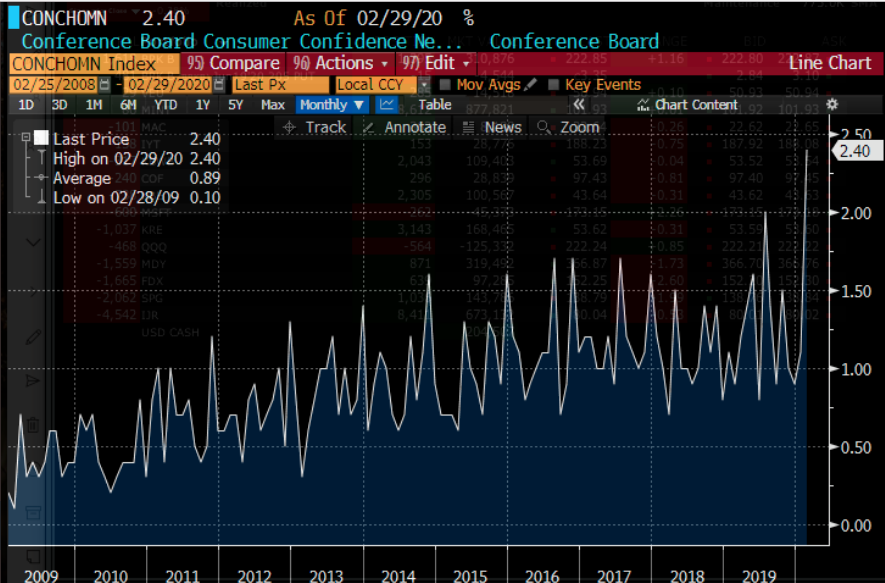
The Conference Boards’s intentions to purchase a has rocketed higher, as low fixed-rate mortgages have persisted since mid-2019. As we await New home sales data on Wednesday morning, investors have witnessed a new all-time low on the 10-year and 30-year Treasury yield as of February 26th.

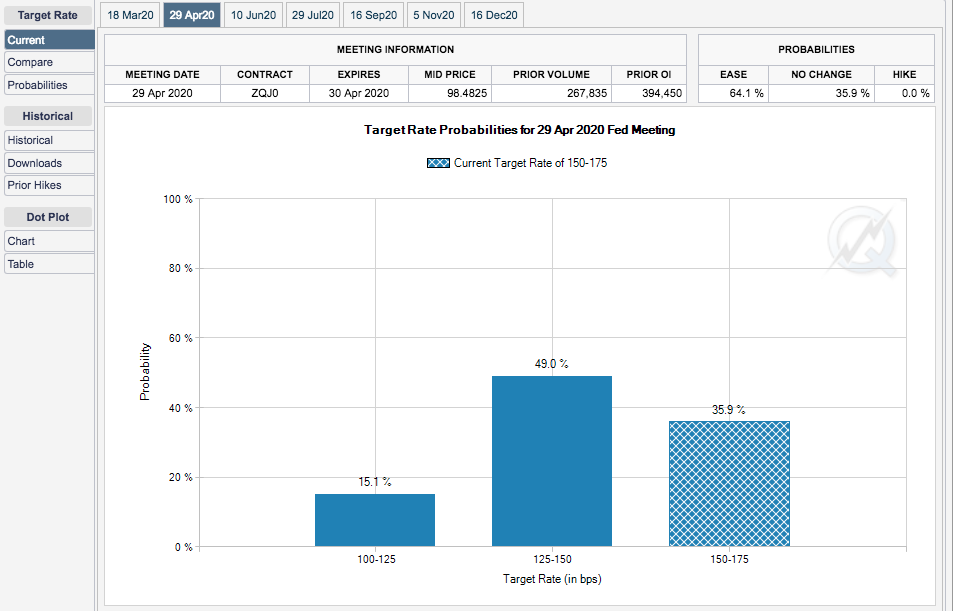
Yields are bouncing back slightly on Wednesday, but remain a key concern for the FOMC going forward. It’s clear that the bond market has been pricing in some greater impact from COVID-19 fallout that the equity market may have been ignoring. With yields achieving new record lows, they are also below the Fed Funds Rate, which must be addressed by the Fed with rate cuts sooner than later. As such, Fed Fund Futures have been increasingly pricing in such cuts.
No surprise, but today Fed Funds Futures dramatically increased the odds of rate cuts this year:
- April 2020 Futures broke out to a new 2020 high, with 65% odds rates will be lower than today.
- June 2020 contracts also broke out and now put 80%+ odds that Fed Funds will be lower than today.
Here’s an important point concerning the FOMC and how the organization is portrayed in the media and by the President as presented by DataTrek.
- As much as the Fed gets grief for providing a free market “Put”, on days like today it pays to remember that Americans watch stock prices more closely now than even back in 2008. Here is the Google Trends chart of search volume for “dow jones” (the most common stock-related online query) from 2004 – present:

- Even if most Americans do not own stocks, they know that equity market volatility correlates with personal job security and US economic stability. As we outlined in our “Markets” section of our full report, we’re late into an economic cycle and the US economy needs stable consumer confidence to keep the wheels on the expansion. Keeping equity market volatility in check helps that. Days like today do not help.
It remains to be seen where the line between long-term value in equities is met with sustainable buying. For now, we remain cautiously optimistic for the interim and long-term, as we view COVID-19 as having formed a more climactic turn. In March, we anticipate more headlines on the issue to surface, but some of these headlines should point to normalizing of the Chinese economy, commerce and transportation industries alike. While it is difficult to conceive in the present, and with markets reeling, these are indeed the times that prove to separate the weak investors from the resourced and resolute investors. We encourage our readers to join our Premium Membership and in our daily Trading Room, where we discuss the developments in the market and economy each and every day. Our community is growing and we invite you to join us!
A key feature of our daily trading room is the moderating and guidance from Wayne Nelson and Seth Golden. Our objective is to outline the facts of market and economic conditions as they are developing from day-to-day. Intraday there are opportunities to flesh out key market moving headlines and dialogue with our members within the Trading Room. Below is a screenshot of the developing Larry Kudlow interview on CNBC, that was to come.
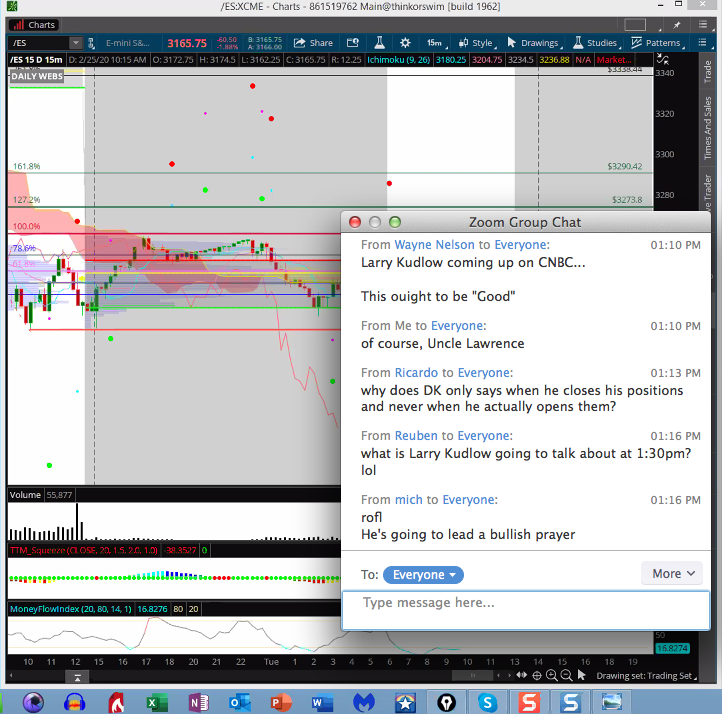
Where you can see the “lol” and “rofl” comments, they were in response to Seth’s verbal comment within the room suggesting that, given the backdrop of the coronavirus, Seth answered the question “what is Larry Kudlow going to talk about at 1:30 p.m.?, with “He’s going to read from “The book of Luke, chapter…”. Sometimes, our Trading Room aims to level set expectations in favor of the long-term realities of markets and those realities are that the issues of the day shall pass and markets trend higher… over time! Trade safely and join us in the Trading Room!
For the sake of levity and ending on an optimistic note… here is the latest take on markets and outlook from FundStrat’s Tom Lee:
FUNDSTRAT: “We think there is a 60%-70% probability that stocks will bottom this week, even as #COVID19 concerns linger for potentially months. .. We are buying this pullback and see a 94% odds markets are higher in 6M.
We still believe the base case and correct playbook is to treat to this sell-off as a correction in a bull market. If biz cycle was turning, the YC at the long-end should be inverting, not steepening.”


