Monday was one of those days that test the resolve of many traders/investors. The major averages fell by roughly 3.5% or worse, with the S&P 500 (SPX) tumbling some 3.35% on the day and accelerating losses into the closing bell. Many narratives and headlines produced during the trading day highlighted market losses due to the increasing surge in the polls from Bernie Sanders’ candidacy, but make no mistake about it folks, the vast majority of the market’s reversal of fortunes of late is coming by way of global economic growth fears perpetuated by the coronavirus. As the virus has spread beyond the borders of China and into Italy and South Korea, such regions are taking action that pressure corporate outlooks and coincide with lowered EPS outlooks. Mastercard was just the latest company to warn on forward-looking guidance Monday.
Shares of Mastercard fell on Monday after the credit card company issued a warning that the fast-spreading coronavirus could hurt its revenue this year.
“Cross-border travel, and to a lesser extent cross-border e-commerce growth, is being impacted by the Coronavirus,” the company said in a statement on Monday after the bell. The company said its first-quarter revenue growth will be about two to three percentage points lower than previous guidance.
“If the impact is limited to the first quarter only, we expect that our 2020 annual year-over-year net revenue growth rate would be at the low end of the low-teens range.”
Accompanying the Mastercard headlines were more headlines concerning iPhone sales in China. Apple’s China iPhone sales dropped in January as the coronavirus began to spread, according to an analysis of government data on Monday. Demand for the product fell 28% compared with the previous month, a bigger decline than usual for that time of year, according to a UBS research note citing official Chinese data.
“February numbers are likely to be far worse due to both supply and demand issues related to the virus outbreak,” UBS analyst Timothy Arcuri wrote in the note.
Beyond the implications for corporate outlooks, technical damage to the market was exacted on Monday. The S&P 500 dropped below its 50-DMA for the first time since October of 2019. With the gap lower in the S&P 500 to start the day on Monday, two gaps that had been created during the extended bullish trend have been closed on the way day Monday. According to MKM Partners, Monday’s gap down in the SPY was the 11th largest since inception of the ETF in 1993.
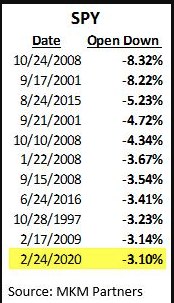
You know what you can do with statistic… neither do we! While this large gap-down suggests a bearish signal from markets, and based on a close below the 50-DMA we can’t deny the bearish action, gaps are almost always filled and when they are it can also be viewed as the typical bullish achievement during a corrective period. Keep in mind while the S&P 500 did put in a nasty performance to the downside on Monday, it indeed was just one day. When we look at the weekly chart of the S&P 500 and it’s relevant bollinger bands it proves a good day to take a step back and look at a longer term chart. The weekly S&P 500 chart with bollinger bands didn’t even get to the middle band yet.
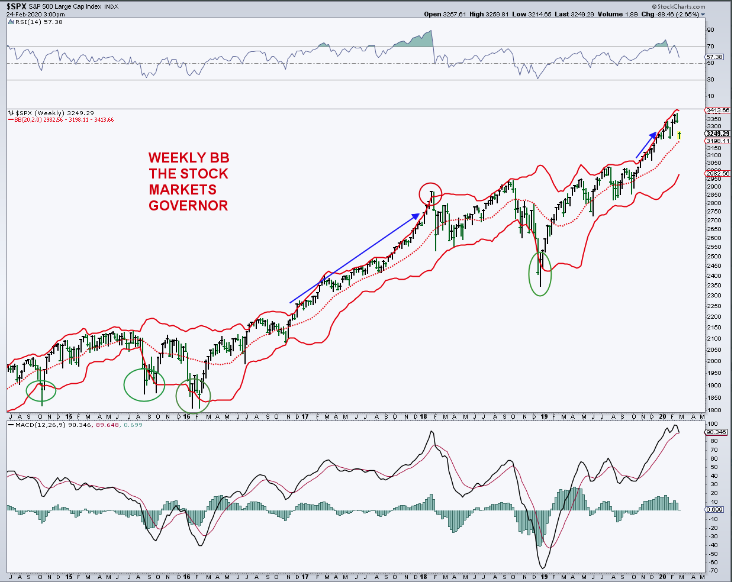
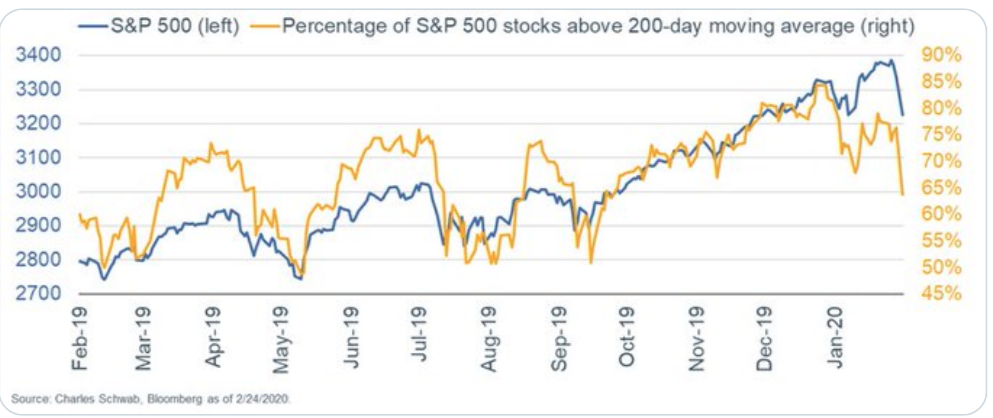
Does the S&P 500 have to get to such a level, no! Having said that, when we take into consideration the fundamental reason for the latest market dive, we are forced to recognize that the uncertainty of Monday has not been resolved as we move through the trading week. As such, we think it prudent for investors to anticipate more selling pressure during the trading week, coupled with tradable bounces. What one does with said tradable bounces is likely going to help with one’s portfolio performance on the whole of the year. Finom Group is of the opinion that near-term bounces or relief rallies may prove rebalancing opportunities. The percentage of S&P 500 stocks trading above their 200-DMAs sank on Monday along with the benchmark index, further suggesting that breadth weakness wouldn’t support a bounce and demands caution on the part of investors until this breadth indicator more materially improves.
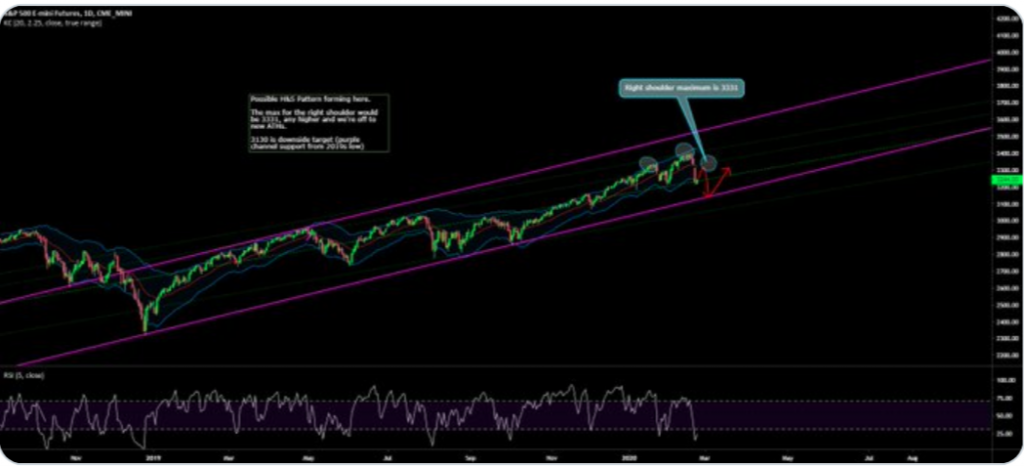
After the largest selloff since October 2019, the S&P 500 may attempt a relief bounce of sorts. Caution is warranted if such a bounce is presented, as any bounce would form the “right shoulder” of a month long head and shoulders, and setup another leg to 3130. The 3,130 is key trendline support from 2018 and a strong buy level according to widely followed technician Adam Mancini:
In terms of such large 1-day moves from the major averages, investors may desire to better understand what to expect going forward and after such outsized moves. The past 10 times that the S&P 500 index fell by as much as 3%, for example, it declined 0.27%, on average, in the next trading session. Futures are pointing to a higher open on Tuesday, so recall what we mentioned about tradable bounces, given the aforementioned statistic. Nonetheless, the average performance improved dramatically in the following week, month and year, as shown in the table below:
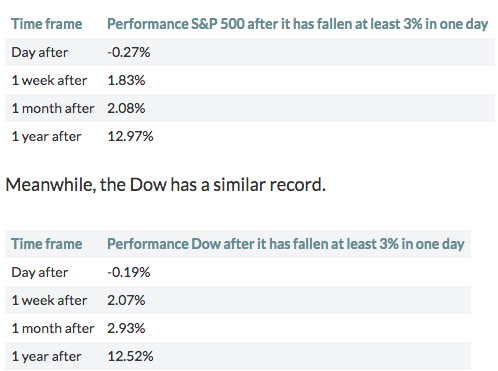
The statistics look quite promising for a resumption of the bullish trend after such a large 1-day correction in markets, but do keep in mind that history does not always repeat. In terms of statistical data, we use them more for the purpose of deciphering probabilities and in the context of risk management.
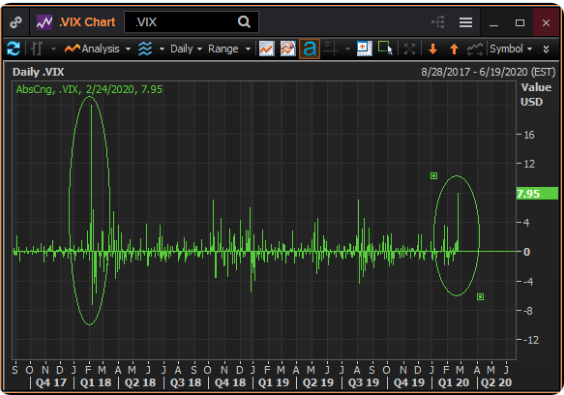
Naturally, with such a drawdown in markets Monday, we saw the biggest 1-day move higher in the VIX to coincide with the fear taking hold of markets. Monday’s 8 point move for the VIX was the largest one-day jump since “Volmageddon” on Feb 5, 2018. To give a sense of exactly how extreme that day was take a look at this chart below:
Do you know what you can do with this statistic…well let’s take a look and see what we can discover! Keep in mind that while this was the biggest 1-day jump in the VIX since Volmageddon, it was also the 13th largest 1-day jump in the VIX of all time. Future returns were, like the returns assumed by our previous statistics on the S&P 500 and Dow, pretty positive. (Study from SentimenTrader)
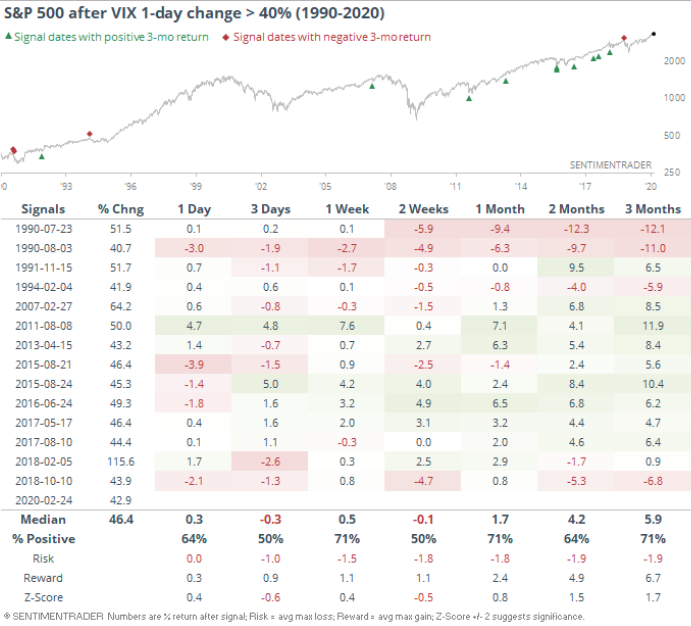
As shown in the table above, 1-year later, the S&P was lower only once, and that by barely 1 percent. The studies and statistics bear out what we mentioned earlier in our daily article, “Monday was just one day”. Don’t let a bad day, even a bad week overshadow what the market does and does without fail over time…rise in value.
Finom Group specializes in the art of selling volatility, mainly through engagement/transactions with VIX-Exchange Traded Products (VIX-ETPs). As such, yesterday’s extreme move in the VIX encourages us to dig a little deeper in order to identify short-VOL risks. The more information we have, the better we can define near-term risks to the trade.
With Monday’s VIX surge of roughly 45% to close the trading session, the VIX was 50% above the 10-day simple moving average (SMA). It ranked the 13th on the “All Time Exuberant VIX Board”, or in more simplistic terms, large distance from the 10-SMA. Usually, this is good for S&P 500 or SPY returns, however, one should recognize that it hit 140% beyond it’s 10-SMA just two years ago and during the Volmageddon event.
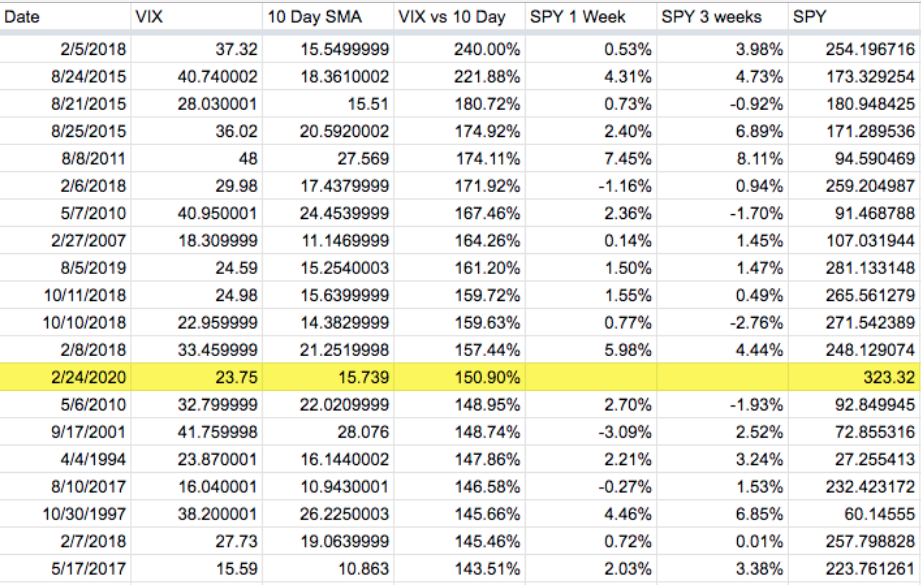
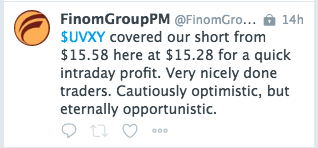
The table/stats above give us good reason to remain cautious on the outlook for market volatility and S&P 500’s performance near-term, even as we continue to stay true to our short-VOL strategy. Our strategy is in keeping with layered short positions during a major uptick in volatility. On Monday, we used the opportunity to scalp trade shares of UVXY, profitably.
In case you missed it in the malady of Monday’s market moves, (how’d you like that alliteration) we indeed completed a 5% correction. Remember, the S&P 500 all-time high achieved just last week was 3,393.52. With the move down to Monday’s low of 3,214, the S&P 500 achieved a peak-to-trough correction of just over 5 percent. And there you have it folks; the 5% correction many have been heralding, desiring and longing for throughout the 5-month long melt-up. But with such a decline achieved, it’s also important to put the improved risk/reward into perspective. Remember, the improved risk/reward for “risk assets” is what investors are looking for and with record highs and stretched valuations over the last few months, such a value was absent the market.
The 5% drawdown has led the dividend yield on the S&P 500 to jump over 5 bps since last Friday. According to Bespoke Investment Group, now at 1.94%, the S&P 500’s dividend yield is at its highest level since late October 2019.

Meanwhile, Treasury yields cratered Monday, with the 10-Year down over 10 basis points. That is the largest one-day decline in the 10-Year yield since August 14th of last year when it fell 12.43 basis points. That brings the yield down to 1.37%, which is the lowest level since July 2016 when it was 1.33 percent. Yields continue to fall into Tuesday morning’s trading session, given us further reason to remain cautiously optimistic on equities.

Going further out on the curve, the yield on the 30-Year Treasury bond is now at a record low of 1.82 percent. Similar to the 10 Year, that is nearly a 10 basis point decline from last Friday.

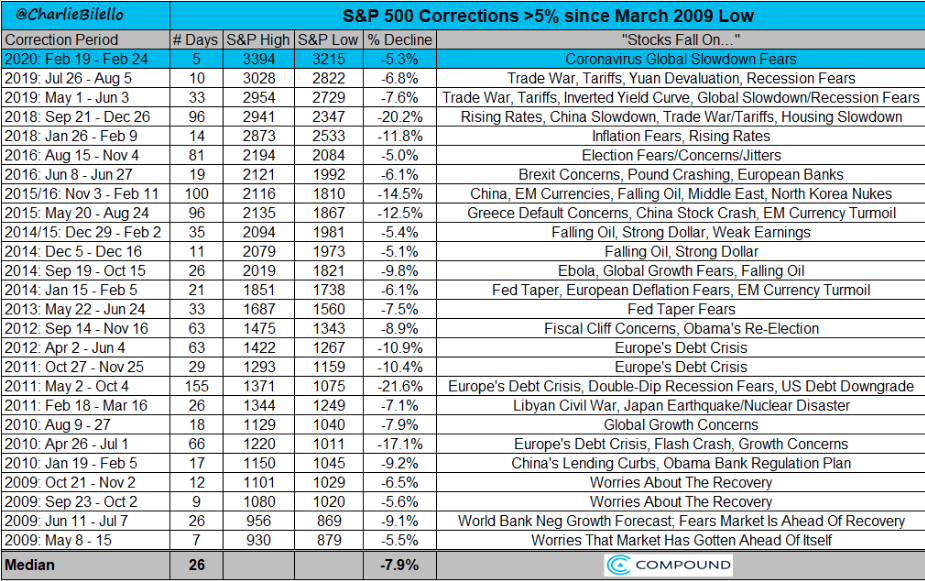
Putting things into perspective, the risk/reward will increasingly favor equities over bonds, should the equity markets continue their corrective phase. Also, this is the 26th correction of greater than 5% since the March 2009 low. They all seemed like the end of the world at the time, but led to gains in the future, begging of the average trader/investor not lose resolve in the midst of market turmoil. Market and economic uncertainty of the day always forces or finds resolution in the not too distant future.
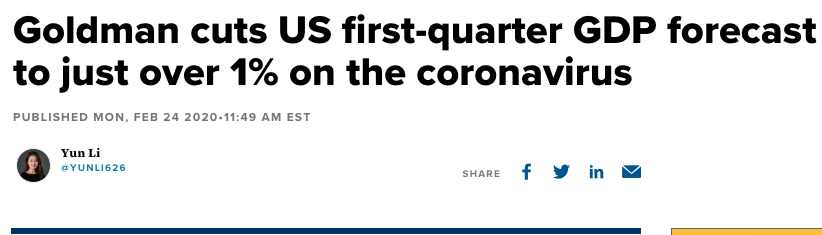
Market participants are becoming increasingly focused on economic fundamentals as the coronavirus fallout spreads beyond the Chinese borders to regions of Italy and South Korea, at least. Goldman Sachs recently reduced its economic forecast based on such realities that are more prominently presented in the global economy.
The big money center bank slashed its U.S. GDP growth forecast to just 1.2% from 1.4%, seeing a more severe drag from the epidemic. That growth rate is drastically slower than the 2.1% increase in the fourth quarter and 2.3% for the full year 2019.
“The risks are clearly skewed to the downside until the outbreak is contained,” Jan Hatzius, Goldman’s chief U.S. economist, said in a note on Monday. “An increasing amount of companies [are] suggesting potential production cuts should supply chain disruptions persist into Q2 or later.”
Goldman still expects “a negligible hit” to U.S. overall activity from supply chain production disruptions because there seems to be ample inventory to power manufacturing for a while.
“Lower production outside of China due to supply chain disruptions has remained negligible thus far, and that most sectors have enough inventory to continue production as normal until at least Q2.”
Goldman does see some of the activity lost coming back in the second quarter if the virus is contained. The firm expects second-quarter U.S. GDP to tally 2.7 percent.
Along with Goldman’s revised outlook, Charles Schwab’s Liz Ann Saunders also offers her take on the markets, with a focus on the impact from the coronavirus. The brokerage suggest comparisons to the previous coronavirus, SARS, may not lend themselves appropriately to today’s COVID-19 form of the coronavirus
In the years since SARS, China has become a much greater global economic force. It’s now the world’s second-largest economy, behind the United States. Not only is China a key player in the global supply chain, Chinese consumers play a big role in global demand.
And the virus is no longer just China’s problem. “Italy and South Korea, the eighth- and 12th-largest economies in the world, have shut down public buildings, sporting events and schools in parts of those countries. In the case of Italy, at least 10 towns around Milan have gone under lockdown,” Liz Ann says.
Beginning late last week, investors accelerated their embrace of “risk-off” investments, flocking into defensive equity sectors such as utilities, and to perceived “safe haven” investments such as Treasury bonds. However, long-term investors should not overreact, Liz Ann says.
“We continue to recommend that investors focus on diversification and rebalancing, and an emphasis on quality growth at reasonable prices, with a bias toward more defensive larger-cap stocks at the expense of more-cyclical smaller cap stocks.”
As we can see in the chart below, since the beginning of January, estimates for S&P 500 earnings per share have been cut for every quarter this year, with the largest haircut given to the first quarter. This has resulted in a move from expected growth of nearly 10% for calendar year 2020 to less than 8% at present. It’s hard to imagine that there aren’t more cuts to come; especially if the U.S. dollar continues to strengthen. For the first quarter, the largest slashing of estimates has been for the consumer discretionary, industrials and materials sectors.
2020 Earnings Estimates Getting Cut

Many comparisons have been analyzed between the coronavirus and the SARS outbreak in 2003. Economically, the impact is likely to be felt much more globally given the growth in not only China as a share of global gross domestic product (GDP), which has quadrupled; but China’s consumer as a global powerhouse as well. You can see the growth of both in the chart below.
China’s Weight in Global GDP Has Quadrupled

The bottom line for U.S. investors is that we may be just starting to see the impact from the coronavirus on the U.S. economy; although the good news is that there are some economic tailwinds that were in place prior to the virus’ outbreak, including some stabilization in U.S. manufacturing and strong housing data. Unfortunately some of this data is backward looking and will potentially weaken if consumer sentiment weakens due to falling equity prices and fear-driven headlines. CNBC has already produced its typical Markets in Turmoil special after Monday’s market declines. While this is usually one step in forming a market bottom in the interim, it also serves to frighten the average household and/or consumer.
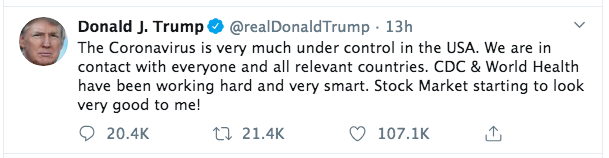
And of course, it doesn’t help that headlines are also proliferating whereby the White House Administration is asking for Congress to help provide funding to “fight the coronavirus”.

“This is obviously a priority and the president is paying close attention. There have already been cases in the U.S. and person-to-person transmission in the U.S. One of the things the U.S. and President Trump have been able to do is to have policies and systems in place to make sure we’re on top of it,” the official said.
It would seem as though the President is also keenly focused on the markets, as he has been since taking office in 2016. Additionally, while we look more deeply at the economic impact from the coronavirus and recognize the sound foundation or tailwind belying the economy, in the bad news column were IHS Markit’s “flash PMIs” for the United States. Its services flash PMI plunged four points in February, which was the largest drop since October 2013. That brought the index to 49.4, signaling the first contraction (< 50) in services activity in four years.
Moreover, Tuesday we’ll see if the all-important U.S. consumer has been impacted by the coronavirus headlines and recent market turbulence. On Tuesday, the Conference Board will deliver the latest Consumer confidence survey results for the month of February.
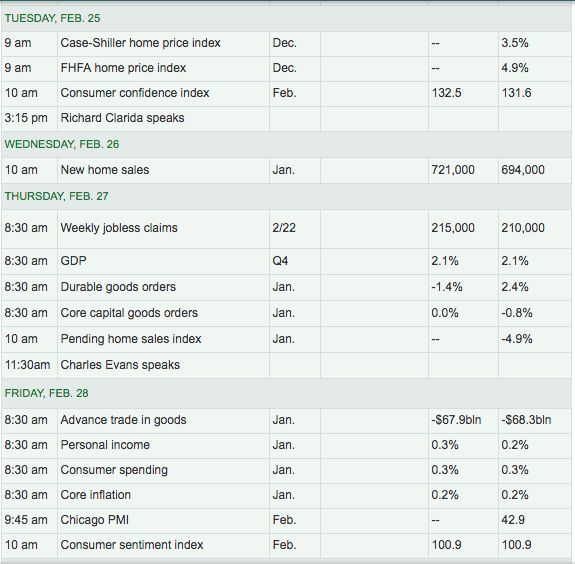
Tuesday’s equity futures are attempting a rebound ahead of the Consumer Confidence data due out in the early morning hours. A strong or stable number may prove to sustain the bounce in equities Tuesday while a much weaker reading would likely prove to find additional selling pressure. We shall see soon enough.
While the global markets are reeling from lowered economic and earnings’ forecasts, Finom Group is in the camp that suggests the current worry of the day will prove a fleeting moment in market history, that proves another strong buying opportunity for investors. The question many have relates to how quickly the market and/or global economy will recover from the coronavirus impacts. J.P. Morgan maintains the potential exists for a V-shaped recovery.
“Our expectation for a V-shaped rebound rests on two key assumptions about the coronavirus outbreak: that it does not become a broader global pandemic, and that economic disruptions in China reverse fairly quickly. Uncertainty about the first increased” over the weekend.”
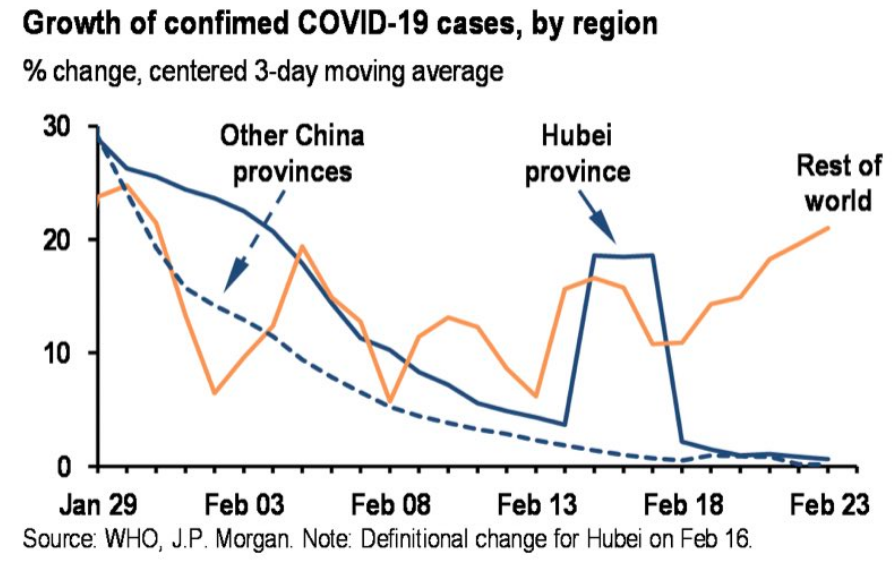
Finom Group has recognized that China’s leadership is recommending a timeline for normalizing commerce, production and transportation services in and around Hubei province come no sooner than March 10, 2020. This timeline will become increasingly in focus as it aligns with many analysts’ V-shaped recovery forecasts. Markets will also be monitoring headlines around this date as it draws nearer.

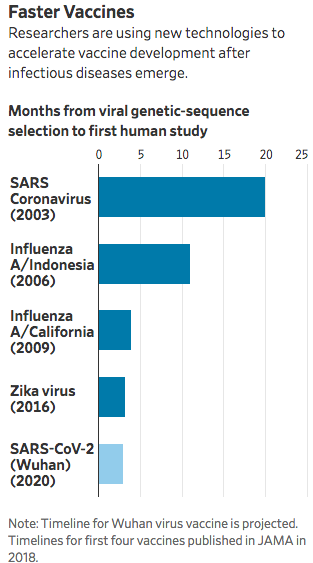
Headlines centered on a COVID-19 vaccine will also become increasingly important to market participants and have already begun to proliferate with drugmaker Moderna spiriting a vaccine. Clinical trial is expected to start in April, as epidemic originating in China spurs quick response
Drugmaker Moderna Inc. has shipped the first batch of its rapidly developed coronavirus vaccine to U.S. government researchers, who will launch the first human tests of whether the experimental shot could help suppress the epidemic originating in China.
Moderna on Monday sent vaccine vials from its Norwood, Mass., manufacturing plant to the National Institute of Allergy and Infectious Diseases in Bethesda, Md., the company said. The institute expects by the end of April to start a clinical trial of about 20 to 25 healthy volunteers, testing whether two doses of the shot are safe and induce an immune response likely to protect against infection, NIAID Director Anthony Fauci said in an interview. Initial results could become available in July or August.
Finom Group remains cautiously optimistic in the near-term and with respect to market performance, but most optimistic longer-term and on the whole of 2020. Successful long term investors have practiced for decades the needed, disciplined behavior for enduring equity declines. Not panicking, “buying when they are crying”.
Successful investors also understand the importance of diversified multi- asset portfolios. Trade safely friends and join us in the Finom Group Trading Room daily!


