
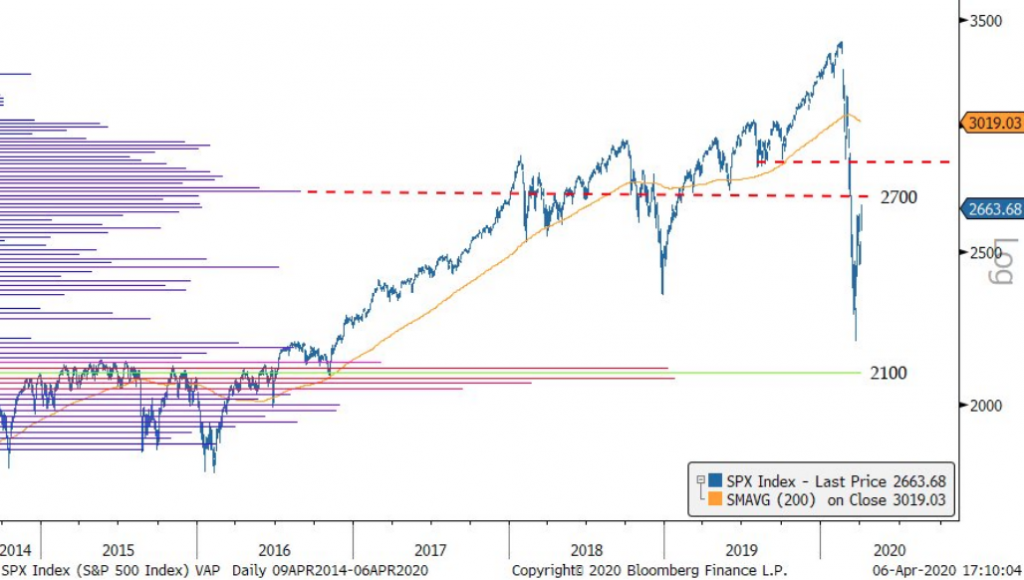
The rally and close above 2,700 that never was, at least that is probably the best way to describe the S&P 500’s (SPX) action on Tuesday. The benchmark index was up more than 3% (HOD 2,756) at one point Wednesday, but it finished in the red and down by .16 percent. It was the 7th instance in the last 50 years such a reversal had taken place. The sample size on this is obviously very small, so it’s meaning is open to interpretation. The S&P 500 did still close above the prior Fibonacci resistance level at ~2,650. (Chart from Michael Kerr)
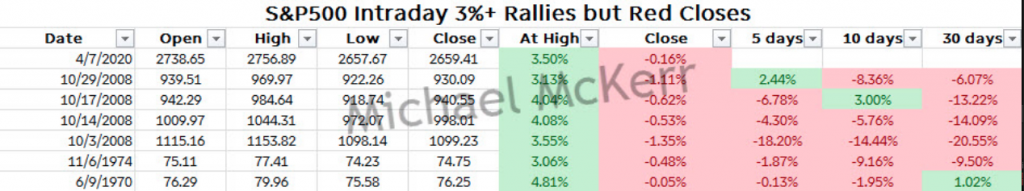
Tuesday was likely going to be one of the biggest bull vs. bear battles we had seen in some time given the technical move in that was taking place within the S&P 500. The 2,700 level was a high volume, multi-year level that had served as a weigh-station of sorts for investors/traders since 2017. Failure to hold and close above these sentimental area of great volumes may prove the undoing of the relief-rally that commenced 2 weeks prior.
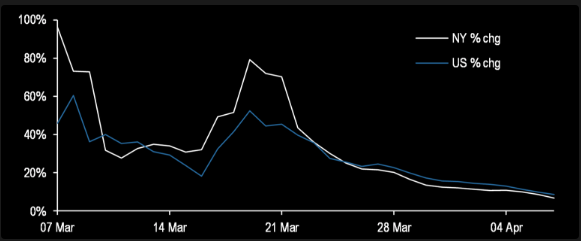
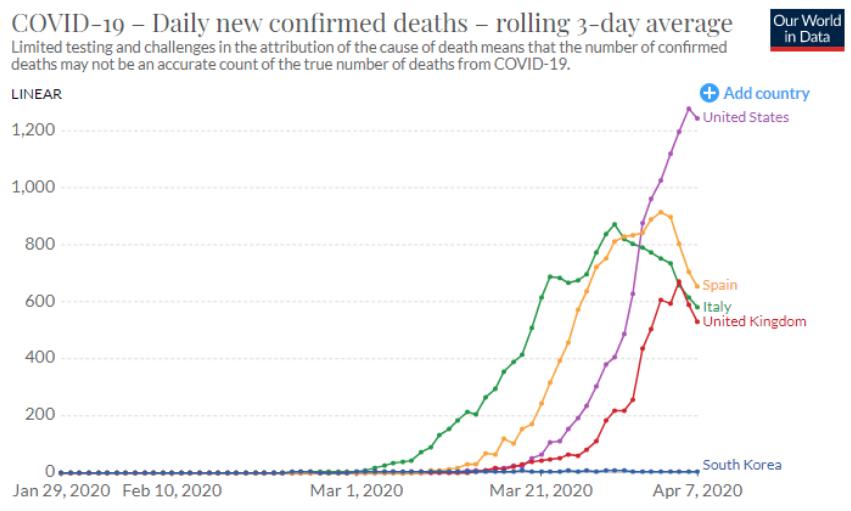
The reversal of fortunes for U.S. equities on Tuesday has been met with a global risk-off follow-through as most Asian equity markets finished in the red and Europe has since opened in negative territory on Wednesday. While markets remain highly volatile and with large intraday swings, the good news remains with the improving global epidemic curve.
It was at the beginning of March, Finom Group’s chief research analyst and CIO of Golden Capital Portfolio offered his outlook for the market and the epidemic curve in our weekly Research Report:
“The back-and-forth market activity this week was found with large daily/intraday moves. Such market volatility proved to elevate the VIX another 4.5% on the week, even as the S&P 500 climbed. We identify this increase in the VIX as possibly foreshadowing greater downside in the markets for the coming weeks. With that being said, we also suggest investors continue to develop hedging strategies and/or raise cash in the near-term if such actions haven’t already taken place. It’s also important to consider risk tolerance going forward, and with a less than optimistic 3-week outlook.
According to Finom Group’s chief research analyst and Golden Capital Portfolio’s CIO Edward Cordoba, his research suggests that a bottom has not yet been found and a retest of the lows from February (2,855) are likely to be retested. Cordoba’s cautious outlook estimates a bottom likely comes late March- 1st week of April.”
Our report and suggestive positioning for subscribers proved prescient and at least the interim market bottom has been found in late March, with the S&P 500 low of 2,191. From here and going forward, the picture becomes less clear, but we consider cash positions a great tool for investors as the COVID-19 global economic impact devolves and equity market volatility remains elevated. Speaking of market volatility…
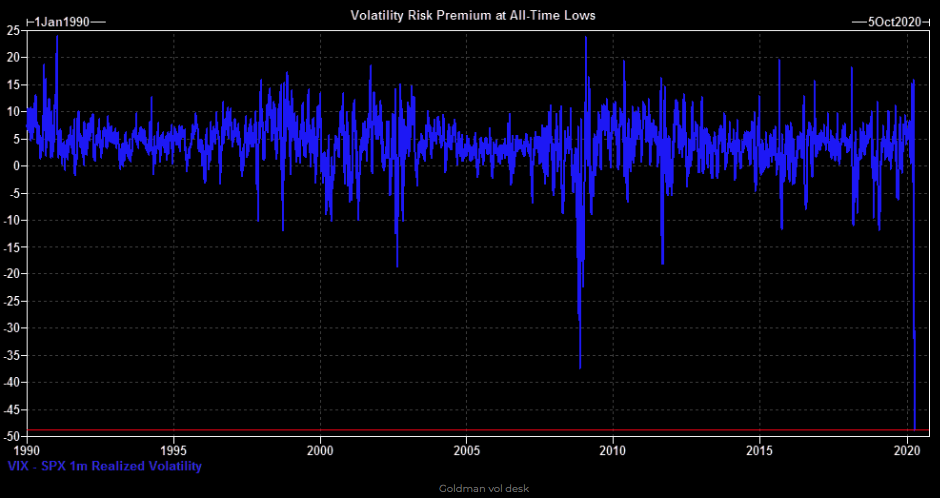
The volatility risk premium, measured as the VIX minus SPX 1m (30-day) realized volatility, has fallen to nearly -50, the lowest level since the VIX’s inception in 1990. Like many other variables plaguing that accompany this bear market, this is unprecedented. With volatility being a mean reverting asset, either realized volatility (HV) will fall, or implied volatility is too cheap, and will rise to bridge the gap. Most investors/analysts will likely assume the latter has a greater probability.
A perfect example of this divergence/gap between IV and HV took place again on Monday. The VIX at roughly 46 on Tuesday indicated ~3% move in the S&P 500. The realized volatility or HV (historic volatility), however for the day, was nearly ~7%+ (up more than 3% at peak and reversed all gains by closing bell). While HV proved much greater than IV on Monday, the gap between the 2 also remained at extremes. For a more simplistic idea of the concepts in market volatility, we can view it through the S&P 500 index ETF (SPY).
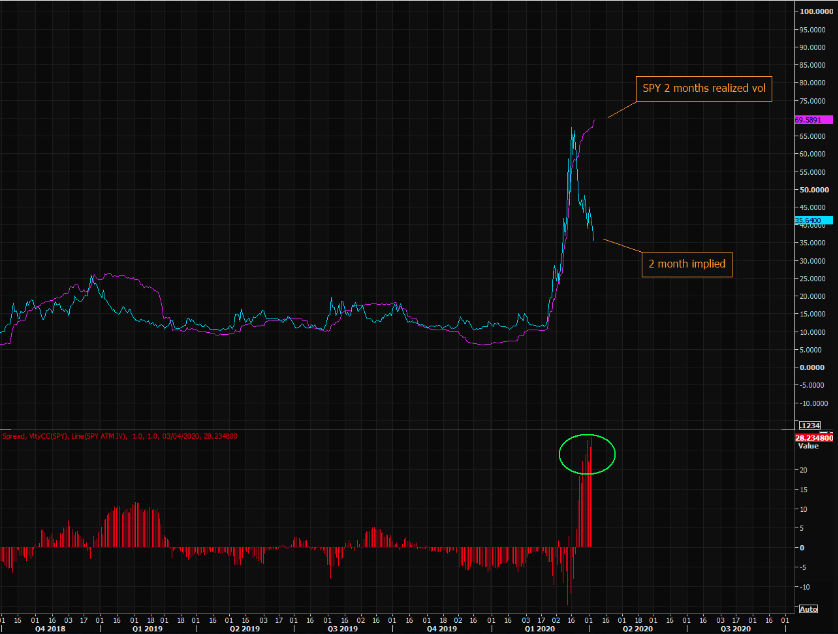
As shown in the chart above, we can see the gap between SPY implied and realized 2 month volatility, as well as the spread between the two being extreme in the bottom chart. With regards to market volatility, it remains to be seen how this all resolves. Most analysts are still calling for a bottom retest of sorts, as the economic and earnings uncertainty remains the narrative surrounding investors. Should markets aim to revisit previous lows, the potential for a secondary spike in the VIX should be part of investors’ playbook of considerations. There are no guarantees and the Treasury market may have something to say about equity market volatility when it is all said and done.
The gap between volatility gauges for stocks and Treasuries has climbed to a level that has previously forecast gains in equities. Both the VIX and ICE BofA MOVE Index have surged since February amidst the global pandemic crisis, but the MOVE Index has dropped more significantly than the VIX. The VIX remains around its 99th percentile and the MOVE index has fallen to around its 16th percentile, largely due to the Fed’s measured actions to stave off a credit crisis and drive liquidity back into credit markets.
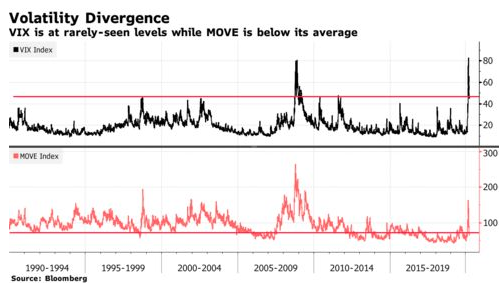
According to Jim Paulsen of the Leuthold Group, “This relatively rare condition of intense stock market fear, combined with a generally calm bond market, has proved to be a powerful combination for ensuing stock market returns.”
“When the VIX is above the 80th percentile and MOVE is below the 50th percentile, the average annualized S&P 500 price performance has been “remarkable — at nearly +21% compared to only a little more than +7% the rest of the time.
The MOVE closed Tuesday at 72.2, compared with its average 92.8 since the beginning of 1990, according to data compiled by Bloomberg. The VIX was at 46.70 — and would have to fall below 24 to get out of the top quintile from the past 30 years.”
When we review the S&P 500’s outside reversal that proved historic or existing and prevailing market volatility, we may remain with such whipsawing action for some time. Nobody has ever seen such market conditions before, as the President might say? According to Bespoke Investment Group, over the last five weeks, the S&P 500’s average absolute daily percentage change has been +/-4.8 percent. That’s higher than we saw at the height of the financial crisis (2008), after the 1987 crash, and in the late stages of the Great Depression. The only time the S&P 500’s average daily move over a five-week period was greater was after the Crash of 1929.

Tuesday’s rally also puts the S&P 500 on pace for its 13th straight day of moving up or down 1% or more. That’s a longer streak than anything seen during the Financial Crisis and just two shy of the 15 straight days we saw in October 2002 at the lows of that bear market. Before that, though, the only other period where there was a longer streak of 1% daily moves was during the Great Depression.
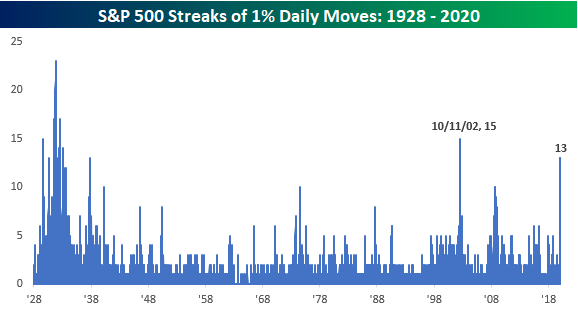
While 13 straight daily 1% moves is extreme by any measure, what makes this current streak even more notable is that it would be the second 13-day streak of 1% moves in the last 27 trading days. That’s right, from 3/2 through 3/18, the S&P 500 went 13 straight days of moving up or down 1%. Then, on 3/19, the S&P 500 broke that streak by rallying just 0.47%. Since then, though, it’s been 1% all the time again with the S&P 500 on pace for its 13 straight daily move of 1% again. Looking at this another way, in the last five weeks (25 trading days) the S&P 500 has seen a 1% move 24 times.
The negative sentiment that continues to surround investors and markets may prove just the fuel to support markets and hold the interim bottom found in late March. Ever wonder why companies “sandbag” guidance, set a low bar. They do so in order to jump over easy guidance and/or comparative metrics. It’s known as “under promise and over deliver”. So as we see all of the firms and analysts come out with their dire forecasts for GDP and EPS declines, don’t be surprised if such low expectations are found to be buy signals for institutional investors.
In the current environment and when you have a race to see who can come up with the worst forecast, you will quickly have estimates that can easily prove overly pessimistic. ISI sees -16% GDP growth in 2020 and only 5% growth in 2021. The chart below shows global GDP growth along with J.P. Morgan’s projection.
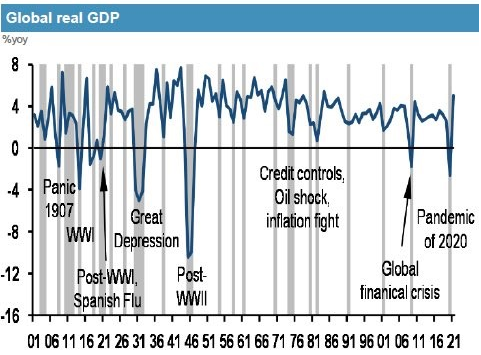
As you can see, J.P. Morgan previously called for about a 4% downtick in GDP for 2020. ISI’s call for a 16% decline in GDP in 2020 would be worse than the Great Depression and worse than the post-WWII decline in GDP. These estimates and more are known to investors and therefore priced into the market by investors. The bottom may have been priced in if we are seeing such estimates. Don’t get us wrong, if the pandemic shutdown elongates, the estimates may not prove low enough, but that doesn’t seem to be the greatest probability at the moment and given the plateaus we seen in the epidemic curve of late.
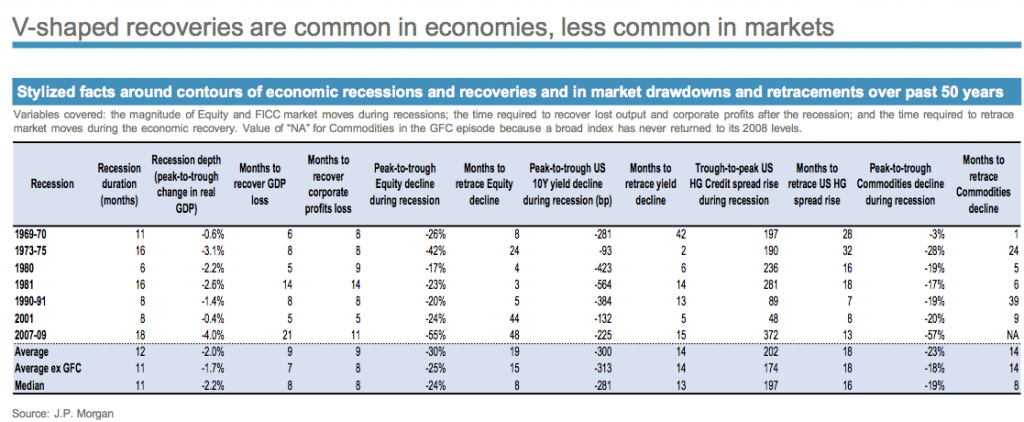
Investors are always best served with forward-thinking; so what’s next? It seems like everyone’s considering what’s next in terms of the post-peak pandemic recovery. Will it be a V, U or L-shaped recovery. Pretty sure that if you asked most average American’s they wouldn’t care about the shape but rather the reality of a recovery. We think that given the severity of the economic shop and shuttering of the economy, the most likely outcome is a V-shaped recovery for the economy. Equity markets don’t typically have the same outcome.
With this being said, let’s review our narrative from this weekend’s Research Report that dove into a conversation about recessions, bear markets and how they evolve. During a recession, the stock market typically continues to decline sharply for several months. It then often bottoms out about 6 months after the start of a recession, and usually begins to rally before the economy starts humming again. These are of course just market averages and what we’ve had was not the average bear market. Again, this begs of us to question as to whether or not we have bottomed already at SPX 2,191.

Quite frankly and because of the rapidity for which the pandemic has resulted in an economic shutdown, the market didn’t have the typical 6-7 months to price in a recession; it did so in 16 days, ultimately finding an interim bottom in ~25 trading days. If the economy is forecast to begin “humming along” again in Q3, per Goldman, Morgan Stanley and J.P. Morgan all project, the market doesn’t have 6 months to bottom-out either.
Morgan Stanley Chetan Ahya: “For the US, we expect an unprecedented drop of 30.1%Q SAAR in 2Q20 with the unemployment rate also rising to a record 12.8% (since data collection began in the 1940s) before we see it bouncing back at a 29.2%Q SAAR pace in 3Q20.”
Wouldn’t history suggest the market has already bottomed as well and prepared to price in this recovery in economic activity that is forecasted for the back half of the year?
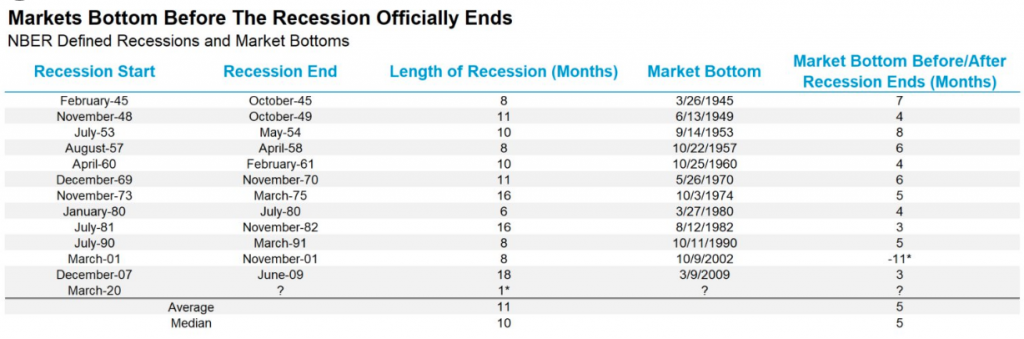
- There have been 12 recessions since WWII.
- The S&P 500 bottomed on average about 5 months before the recession ended.
- Always remember that stocks tend to lead the economy.
Moreover, look at jobless claims continuing to reach record levels. They likely haven’t peaked either, one might say. Stocks usually are ahead of the game, but this time they will be even further ahead of the economy because it’s clear there will be a recovery once the shutdowns end. As you can see from the charts below, in the last 2 cycles the unemployment claims peaked a few weeks after the stock market trough. Distance between the trough in the stock market and the peak in unemployment claims could be larger in this cycle.
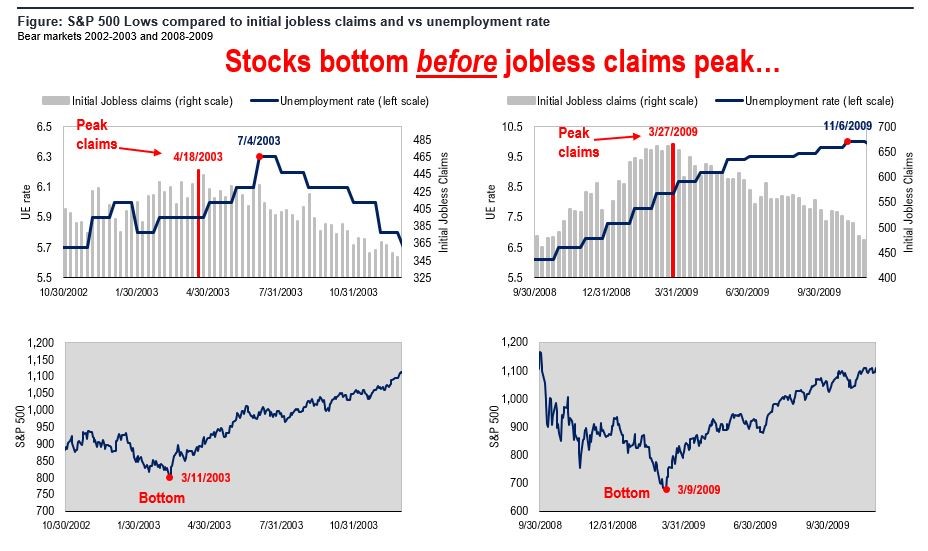
It’s possible this coming week’s report is the peak. That partially depends on when the shutdowns start ending. The White House Administration has previously indicated loosening economic business restrictions or guidelines at the end of April.
So whether or not it’s a V, L, or U-shaped recovery doesn’t matter to us, what matters is a recovery that is expected regardless. Mankind will overcome the current crisis as it has overcome every crisis throughout history and as such it would prove unwise to bet against the economy and markets for any great period of time. Finom Group anticipates a V-shaped economic recovery simply due to the unique aspects surrounding the sharp recessionary conditions that have come to pass. The market is a tougher forecast or characterization, although one man’s V could certainly appear as a U to another. Speaking of U-shaped recoveries, here’s CNBC’s Jim Cramer on the shape of the market recovery he forecasts. Keep in mind, Cramer has pounded the table for investors to sell into rallies such as those that appeared on Monday and Tuesday this week.
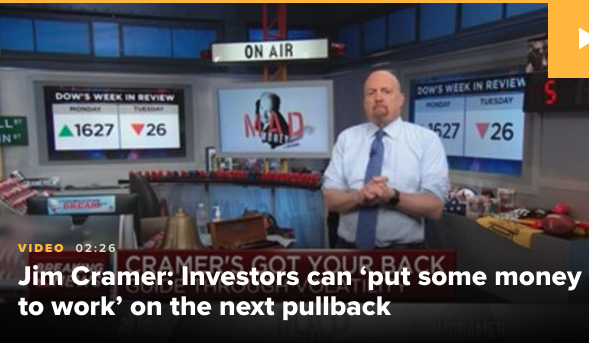
“Without a V-shaped recovery, you have to be skeptical of these big moves higher. Because in a U-shaped recovery I’m expecting, the stock market will pull back again and that is when you can put some money to work.
Based on Monday’s 7% market rally, investors are hoping that the economy has a V-shaped recovery, Cramer said, which is where business activity snaps back if the ongoing outbreak is quelled soon.
‘V’ is what justifies yesterday’s rally” but “I do not believe in the ‘V’ when it comes to this recovery.
He gave three reasons:
- There’s no effective way to treat or prevent COVID-19.
- Asymptomatic individuals are capable of still spreading the virus.
- While the curve of new infections appears to be flattening, it only takes the worst-case scenario off the table.
Despite the federal government’s programs to inject more money into the economy with bailouts, small business funding and stimulus checks to citizens, “we won’t be able to have a real recovery until we beat the virus.
[T]here’s no economic solution to a pandemic that’s biological. You can’t just snap your fingers and make those customers come back,” he said. “That’s why I don’t believe we can have that V-shaped recovery. There’s too much fear.”
If we get the pandemic contained gradually, the economy will bounce back gradually.
As we revert back to the equity markets’ reversals from 3%+ gains on Tuesday into slightly negative territory at the closing bell, we can’t help but to recognize that things have greatly improved with the global epidemic curve. Unfortunately, the same can’t be said on the crude oil front. So if you’re wondering what could also have proven the undoing of the equity market intraday gains on Tuesday, look no further than the following 5-day chart of crude oil and the S&P 500.
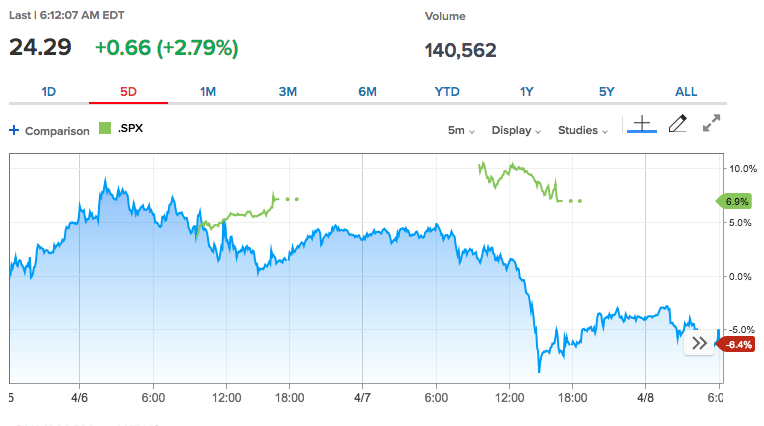
It’s all fun and games until crude oil crashed into the 2:30 p.m. EST settlement and the S&P 500 followed suit into the closing bell. Crude is bouncing back a bit on Wednesday and ahead of the scheduled teleconference meeting amongst OPEC+ members, but the meeting has already been delayed once due to bickering between Saudi Arabia and Russia. Nonetheless, it’s hard to imagine anybody wants to short crude oil ahead of the meeting.
It’s likely best to remain patient during uncertain times in the economy and the market. As volatility remains elevated, expect large moves in equities to remain part of the landscape. We would anticipate some further relaxing of market volatility should the epidemic curve continue to improve and coincide with the economy normalizing around the end of April or early May.
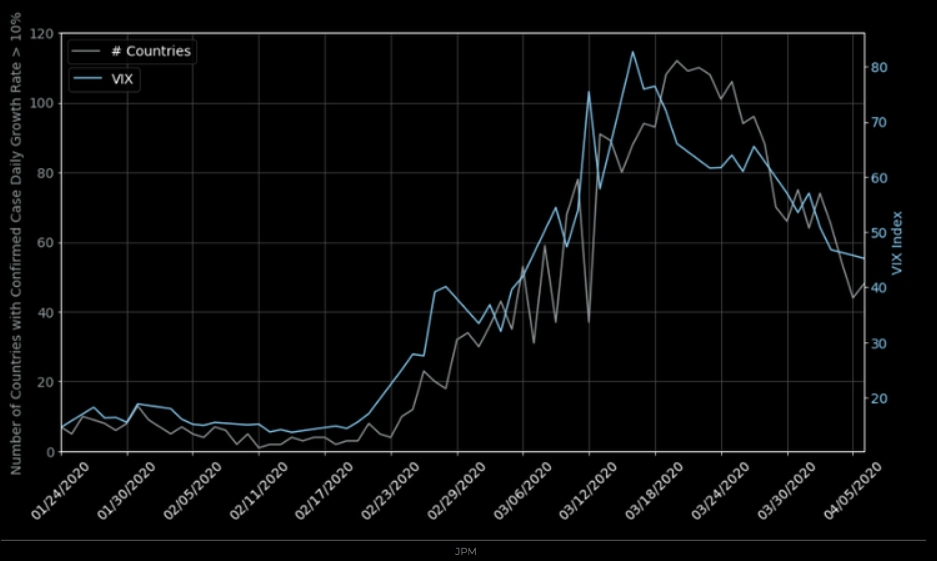
To-date, the VIX has been very much following the epidemic curve.


